
Figure 1
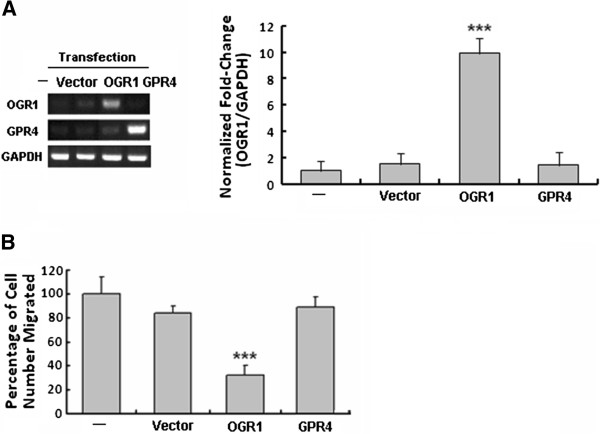
OGR1, but not GPR4, over-expression inhibited cell migration of MCF7 human breast cancer cells. Using transiently transfected cells (72 h post-transfection, by RT-PCR and real-time PCR (A)), cell migration was analyzed by transwell migration assays (B). ***P<0.001. Data are representative of three independent experiments.
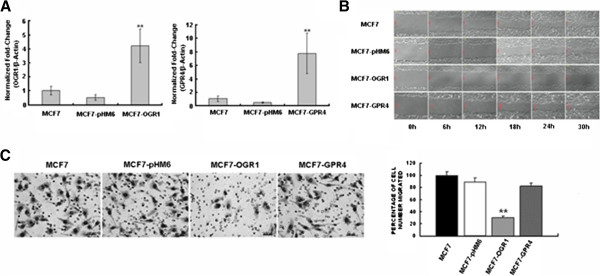
Figure 2
Stable over-expression of OGR1 inhibited MCF7 cell migration in vitro. (A) Identification of MCF7 clones stably over-expressing OGR1 (left panel) or GPR4 (right panel) by real-time RT-PCR. (B) The motility of each cell clone was assessed by wound-healing assays. Cells migrated were monitored every hour in a Multi-Dimensional Workstation for Live Cell Imaging (Carl Zeiss). (C) Cell migration was analyzed using transwell assays (left). Representative images of cell migrated to the bottom of the inserts of the control cells (MCF7, MCF7-pHM6), MCF7-OGR1, or MCF7-GPR4 cells (left) and the mean percentage of cells migrated (right) are shown. ** P<0.01. Data are representative of three independent experiments.
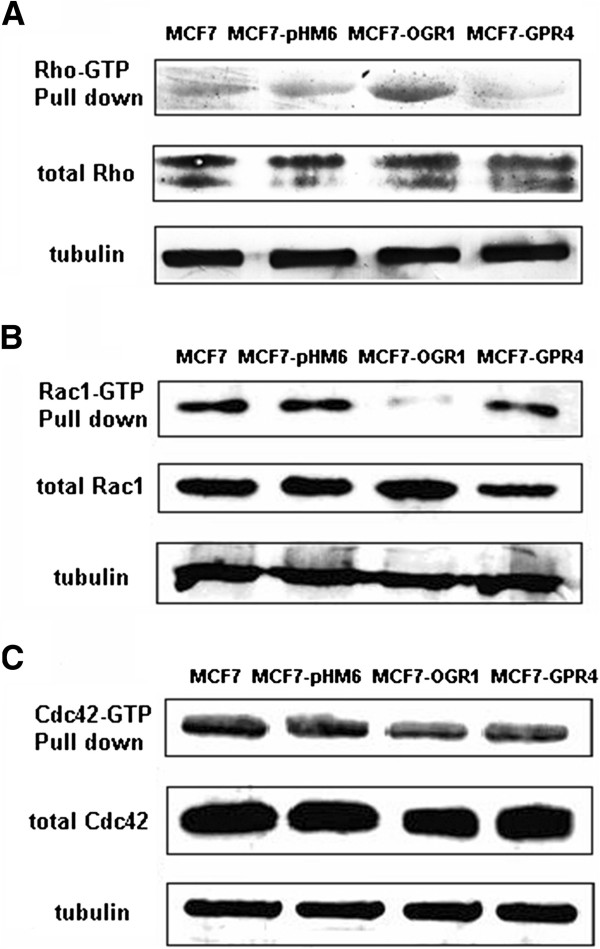
Figure 3
Effects of OGR1 over-expression on the activity of Rho family members in MCF7 cells. The activation levels of Rho (A), Rac1 (B) and Cdc42 (C) were examined by pull-down and Western blot analyses as described in Materials and Methods. Total Rho, Rac1, and Cdc42, as well as α-tubulin were analyzed in whole cell lysates. Representative results are from three independent experiments.
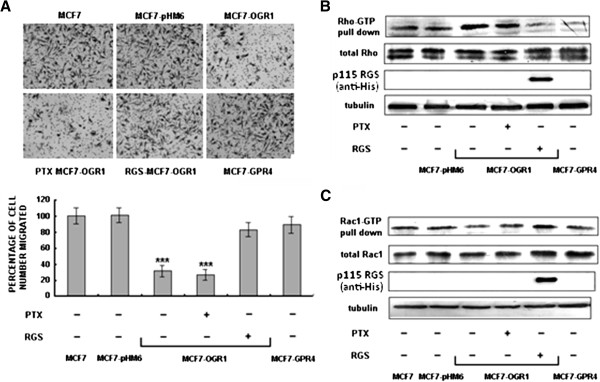
Figure 4
OGR1 inhibited MCF7 breast cancer cell migration through a Gα12/13-Rho-Rac1 pathway. Cells were pretreated with the solvent or PTX (1 μM) for 16 h, or transfected with the RGS plasmid for 48 h. (A) Cell migration was analyzed by transwell migration assays after treatment or using transient transfected cells 72 h post-transfection. ***P<0.001. (B) and (C) The protein activation levels were examined by pull-down and Western blot analyses as described in Methods. Rho, Rac1, Cdc42 and p115 RGS,as well as α-tubulin were analyzed in whole cell lysates. Representative results are from three independent experiments.
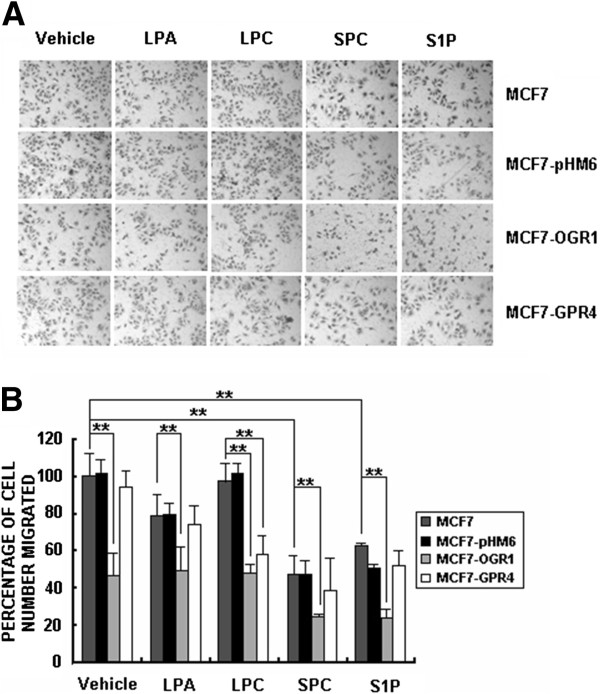
Figure 5
Lysophoslipids (LPLs) did not modulate the effects of OGR1 on cell migration in MCF7 breast cancer cells. Cells were treated with vehicle, LPA, LPC, SPC or S1P (all at 2 μM) and cell migration was analyzed by transwell migration assays. Representative images of cell migrated to the bottom of the inserts (A) and the mean percentage of cells migrated (B) are shown. **P<0.01. Data are representative of three independent experiments.