
Figure 1
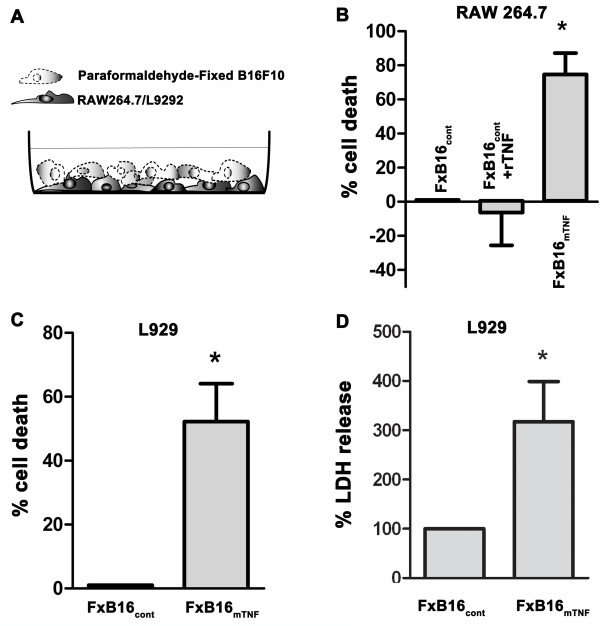
Membrane TNF-α isoform effectively induces cell death. A, Schematic diagram of fixed B16F10 cells cocultured with L929/RAW264.7. B, RAW cells were cocultured with paraformaldehyde-fixed control (FxB16cont), control + rTNFα (FxB16cont + TNFα), or mTNFα (FxB16mTNF) for 24 hours. Cell death was measured by MTT assay. C, MTT assay showing the cytotoxic effects of mTNF-α isoform on L929. D, LDH assay measuring L929 cells percent LDH leakage, in the presence of control or mTNF-expressing fixed B16F10 tumor cells. Data show the percentage of LDH leakage into media to total LDH (media + cells). Each sample was assayed in triplicate, with each experiment repeated at least 3 times independently. Data are expressed as average ± S.E. *P < 0.05 and **P < 0.005, 1-way ANOVA of log (10) transformed data with Student’s t-test as post-test (B), students’s t-test (C and D).
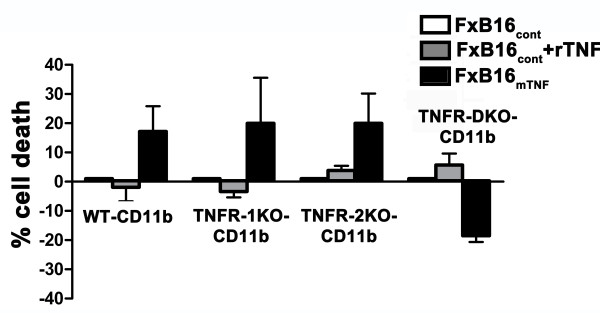
Figure 2
Membrane TNF-induced cell death can be mediated through both TNFR-1 and TNFR-2. Freshly isolated CD11b myeloid cells from wild type mice (WT-CD11b), mice deficient in TNF receptor 1 (TNFR-1KO-CD11b), TNFR-2KO-CD11b or both receptors (TNFR-DKO-CD11b). Cells were cocultured with paraformaldehyde-fixed control (FxB16cont), control in the presence of 100 U/ml recombinant TNFα (FxB16cont + rTNF), or mTNFα (FxB16mTNF) for 24 hours. Percentage of cell death was measured by MTT assay. Data present mean percentage (bars, mean ± S.E.) of three replicates from 3 independent experiments.
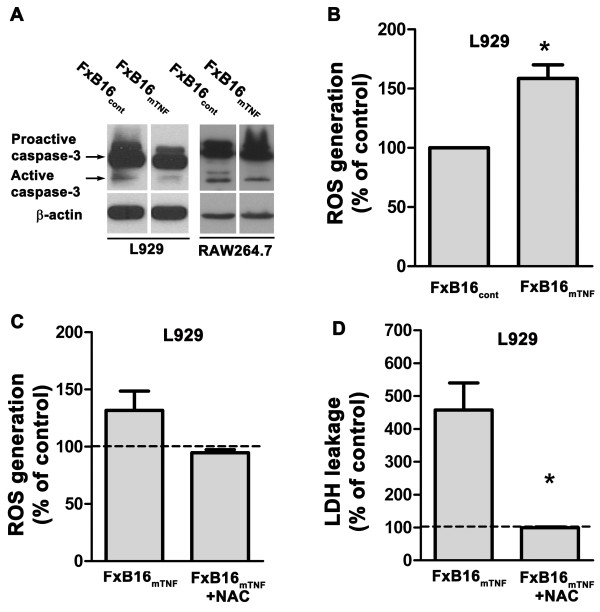
Figure 3
Membrane TNF-α exerts cell cytotoxicity by increasing intracellular ROS production. A, caspase-3 activity in L929 and RAW 264.7 cells after incubation with paraformaldehyde-fixed control (FxB16cont) or mTNFα (FxB16mTNF) for 30 minutes. L929 cells were harvested and total cellular protein was analyzed for active caspase-3. B, ROS production measured by CM-H2CDFDA intensity in L929 cocultured with fixed control or mTNF-expressing B16F10. CandD, Addition of N-acetyl cysteine (2 mM) reduced ROS level (C) and decreased LDH leakage into the media (D) in L929 cells. Data are represented as percent of CM-H2DCFDA intensity (C) or LDH in media/total LDH (D) to L929 cells cocultured with FxB16cont cells with or without NAC. Data are expressed as average ± S.E. *P < 0.05 and **P < 0.005.
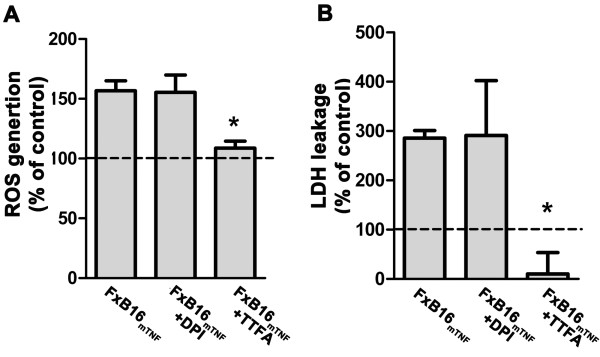
Figure 4
Inhibition of mitochondrial respiratory chain decreases mTNF-mediated ROS generation. AandB, L929 cell cocultured with mTNF-expressing tumor cells in the absence or presence of NOX inhibitor-DPI (2 μM) and mitochondrial complex II inhibitor-TTFA (0.5 μM) for 24 hours. TTFA reduced ROS level, shown by reduction of CM-H2DCFDA intensity (A) and LDH leakage into media (B). Addition of NOX inhibitor-DPI had no effects on both ROS generation of LDH level. Data are represented as % of CM-H2DCFDA intensity (A) or LDH in media/total LDH (B) to L929 cells cocultured with control expressing tumor cells with or without DPI or TTFA. Data are expressed as average ± S.E. *P < 0.05.
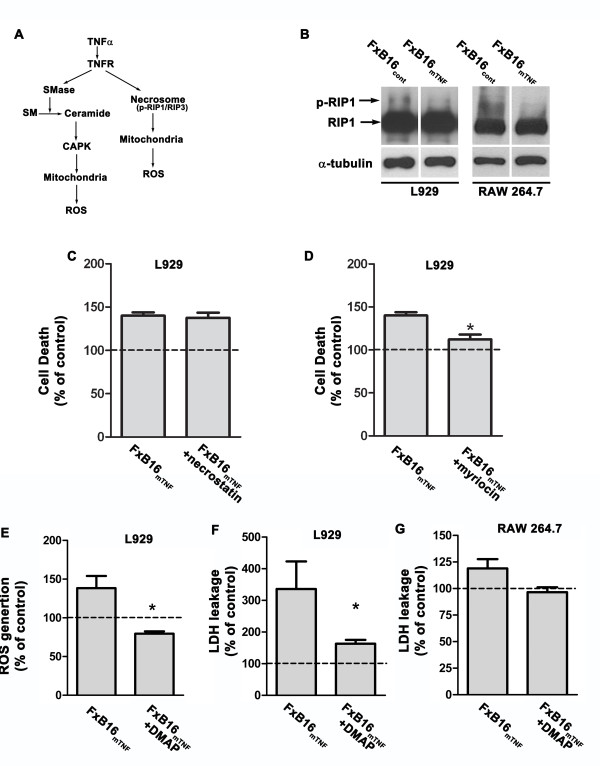
Figure 5
Membrane TNF-mediated ROS production involves ceramide pathway. A, Schematic diagram of TNF-activated pathways leading to ROS generation. B, level of phospho-RIP1 in L929 or RAW 264.7 cells treated with fixed B16F10 control cells (FxB16cont) or B16F10 mTNF (FxB16mTNF) cells. After 30 min incubation, L929 cells were harvested and total cellular protein was analyzed for RIP-1. C, inhibition of Rip-1 caused no change in L929 cell death as measured by MTT assay D, inhibition of ceramide synthesis with myriocin decreased mTNF-mediated L929 cell death. E-G, inhibition of CAPK reduced mTNF-mediated ROS generation (E) and LDH release in L929 (F) and LDH release in RAW26.7 (G). Data are expressed as average ± S.E. *P < 0.05.