
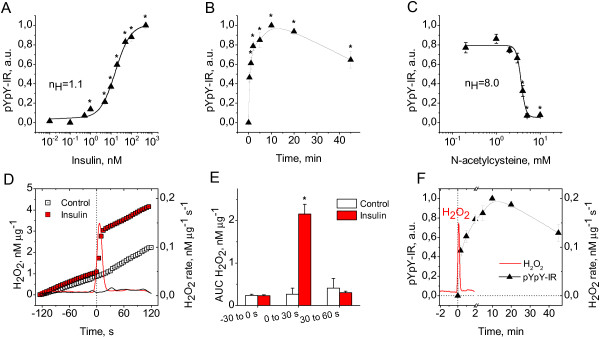
Figure 1
Relationship between H2O2 signal and receptor autophosphorylation in neurons stimulated with insulin. (A) Insulin dose–response for receptor autophosphorylation in CGN exposed to insulin for 10 min (black triangles, mean±SEM of 5 to 9 cultures, *P<0.05 vs. control). (B) Time course of receptor autophosphorylation in CGN exposed to 100 nM insulin (black triangles, mean±SEM of 3 to 4 cultures, *P<0.05 vs. baseline). (C) N-acetylcysteine dose–response for receptor autophosphorylation in CGN exposed to 100 nM insulin for 10 min (black triangles, mean±SEM of 3 to 7 cultures, *P<0.05 vs. 100 nM insulin). (D) Left Y axis: time courses of H2O2 efflux from CGN exposed to vehicle (white squares, mean of 3 culture dishes) or 100 nM insulin (red squares, mean of 10 culture dishes). Right Y axis: first time derivative (rate) of H2O2 efflux from CGN exposed to vehicle (black line) or 100 nM insulin (red line). (E) Areas under curves (AUC) for 30-s periods of H2O2 efflux from CGN exposed to vehicle (white columns, mean±SEM, n=3) or 100 nM insulin (red columns, mean±SEM, n=10, *P<0.05 vs. control). (F) Time courses for insulin-stimulated H2O2 efflux and receptor autophosphorylation. Left Y axis: time course of receptor autophosphorylation in CGN exposed to 100 nM insulin (black triangles, mean±SEM of 3 to 4 cultures). Right axis: first time derivative (rate) of H2O2 efflux from CGN exposed to 100 nM insulin (red line, mean of 10 culture dishes).
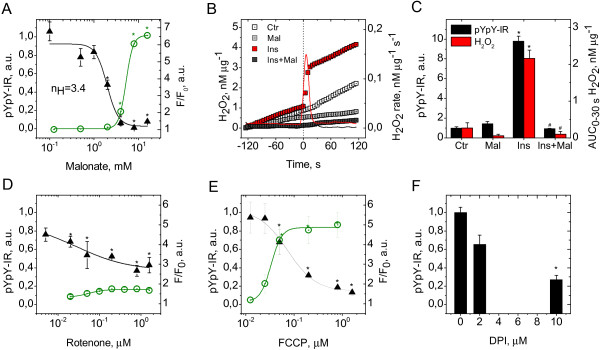
Figure 2
Effects of inhibitors on H2O2 signal and receptor autophosphorylation in neurons stimulated with 100 nM insulin. (A) Left Y axis: malonate dose–response for receptor autophosphorylation in CGN exposed to insulin (triangles, mean±SEM of 3-11 cultures, *P<0.05 vs. insulin). Right Y axis: malonate effect on Rhodamine 123 fluorescence in CGN (circles, mean±SEM of 3-7cultures, *P<0.05 vs. control). (B) Left Y axis: kinetics of H2O2 efflux from CGN exposed to vehicle (mean of 3 cultures), 6 mM malonate (mean of 3 cultures), insulin (mean of 10 cultures), or insulin plus 6 mM malonate (mean of 5 cultures). Right Y axis: rates of H2O2 efflux from CGN exposed to insulin (red line) or insulin plus 6 mM malonate (grey line). (C) Left Y axis: receptor autophosphorylation in CGN exposed to vehicle, 6 mM malonate, insulin, or insulin plus 6 mM malonate (mean±SEM of 5-11 cultures. *P<0.05 vs. control. #P<0.05 vs. insulin). Right Y axis: areas under curves of H2O2 efflux from CGN exposed to vehicle, 6 mM malonate, insulin, or insulin plus 6 mM malonate for 30 s (mean±SEM of 3-10 cultures. *P<0.05 vs. control. #P<0.05 vs. insulin). (D) Left Y axis: rotenone dose–response for receptor autophosphorylation in CGN exposed to insulin (triangles, mean±SEM of 3-4 cultures, *P<0.05 vs. insulin). Right Y axis: rotenone effect on Rhodamine 123 fluorescence in CGN (circles, mean±SEM of 3-4 cultures, *P<0.05 vs. control). (E) Left Y axis: FCCP dose–response for receptor autophosphorylation in CGN exposed to insulin (triangles, mean±SEM of 3-5 cultures, *P<0.05 vs. insulin). Right Y axis: FCCP dose-response for Rhodamine 123 fluorescence in CGN (circles, mean±SEM of 4-8 cultures, *P<0.05 vs. control). (F) DPI effect on receptor autophosphorylation in CGN exposed to insulin (mean±SEM of 3 cultures, *P<0.05 vs. insulin).
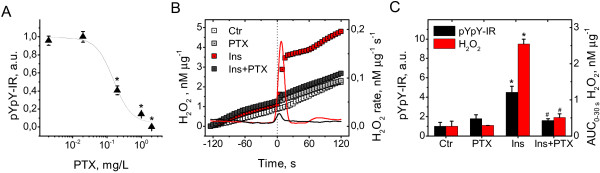
Figure 3
Effects of pertussis toxin on H2O2 generation and receptor autophosphorylation neurons stimulated with insulin. (A) PTX dose–response curve for receptor autophosphorylation in CGN exposed to 100 nM insulin for 10 min (black triangles, mean±SEM of 3 to 8 cultures, *P<0.05 vs. 100 nM insulin). (B) Left Y axis: time courses of H2O2 efflux from CGN exposed to control buffer (white squares, mean of 3 culture dishes), 2 mg/L PTX (light grey squares, mean of 3 culture dishes), 100 nM insulin (red squares, mean of 3 culture dishes), or 100 nM insulin plus 2 mg/L PTX (grey squares, mean of 3 culture dishes). Right Y axis: first time derivatives (rates) of H2O2 efflux from CGN exposed to 100 nM insulin (red line) or 100 nM insulin plus 2 mg/L PTX (black line). (C) Left Y axis: receptor autophosphorylation in CGN exposed to control buffer, 2 mg/L PTX, 100 nM insulin, or 100 nM insulin plus 2 mg/L PTX. Black columns represent the mean±SEM of values obtained from 3 to 8 cultures. *P<0.05 vs. control. #P<0.05 vs. insulin. Right Y axis: Areas under curves (AUC) of H2O2 efflux for 30 s from CGN exposed to control buffer, 2 mg/L PTX, 100 nM insulin, or 100 nM insulin plus 2 mg/L PTX. Red columns represent the mean±SEM of values obtained from 3 culture dishes. *P<0.05 vs. control. #P<0.05 vs. insulin.
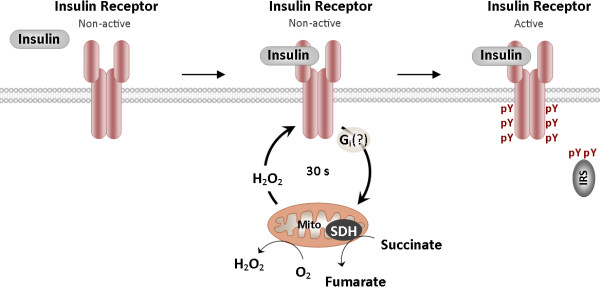
Figure 4
Scheme of functional relationship between insulin receptor and mitochondria during receptor activation in neurons. Insulin stimulation evokes a transient single H2O2 spike with a peak at 5–10 s and duration of less than 30 s. Mitochondrial complex II and, to a lesser extent, I are involved in H2O2 generation. Autophosphorylation only occurs when the H2O2 signal has surpassed a certain threshold. Conversely, if the H2O2 signal does not reach this threshold, no autophosphorylation occurs, even in response to the highest insulin dose. Upon the autophosphorylation, receptor tyrosine kinase becomes fully activated and initiates signaling to the inside of the neuron. Therefore, the receptor is activated if two conditions are met: 1) insulin binds to the receptor, and 2) the H2O2 signal exceeds a certain threshold, enabling receptor autophosphorylation.