
Figure 1
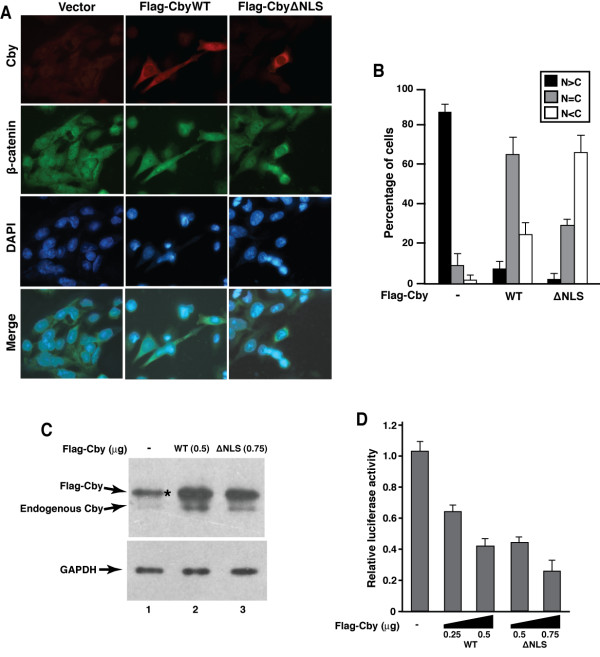
Forced expression of Cby in SW480 colon cancer cells promotes translocation of nuclear β-catenin towards the cytoplasm, resulting in inhibition of endogenous β-catenin signaling.(A) SW480 cells were transiently transfected with a control empty vector or an expression plasmid for Flag-tagged CbyWT or Cby∆NLS, and doubly immunostained with anti-Cby (red) and anti-β-catenin (green) antibodies. Nuclei were stained with DAPI. A merged image of β-catenin and DAPI is also shown. (B) Quantitative analysis of the results in (A). The subcellular localization of endogenous β- catenin was scored as follows: N>C, predominantly nuclear; N=C, evenly distributed between the nucleus and cytoplasm; N<C, predominantly cytoplasmic. Error bars represent the means ± SD of three independent experiments. For cells transfected with Cby plasmids, β-catenin localization was scored only in those expressing ectopic Cby. (C) Western blot analysis of Cby expression in SW480 cells using anti-Cby antibody. Note that, to compensate protein levels, higher amounts of DNA for Cby∆NLS were used for transfection. The anti-Cby antibody detected both exogenous and endogenous proteins. An asterisk indicates a non-specific band that overlaps with Flag-Cby. GAPDH was used to confirm equal loading. (D) The ability of Cby to repress endogenous β- catenin signaling was tested by TopFlash assays. SW480 cells were transfected with 100 ng of TopFlash luciferase reporter and the indicated amounts of a Flag-tagged Cby expression plasmid. Luciferase activity was measured 24 h post-transfection, and normalized to Renilla luciferase activity used as an internal control. All transfections were carried out in triplicates and the means ± SD are shown.
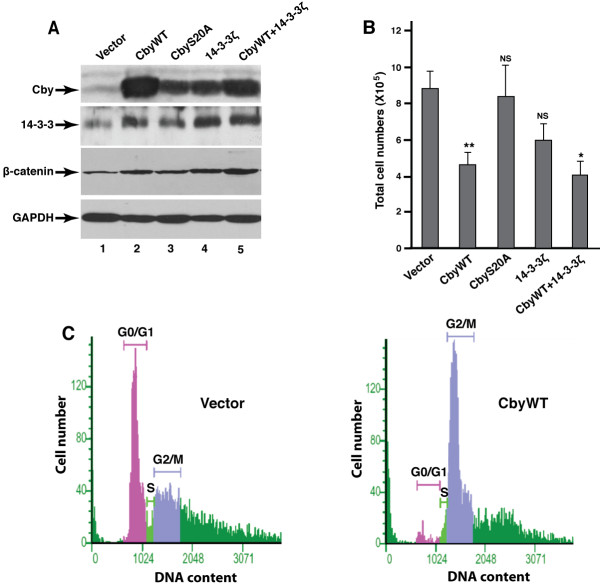
Figure 2
Stable expression of Cby reduces SW480 cell growth.(A) Stable SW480 cell lines expressing CbyWT, CbyS20A, 14-3-3ζ or both Cby and 14-3-3ζ, and vector- control cells were established, and the cell lysates were analyzed by western blotting using antibodies against Cby, 14-3-3, β-catenin and GAPDH. (B) The stable SW480 cell lines were seeded on 24-well plates (105cells/well), and total cell numbers were counted 5 days later. The data are the means ± SE of triplicate samples and representative of three independent experiments. Student’s t-test; *P < 0.05, **P < 0.01, NS = not significant when compared with vector-control cells. (C) Cell cycle analysis of vector-control and CbyWT-expressing cells. Following propidium iodine staining, the DNA content of individual cells was measured by flow cytometry. The data shown are from one representative experiment out of three.
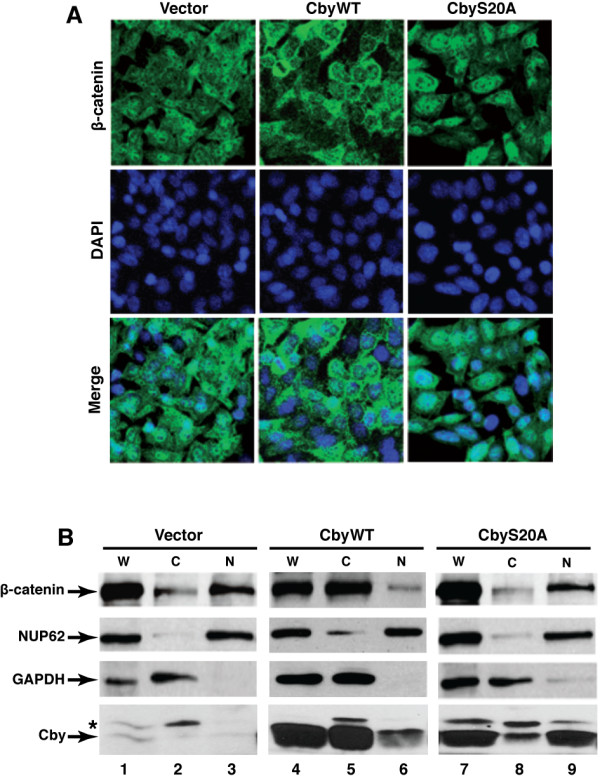
Figure 3
Cby facilitates nuclear export of endogenous β-catenin.(A) SW480 cells stably expressing CbyWT or CbyS20A and control cells were fixed and subjected to immunofluorescence staining of endogenous β-catenin (green). Nuclei were visualized with DAPI. (B) Whole-cell (W), nuclear (N) and cytoplasmic (C) extracts were prepared from the indicated SW480 stable cells, and β-catenin levels were analyzed by western blotting. The relative purity of nuclear and cytoplasmic fractions was evaluated by probing for nucleoporin p62 (NUP62) and GAPDH, respectively.
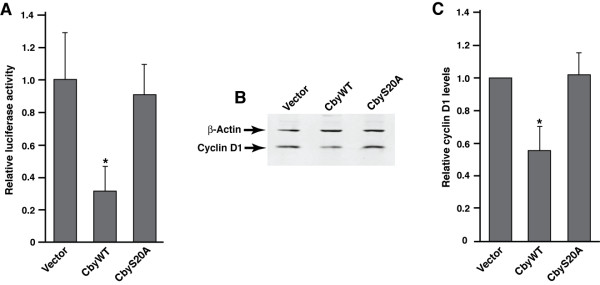
Figure 4
β-Catenin signaling activity is attenuated in SW480 cells stably expressing Cby.(A) CbyWT, but not CbyS20A, represses TopFlash activation. SW480 stable cells were transfected in 24-well plates with 25 ng of TopFlash or mutant FopFlash reporter as well as a Renilla luciferase plasmid to normalize transfection efficiency. Luciferase activities were measured 48 h post-transfection, normalized and corrected for background by subtraction of FopFlash values from corresponding TopFlash values. Each transfection was performed in triplicate and repeated at least three times. Shown are the means ± SD from one representative experiment. Student’s t-test; *P < 0.05 when compared with vector-control cells. (B) CbyWT, but not CbyS20A, inhibits cyclin D1 expression. Whole-cell lysates from the indicated SW480 stable cells were subjected to western blot analysis for cyclin D1 and beta-actin as a loading control. (C) Quantification of cyclin D1 expression levels. The intensity of cyclin D1 bands from western blots was quantified using the NIH Image software and normalized to that of beta-actin bands. Data are the mean band intensities ± SD from at least three independent experiments. Student’s t-test; *P < 0.05 when compared with vector-control cells.