
Figure 1
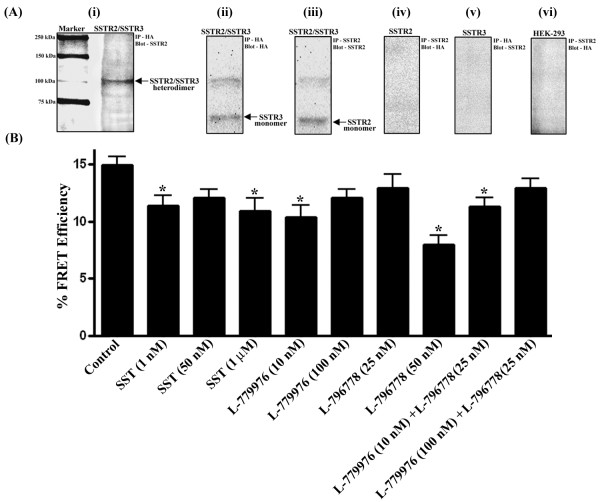
SSTR2/SSTR3 exhibit heterodimerization at cell surface A (i). Membrane extracts prepared from cotransfected cells were immunoprecipitated with HA antibody (SSTR3) and probed for SSTR2 as described in Materials and methods. The receptor-specific band for the heteromeric complex of SSTR2/SSTR3 was detected at the expected size of ~117 kDa. A (ii-iii). The membranes were reprobed to detect SSTR3 and SSTR2 monomers, respectively. A (iv-vi). The specificity of the heterodimer was confirmed in HEK-293 cells and monotransfectants expressing SSTR2 and SSTR3 B. Cotransfected cells were treated with SST (1, 50 nM and 1 μM), L-779976 (10 and 100 nM) and L-796778 (25 and 50 nM) or in combination for 10 min at 37°C and subjected to microscopic Pb-FRET analysis. Histogram represents relative FRET efficiency of 14.9% in control suggesting the presence of SSTR2/SSTR3 heterodimers. However, the heterodimer is stable upon treatment with SST and receptor-specific agonists, albeit with decreased relative FRET efficiency. Results are expressed as mean ± S.D of three independent experiments.
Table 1
Photobleaching time-constants and relative-FRET efficiencies in HEK-293 cells coexpressing SSTR2 and SSTR3
| Treatment | τ avg (s) | n | E (%) | |
|---|---|---|---|---|
| D + A | 22.5 ± 0.5 | 54 | ||
D − A and D + A correspond to donor without and with acceptor, respectively; τavg refers to average of n photobleaching time constants; n is the total number of cells analyzed; E (%) is mean relative FRET efficiency. Mean ± SD is representative of three independent experiments (*, p < 0.05).
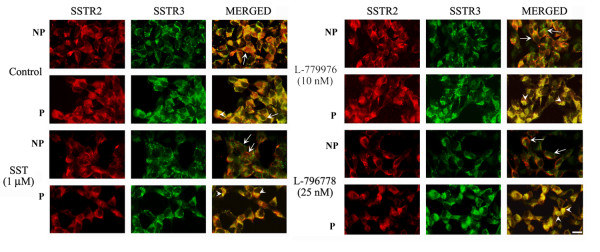
Figure 2
Representative photomicrographs illustrating fluorescence analysis and internalization of SSTR2 and SSTR3 upon agonist treatment. Cotransfected cells were treated with SST (1 μM), L-779976 (10 nM) and L-796778 (25 nM) for 15 min at 37°C, and processed for immunocytochemistry as described in Materials and methods. Fluorescent microscopic images show distribution of SSTR2 (red), SSTR3 (green) and colocalization (yellow) at the cell surface and intracellularly. SSTR2 and SSTR3 display colocalization at the cell surface and internalize upon treatment with SST and specific agonists. Note that activation of one receptor caused a significant down-regulation of both receptors at cell surface. Arrows and arrowheads in the merged panel represent membrane and cytosolic expression, respectively. Scale bar = 10 μm. Data are representative of mean ± S.D of three independent experiments.
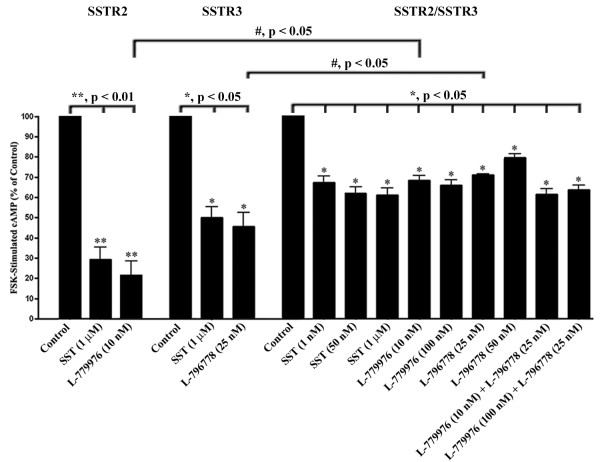
Figure 3
cAMP inhibition upon activation of SSTR2/SSTR3. Mono- and/or cotransfected expressing SSTR2 and SSTR3 were pre-treated with 3-isobutyl-1-methylxanthine (0.5 mM) for 30 min followed by addition of FSK (20 μM) in the presence or absence of SST (1, 50 nM and 1 μM), and receptor-specific agonists L-779976 (10 and 100 nM) and L-796778 (25 and 50 nM), or as indicated for 30 min at 37°C and processed for cAMP assay. Note the significant inhibition of FSK-stimulated cAMP in the presence of SST and receptor-specific agonists; an indication that SSTR2/SSTR3 complex in cotransfected cells is functionally active, albeit at a lesser degree than the monotransfectants. Data represent mean ± S.D of three independent experiments.
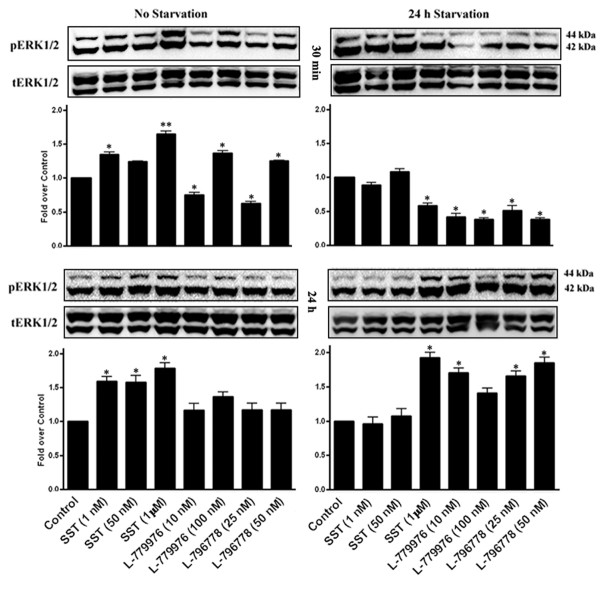
Figure 4
Concentration and time-dependent modulation of ERK1/2 phosphorylation by SSTR2/SSTR3. Cells stably cotransfected with SSTR2 and SSTR3 were treated with SST (1, 50 nM and 1 μM), L-779976 (10 and 100 nM) and L-796778 (25 and 50 nM) for 30 min (top panel) or 24 h (bottom panel) with or without FBS, and processed for total and pERK1/2 using Western blot analysis. Note a distinct pattern of ERK1/2 phosphorylation in response to SST and receptor-specific agonists in a concentration and time-dependent manner. Histograms represent the densitometric analysis and the results are presented as the ratio of phospho- and total-ERK1/2 expressed as fold over control. Mean ± S.D is representative of three independent experiments.
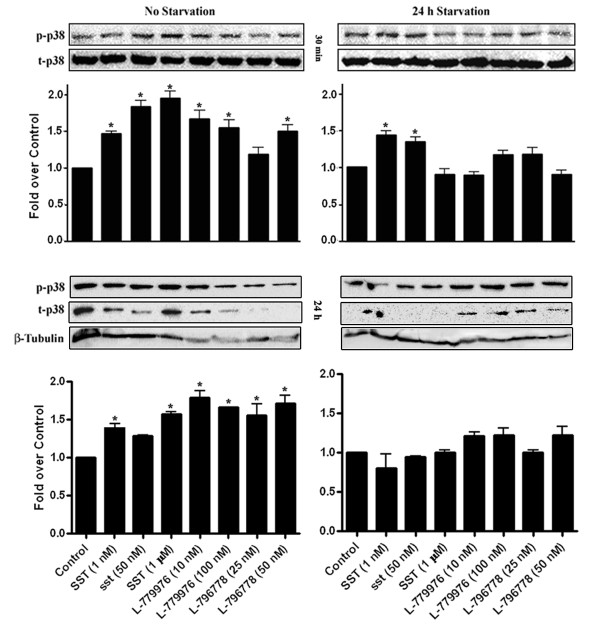
Figure 5
Modulation of p38 phosphorylation in response to SSTR2/SSTR3 activation. Cotransfected cells were treated with SST (1, 50 nM and 1 μM), L-779976 (10 and 100 nM) and L-796778 (25 and 50 nM) for 30 min (top panel) or 24 h (bottom panel) in the presence or absence of FBS, and processed for total and p-p38 using Western blot analysis. p38 phosphorylation increased upon treatment with SST and receptor-specific agonists for 30 min. In serum-deprived conditions, SST significantly increased p38 activation, whereas the effects of independent receptor activation were comparable to control. Prolonged treatment with SST and receptor-specific agonists significantly increased p-p38 levels, whereas in serum-deficient conditions, no significant changes were observed between treatment and control. Histograms represent the densitometric analysis and the results are presented as the ratio of phospho- and total-p38 (top panel) or phospho-p38 and β-Tubulin (bottom panel) expressed as fold over control. Mean ± S.D is representative of three independent experiments.
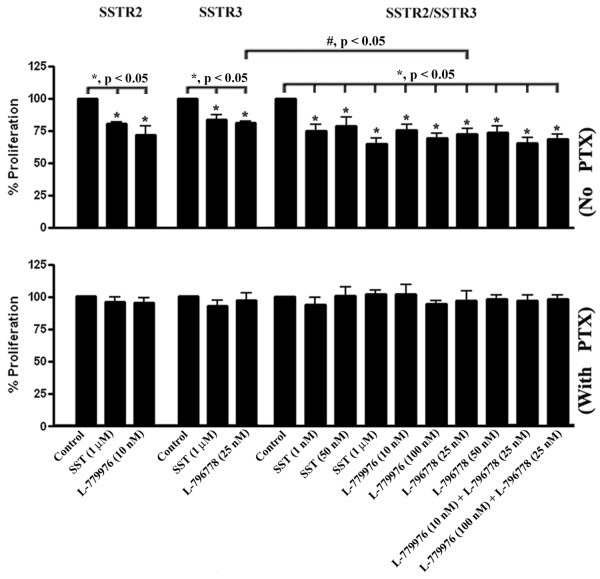
Figure 6
The antiproliferative activity of SSTR2/SSTR3. Mono- and cotransfected cells expressing SSTR2 and SSTR3 in the absence (top panel) and presence (bottom panel) of PTX were subjected to treatment with SST (1, 50 nM and 1 μM), L-779976 (10 and 100 nM) and L-796778 (25 and 50 nM) or as indicated for 24 h and processed for MTT assay. SST and receptor-specific agonists significantly inhibited cell proliferation in cotransfected cells in a PTX-sensitive manner. Note an increased antiproliferative effect of SSTR3-specific agonist in cotransfected cells when compared to monotransfectants expressing SSTR3. Data are presented as mean ± S.D of three independent experiments.
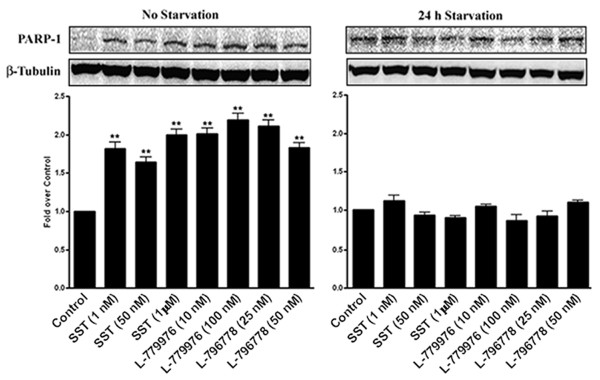
Figure 7
The cytotoxic role for SSTR2/SSTR3. Stable cotransfectants of SSTR2 and SSTR3 were subjected to 24 h treatment with SST (1, 50 nM and 1 μM), L-779976 (10 and 100 nM) and L-796778 (25 and 50 nM) in the presence or absence of serum-starvation and processed for PARP-1 expression by Western blot analysis. Cells treated with SST and receptor-specific agonists displayed increased expression of PARP-1. Note a high basal PARP-1 expression in serum-deprived conditions with no significant changes in response to SST and receptor specific agonists. β-Tubulin was used as a loading control. Data represent mean ± S.D of three independent experiments.
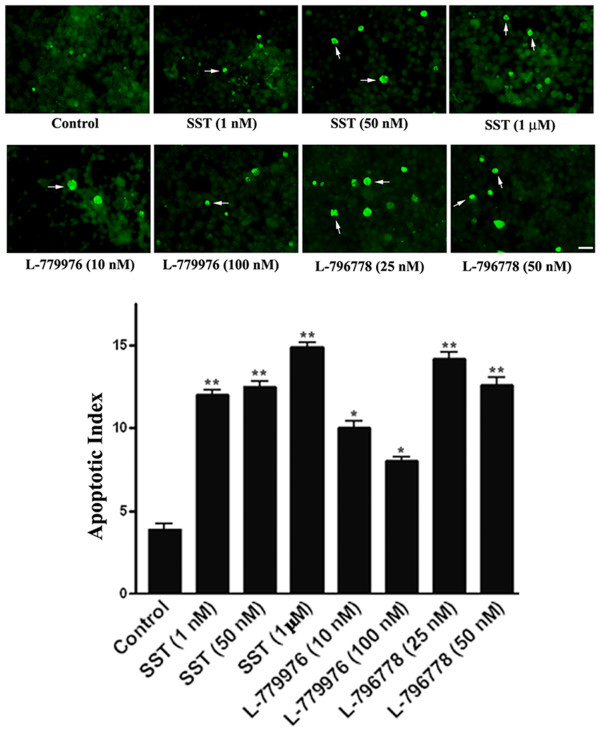
Figure 8
Representative photomicrographs illustrating TUNEL positive cells as an index of apoptosis. HEK-293 cells cotransfected with SSTR2/SSTR3 were treated with SST (1, 50 nM and 1 μM), L-779976 (10 and 100 nM) and L-796778 (25 and 50 nM) for 24 h, and processed for TUNEL staining. SST and receptor-specific agonists increased TUNEL labeling indicating cytotoxic role for SSTR2 and SSTR3. Histogram represents quantitative analysis of apoptotic cells. A total of 600–750 cells were counted for each treatment. Arrows in representative panels indicate apoptotic cells. Scale bar = 10 μm. Mean ± S.D is representative of three independent experiments.
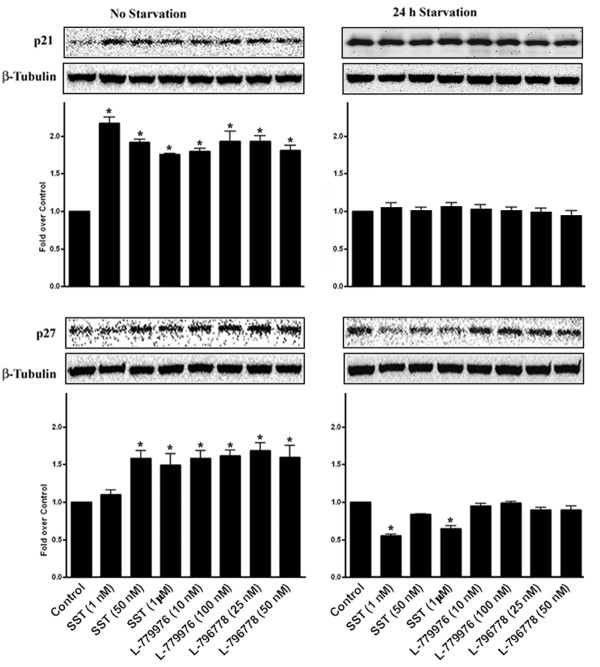
Figure 9
p21 and p27Kip1mediated cytostatic effects upon activation of SSTR2/SSTR3. Cotransfected cells were treated with SST (1, 50 nM and 1 μM), L-779976 (10 and 100 nM) and L-796778 (25 and 50 nM) for 24 h with or without serum starvation and processed for p21 (top panel) and p27Kip1 (bottom panel) expression using Western blot analysis. Induction of p21 and p27Kip1 in response to SST and receptor-selective agonists suggests a cytostatic role for both receptors. The high basal levels of p21 observed in serum-deprived cells were maintained upon treatment with SST and specific agonists. Conversely, SST decreased p27Kip1 expression in cotransfected cells by ~50% in FBS-deficient conditions. β-Tubulin was used as a loading control. Results are expressed as mean ± S.D of three independent experiments.