
Figure 1
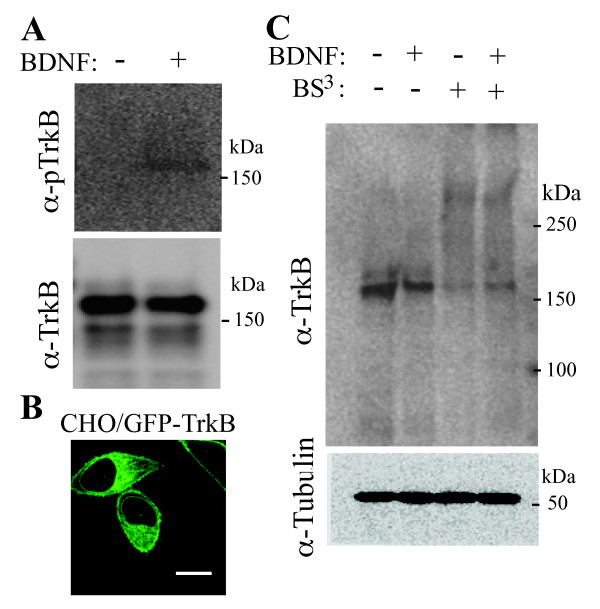
Chemical crosslinking of TrkB on the cell surface. (A) CHO cells expressing GFP-TrkB were stimulated with (+) or without (-) 100 ng/ml of BDNF for 5 min at 37°C. The cells were lysed and subjected to Western blotting with antibodies, α-pTrkB or α-TrkB, against phosphorylated TrkB or TrkB, respectively. Note that the fusion receptors were phosphorylated only in the presence of BDNF. (B) CHO cells expressing GFP-TrkB were serum-starved for 3 h as described in Methods. Fluorescence signal of GFP were observed by confocal microscopy. This figure represents > 10 similar images observed. Bars, 10 μm. (C) CHO cells expressing GFP-TrkB were serum-starved, and then were incubated with culture media containing 0.45 M sucrose for 20 min at 37°C. After being incubated in the presence (+) or absence (-) of 100 ng/ml of BDNF for 5 min at 37°C, the cells were treated with (+) or without (-) the chemical cross-linker BS3 as described in Methods. The cells were lysed and subjected to Western blotting, with antibody against TrkB. This figure represents similar results of three independent experiments. Alpha-tubulin was visualized as a reference. The positions of molecular weight standards are shown at the right of each panel.
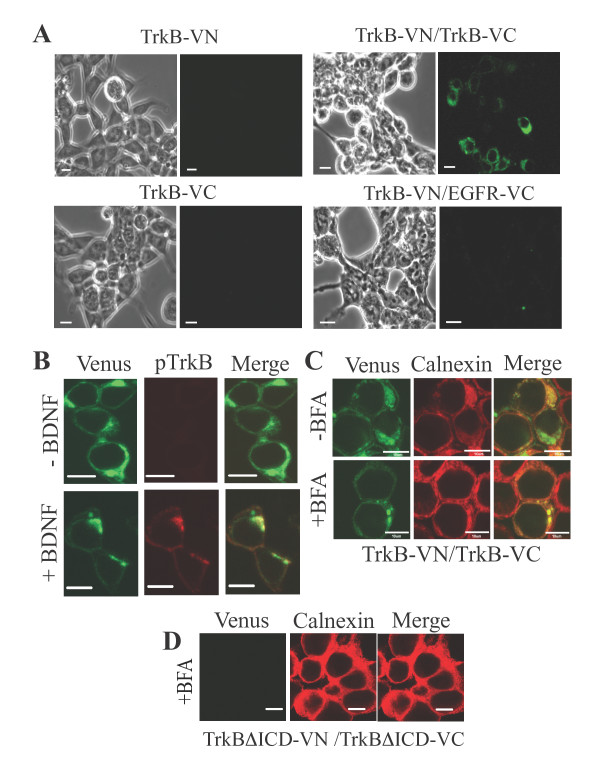
Figure 2
BiFC assay of TrkB homodimers. (A) HEK 293 cells were transfected with TrkB-VC alone, TrkB-VN alone, TrkB-VN and TrkB-VC, or TrkB-VN and EGFR-VC. Twenty-four hours after the transfection, Venus fluorescence signals were observed by confocal microscopy. This figure represents > 20 similar images observed. (B) HEK 293 cells co-expressing TrkB-VN and TrkB-VC were treated with (+) or without (-) 100 ng/ml of BDNF. The cells were fixed, and immunostained with anti-pTrkB primary antibody and then with fluorescently labeled secondary antibody. Fluorescence signals of Venus (green) and pTrkB (red) were observed by confocal microscopy. Note that the green and red fluorescence images do not completely overlap since TrkB-VN and TrkB-VC can form non-fluorescent homodimers. This figure represents > 20 similar images derived from four independent experiments. Bars, 10 μm. (C, D) HEK 293 cells co-expressing TrkB-VN and TrkB-VC (C), or the fusion receptor pair lacking the intracellular domain, TrkBΔICD-VN and TrkBΔICD-VC (D) were treated with (+) or without (-) 10 μg/ml BFA. The cells were fixed, and immunostained with anti-calnexin antibody and then with fluorescently labeled secondary antibody. These figures represent 15 similar images derived from three independent experiments. Bars, 10 μm.
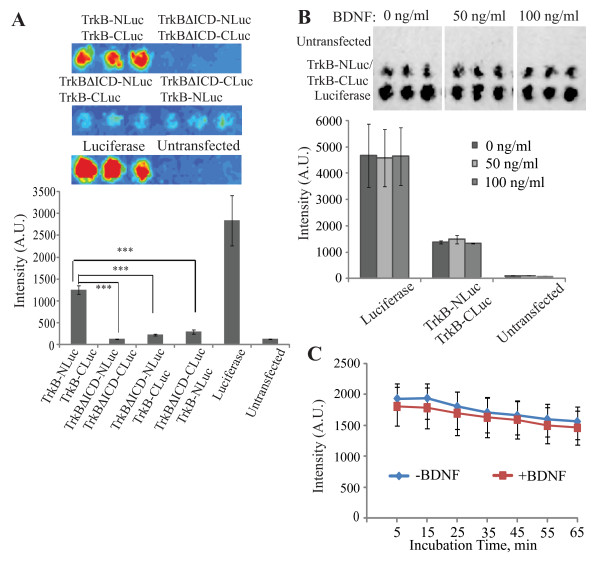
Figure 3
LFC assay of TrkB homodimers. (A) HEK 293 cells expressing indicated protein(s) were cultured in a microtiter plate, and then incubated with luciferin as described in Methods. The red color of the upper panels shows the intensity of bioluminescence produced by the cells in the microtiter wells, and the lower histogram shows the mean ± S.D. of triplicate experiments. *** p < 0.001. (B) HEK 293 cells expressing a full-length luciferase or co-expressing TrkB-NLuc and TrkB-CLuc were treated with BDNF at indicated final concentrations for 10 min, and then incubated with luciferin. The black color of the upper panels shows the intensity of bioluminescence produced by the cells in the micrtotiter wells. The lower histogram shows the mean intensity ± S.D. of triplicate experiments. (C) HEK 293 cells co-expressing TrkB-NLuc and TrkB-CLuc were stimulated with 100 ng/ml of BDNF in the presence of luciferin and 0.45 M sucrose to prevent endocytosis as described in Methods. Data are the mean ± S.D. of triplicate independent experiments.