
Table 1
Site-directed mutagenesis of human WIPI-1
| Mutant | Position | Mutation | PCR oligonucleotides (forward, reverse) |
|---|---|---|---|
| CATATAAAGGTGTGCACTGGATGACGCAACTAG |
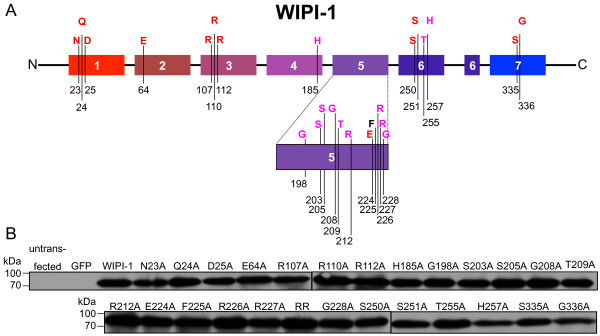
Figure 1
Generation and transient expression of GFP-WIPI-1 mutants in human U2OS cells. (A) Representation of the human WIPI-1 protein harbouring 7 WD repeats (coloured boxes 1–7) and evolutionarily conserved amino acids (homologous amino acids in red, invariant amino acids in purple, not conserved residue in black). (B) Transient over-expression and anti-GFP ECL analysis of GFP-tagged wild-type WIPI-1 (labelled WIPI-1) or generated mutant WIPI-1 variants (labelled N23A – G336) along with the GFP control and untransfected U2OS cells. The RR mutant carries alanine substitutions for both R226 and R227. Supplementary material provides an amino acid sequence alignment of wild-type and mutant WIPI-1 variants deduced from automated DNA sequencing upon site-directed mutagenesis (Additional file 1: Figure S1).
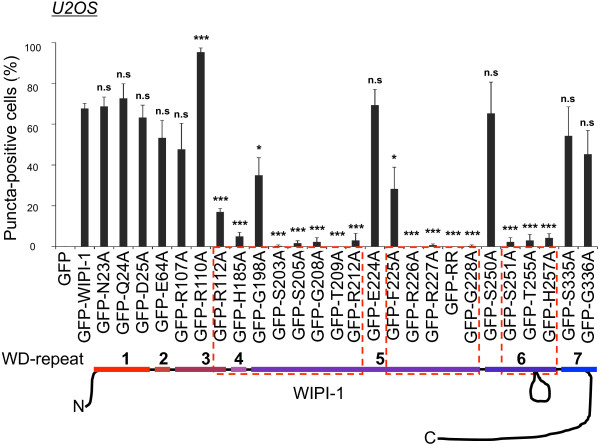
Figure 2
Quantitative puncta-formation analysis of GFP-tagged wild-type or mutant WIPI-1 variants in U2OS cells. U2OS cells transiently expressing GFP-WIPI-1 or GFP-tagged mutant WIPI-1 variants were treated for 3 h with control medium (CM), 233 nM wortmannin (WM), 300 nM rapamycin (RM), or rapamycin plus wortmannin (RM/WM), fixed and analyzed by confocal laser-scanning microscopy. Representative images and quantifications from all treatments are provided (Additional file 3: Table S1, Additional file 4: Figure S3, Additional file 5: Figure S4). From this, the quantification of rapamycin-treated cells is presented here as the percentage of puncta-positive cells for wild-type and mutant GFP-WIPI-1 variants (300 cells per condition, n = 3). P-values (reference GFP-WIPI-1): n.s. ≥ 0.05, * < 0.05, *** < 0.001.
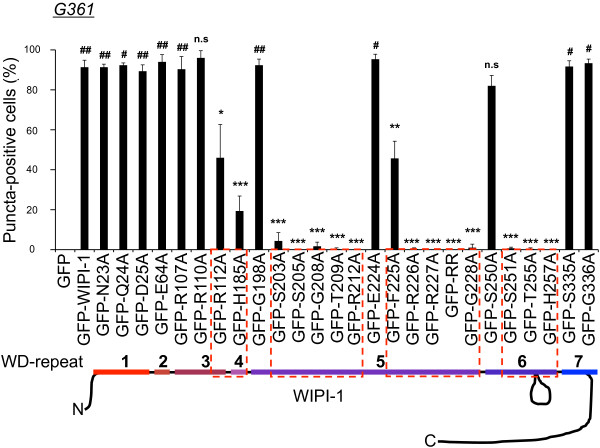
Figure 3
Quantitative puncta-formation analysis of GFP-tagged wild-type or mutant WIPI-1 variants in G361 cells. G361 cells transiently expressing GFP-WIPI-1 or GFP-tagged mutant WIPI-1 variants were treated for 3 h with 300 nM rapamycin (RM), fixed and analyzed by confocal laser-scanning microscopy. Quantifications (Additional file 6: Table S2) are presented as the percentage of puncta-positive cells for wild-type and mutant GFP-WIPI-1 variants (300 cells per condition, n = 3). P-values with regard to GFP-WIPI-1: n.s. ≥ 0.05, * < 0.05, ** < 0.01, *** < 0.001. P-values with regard to the corresponding condition in U2OS cells: # < 0.05, ## < 0.01.
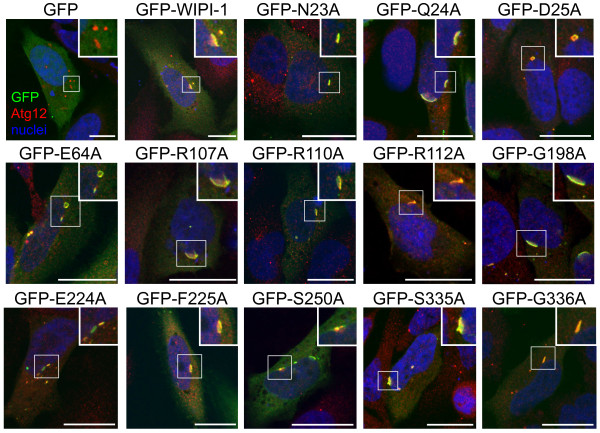
Figure 4
Colocalization of endogenous Atg12 with wild-type GFP-WIPI-1 and puncta-formation competent GFP-WIPI-1 mutants upon rapamycin-mediated induction of autophagy. U2OS cells transiently expressing GFP-WIPI-1 or GFP-tagged mutant WIPI-1 variants were treated for 3 h with 300 nM rapamycin, fixed, stained with anti-Atg12/Alexa 546 antibodies (red) and TOPRO3 (nuclei, blue), and analyzed by confocal laser-scanning microscopy. Merged images are shown. Scale bars 20 μM.
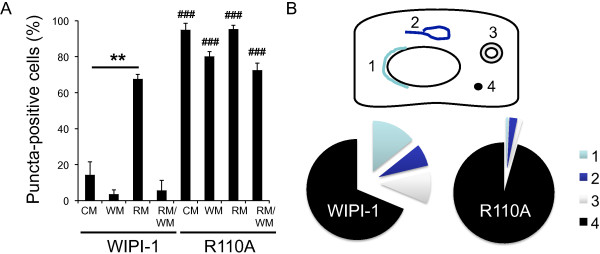
Figure 5
Puncta analysis of the R110A mutant. (A) P-value calculation for quantitative R110A puncta-formation analysis (Additional file 3: Table S1, Additional file 4: Figure S3, Additional file 5: Figure S4) with regard to CM: ** < 0.01; with regard to wild-type GFP-WIPI-1: ### < 0.001. (B) 50 puncta structures of GFP-WIPI-1 or GFP-R110A were categorized (1–4). Further supplementary material is available (Additional file 7: Figure S5).
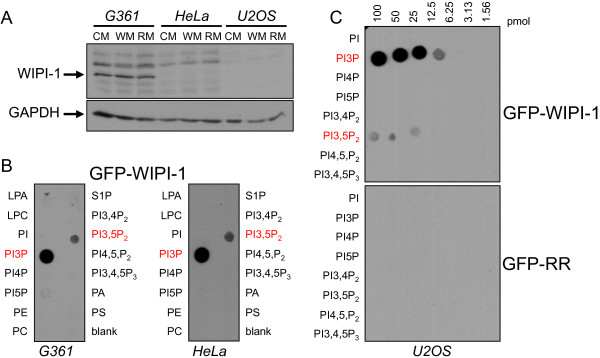
Figure 6
GFP-WIPI-1 binding to PtdIns(3)P and PtdIns(3,5)P2. (A) Western blot analysis of endogenous WIPI-1 protein in G361, HeLa or U2OS cells upon treatments with control medium (CM), 233 nM wortmannin (WM) or 300 nM rapamycin (RM). (B) Transient over-expression of GFP-WIPI-1 in G361 (left panel) or HeLa (right panel) cells followed by protein-phospholipid overlay assays using native cell extracts, adjusted to contain equivalent levels of GFP-WIPI-1 protein. (C) Protein-phospholipid overlay assay using native cell extracts from GFP-WIPI-1 or GFP-RR expressing U2OS cells.
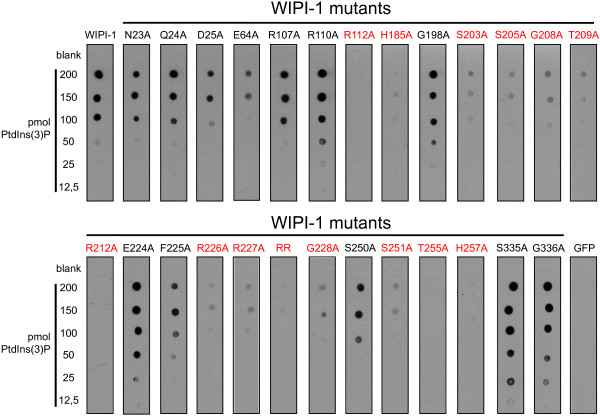
Figure 7
Protein-phospholipid overlay assays with wild-type and mutant GFP-WIPI-1 variants. From U2OS cells transiently expressing GFP-WIPI-1 or GFP-tagged mutant WIPI-1 variants native cell extracts were generated in parallel and used to overlay membrane-immobilized PtdIns(3)P (12,5–200 pmol) followed by anti-GFP ECL detection. Prior to overlaying the membranes with native cell extracts, the volumes of the different extracts were adjusted to include equivalent levels of GFP-WIPI-1 wild-type or mutant protein, judged by anti-GFP western blotting (not shown). Representative results are shown (n = 3). In red, GFP-tagged WIPI-1 mutants unable to bind to PtdIns(3)P.
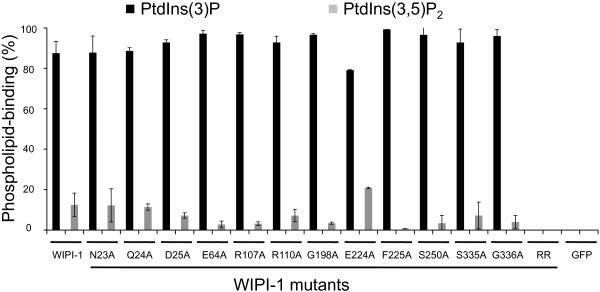
Figure 8
GFP-WIPI-1 mutants capable of PtdIns(3)P can also bind to PtdIns(3,5)P2. Quantification of phospholipid-protein overlay assays using membrane-immobilized PtdIns(3)P and PtdIns(3,5)P2, and native cell extracts from U2OS cells transiently expressing GFP-tagged wild-type or mutant WIPI-1 variants (n = 2). Total intensities of anti-GFP ECL signals at PtdIns(3)P and PtdIns(3,5)P2 positions were set to 100% for each variant and the very approximate percentage of PtdIns(3)P and PtdIns(3,5)P2 binding calculated.
Table 2
Characterization of WIPI-1 mutants
| Mutant | formation | binding | binding | colocalization |
|---|---|---|---|---|
| GFP-G336A | + | + | + | + |
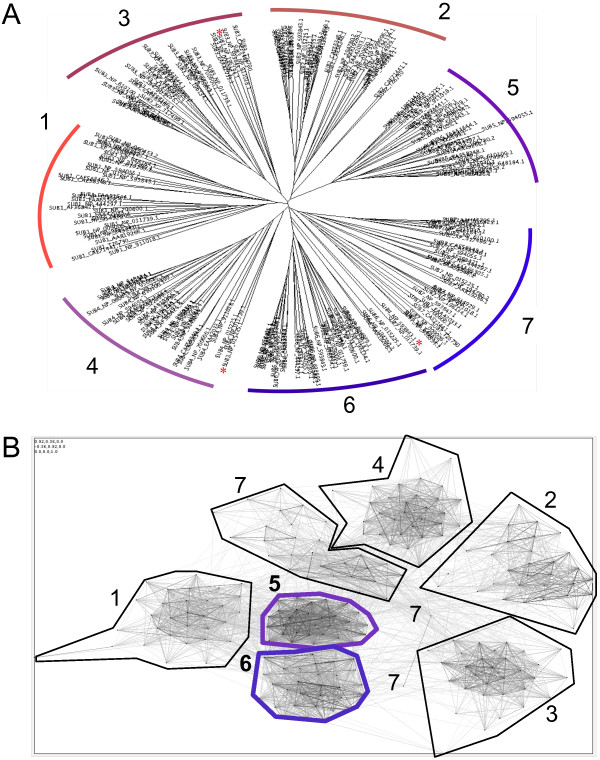
Figure 9
Bioinformatic analysis of WIPI propeller blades. (A) Phylogenetic and (B) cluster analysis of individual (1–7) beta-propeller blade sequences of the WIPI protein family [29].
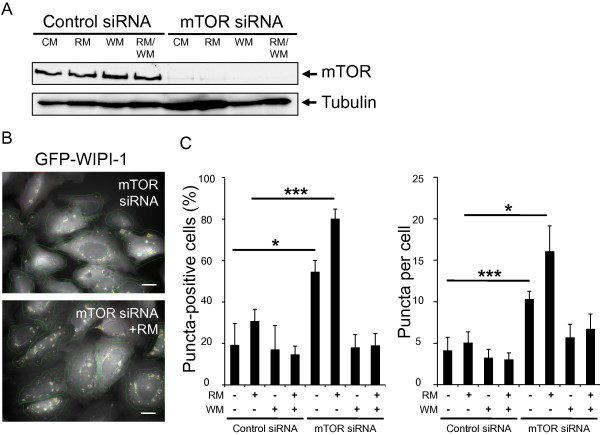
Figure 10
Downregulation of mTOR elevates the number of cells that display GFP-WIPI-1 puncta. (A) Human U2OS cells stably expressing GFP-WIPI-1 were transfected with 20 nM control siRNA or siRNA targeting mTOR. 48 h post-transfection the cells were treated with control medium (CM), rapamycin (RM), wortmannin (WM) or rapamycin plus wortmannin (RM/WM) for 2 h, and a representative western blot analysis from 3 independent experiments confirmed mTOR down regulation. (B) Fluorescence images were automatically acquired and (C) analyzed, and results (600–800 cells per condition, n = 3) expressed as GFP-WIPI-1 puncta-positive cells (left panel) or GFP-WIPI-1 puncta per cell (right panel). P-values: * < 0.05, *** < 0.001. Scale bars 20 μM.
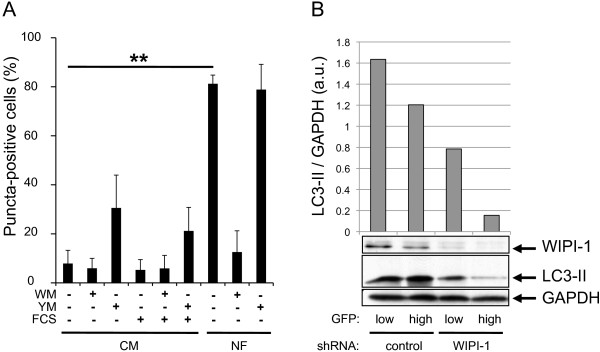
Figure 11
PIKfyve inhibition elevates the number of cells that display WIPI-1 puncta, and WIPI-1 downregulation decreases LC3 lipidation. (A) Human G361 cells were treated for 3 h either with YM201636 (YM) or wortmannin (WM) diluted in complete control medium (CM) with or without serum (FCS) or in serum- and amino acid-free medium (NF), followed by immunostaining of endogenous WIPI-1 using anti-WIPI-1/Alexa 488 antibodies and quantitative fluorescence microscopy. Results are expressed as the number of WIPI-1 puncta-positive cells (150 cells per condition, n = 3). P-value: ** < 0.01. (B) G361 cells were transfected with GFP-labelled control shRNA or shRNA targeting WIPI-1, and GFP-expressing cells were sorted into two groups with regard to high or low GFP intensities. Anti-WIPI-1 and anti-LC3 ECL analysis was conducted and signal intensities normalized over GAPDH. Representative results are shown (n = 2).
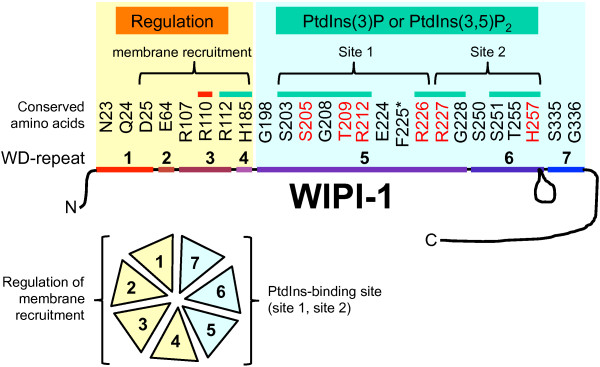
Figure 12
Graphical interpretation of the results achieved from the analysis of generated WIPI-1 mutants. See discussion for details.
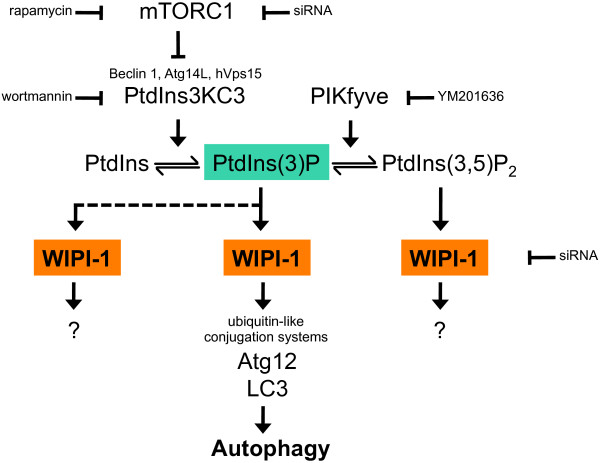
Figure 13
A model for the role of WIPI-1 as a PtdIns(3)P effector at the onset of autophagy in human tumour cells. As indicated, different compounds and siRNA's have been used in this study. See discussion for details.