
Figure 1
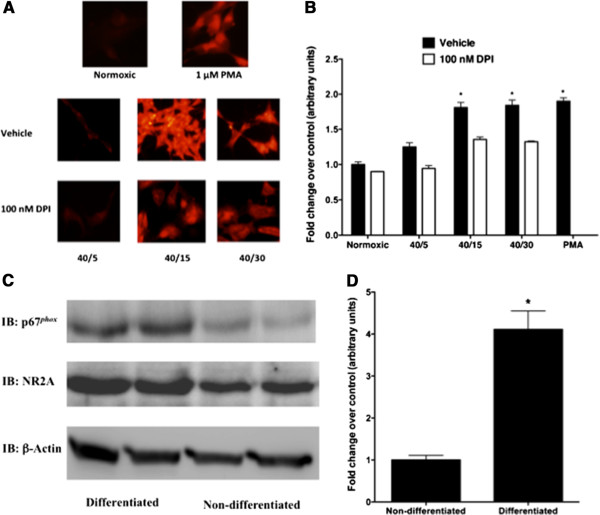
Increased ROS generation during reperfusion of OGD subjected cultures of retinoic acid differentiated SH-SY5Y involves NADPH oxidase activity. Representative fluorescent images from three independent experiments of reactive oxygen species production following OGD (A) with vehicle (1:1000 DMSO) or DPI (100 nM) detected using dihydroethidium (DHE). Spectrophotometric quantification of reactive oxygen species following OGD (B) with vehicle (1:1000 DMSO) or DPI (100 nM) utilizing nitrobluetetrazolium chloride (NBT). (C) Western blot shown is representative of three independent experiments comparing p67phox, NR2A subunit protein expression in non- and differentiated SH-SY5Y cells. (D) Quantification of the relative densitometry of p67phox immunoreactive band in non- and differentiated SH-SY5Y cells. Data represent fold change of OGD/R groups versus normoxic control group (arbitrary units) ± S.E.M from three separate experiments that consisted of at least 6 determinents (askteriks * indicates a p <0.05 from vehicle treated normoxic control; ANOVA with post hoc Bonferroni test). Phorbol 12-myristate 13-acetate (PMA; 1 μM for 15 minutes) was used as a positive control for NADPH oxidase activity in both the DHE and NBT assays. Quantitative data from p67phox protein expression represent fold change of differentiated SH-SY5Y compared to non-differentiated SH-SY5Y cells (arbitrary units) ± S.E.M from three separate experiments (askteriks * indicates a p <0.01 from non-differentiated control; student t-Test).
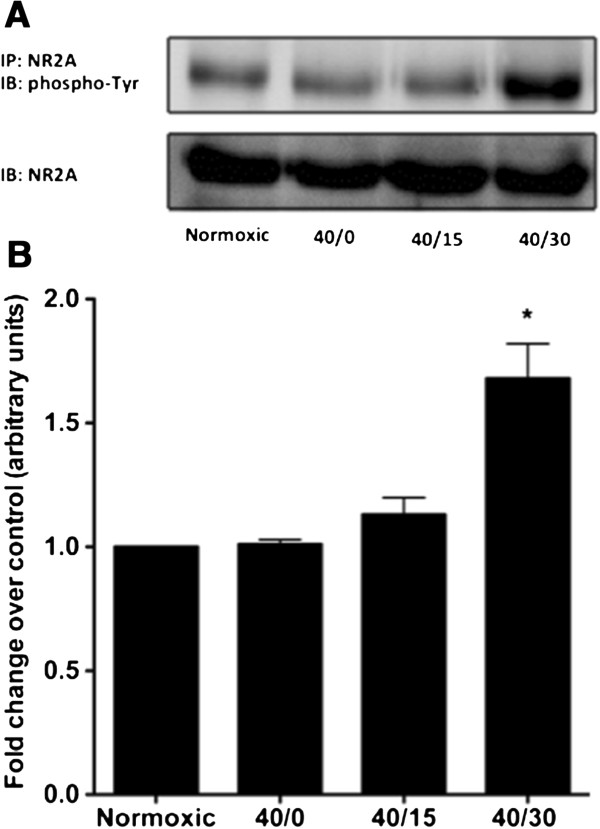
Figure 2
OGD/R promotes the increase in tyrosine phosphorylation of the NMDAR NR2A subunit in differentiated SH-SY5Y cells. Immunoprecipitation and immunoblotting of lysates prepared from differentiated SH-SY5Y cells subjected to OGD/R reveals a significant increase in tyrosine phosphorylation of the NR2A subunit. (A) Western blot shown is representative of three independent experiments. (B) Quantification of the relative densitometry of the phospho-Tyr-NR2A immunoreactive band. Data represent fold change of OGD/R groups compared to normoxic control group (arbitrary units) ± S.E.M from three separate experiments. (askteriks * indicates a p <0.01 from normoxic control; ANOVA with post hoc Bonferroni test).
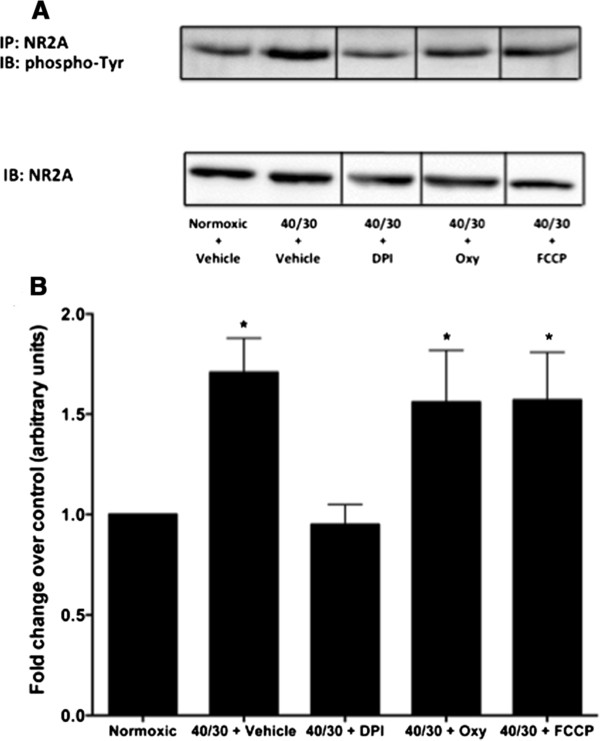
Figure 3
Inhibition of NADPH Oxidase activity blocks the OGD/R-induced increase in tyrosine phosphorylation of the NMDAR NR2A. Inhibition of superoxide generation from xanthine oxidase with oxypurinol (1 μM) and mitochondria with FCCP (0.5 μM) failed to prevent the OGD/R-induced increase in tyrosine phosphorylation of the NMDAR NR2A subunit. However, inhibition of NADPH Oxidase with DPI (100 nM) was found to block the increase in tyrosine phosphorylation of the NR2A subunit. Representative Western blot (A) of three independent experiments of phospho-Tyr-NR2A with vehicle (1:1000 DMSO), DPI, oxypurinol, and FCCP. (B) Quantification of the density of the phospho-Tyr-NR2A band. Data represent fold change of OGD/R treated groups compared to normoxic control (arbitrary units) ± S.E.M from three separate experiments. (askteriks * indicates a p <0.05 from normoxic control; ANOVA with post hoc Bonferroni test).
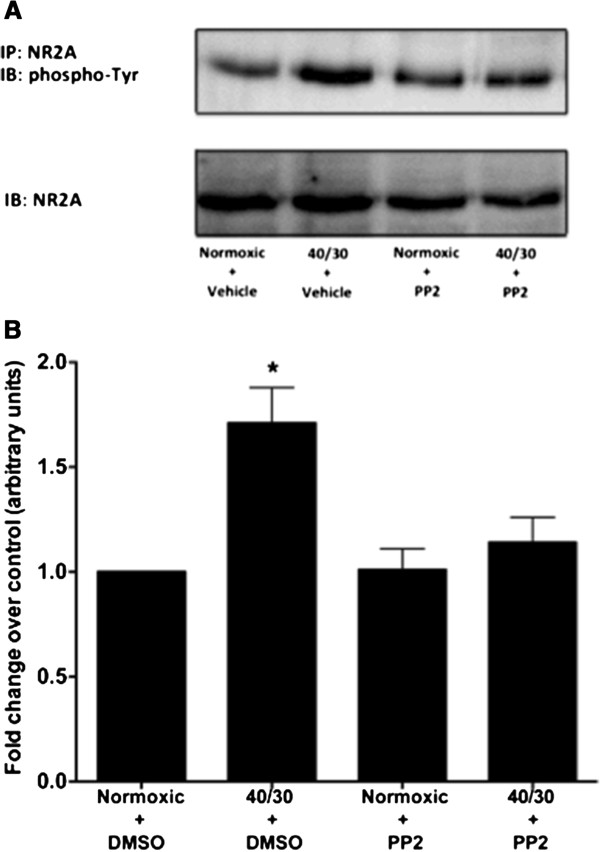
Figure 4
The OGD/R-induced increase in tyrosine phosphorylation of the NMDAR NR2A subunit is attenuated by treatment with the Src Inhibitor PP2. Inhibition of Src Family Kinase activity with the selective inhibitor PP2 rescued the increase in tyrosine phosphorylation of the NMDAR NR2A subunit. (A) Representative Western blot from 3 independent experiments illustrates the dampened tyrosine phosphorylation of NR2A with direct inhibition of Src Family Kinases during reperfusion following OGD with PP2 (1 μM). (B) Quantification of the density of the phospho-Tyr-NR2A band. Data represent fold change of treated groups compared to normoxic vehicle treated group (arbitrary units) ± S.E.M from three separate experiments. (askteriks * indicates a p <0.05 from normoxic control; ANOVA with post hoc Bonferroni test).
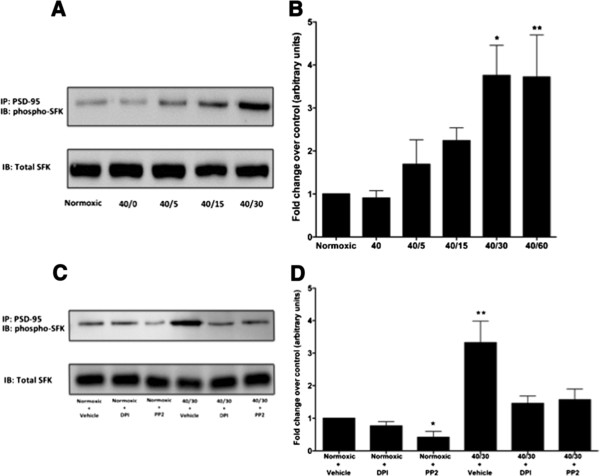
Figure 5
OGD/R promotes the interaction between activated Src Family Kinases and PSD-95, which is reduced with NADPH oxidase inhibition differentiated SH-SY5Y cells. (A) Immunoprecipitation of PSD-95 and immunoblotting with phospho-SFK(Tyr416) shows the increase in the active form (phospho-Tyr416) of SFKs bound to PSD-95 with treatment of OGD/R compared to normoxic controls (Norm). Western blot is representative of three independent experiments. (B) Quantification of the density of the phospho-SFK(Tyr416) band after PSD-95 immunoprecipitation. (C) Representative Western blot from immunopreciptation of PSD-95 from three independent experiments illustrates the dampening of activated SFKs bound to PSD-95 with DPI (100 nM) or PP2 (1 μM) treatment during reperfusion following 40 minutes of OGD. (D) Quantification of the density of the phospho-SFK(Tyr416) band after PSD-95 immunoprecipitation. (B) Data represent fold change of OGD/R groups compared to normoxic control (arbitrary units) ± S.E.M from three separate experiments. (D) Data represents fold change of treated groups compared to vehicle treated normoxic control group (arbitrary units) ± S.E.M from three separate experiments. (askteriks * indicates a p <0.05 from normoxic control; ** indicates a p <0.001; ANOVA with post hoc Bonferroni test).
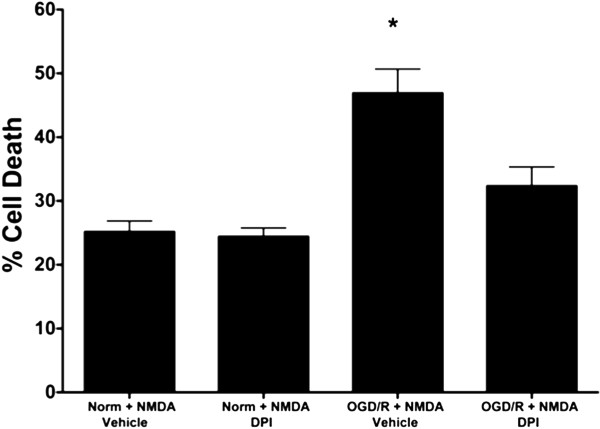
Figure 6
Inhibition of NADPH oxidase activity decreases NMDAR-mediated cell death following exposure to OGD. Differentiated SH-SY5Y cells exhibit an increased susceptibility to cell death after 6 hours of NMDA (5 mM) stimulation following 40 minutes of OGD as assessed by the ethidium homodimer exclusion assay. This enhanced NMDAR-induced cell death is diminished with NADPH oxidase inhibition using DPI (100 nM). Data represent % mean cell death ± S.E.M from three independent experiments consisting of 10–12 determinants (askteriks * indicates a p <0.05 from normoxic control; ANOVA with post hoc Bonferroni test)