
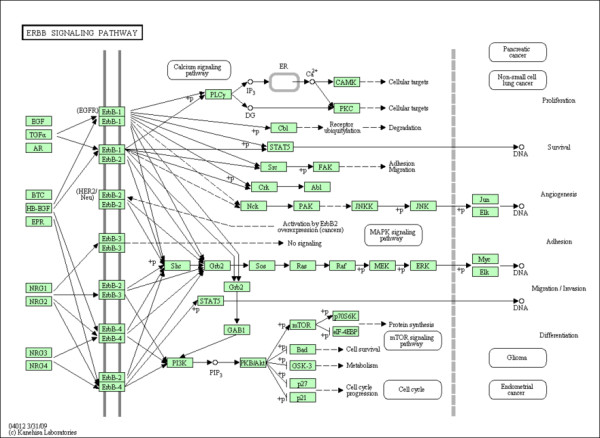
Figure 1
ERBB Pathway. The ERBB Signalling Pathway obtained from the Kyoto Encyclopedia of Genes and Genomes (KEGG).
Table 1
List of antibodies
| ANTIBODY & EGFR correlation p-value | COMPANY | DILUTION | PRETREATMENT | POSITIVE CONTROL |
|---|---|---|---|---|
| Glut-5 (p = 0.006) | Abcam | 1:250 | Citrate | Healthy Small intestine |
Table 2
Pathological variables analysed in this study
| VARIABLES | NUMBER N = 80 | |
|---|---|---|
| >5 | 2 (2,5%) | EGFR p = 0.000 |
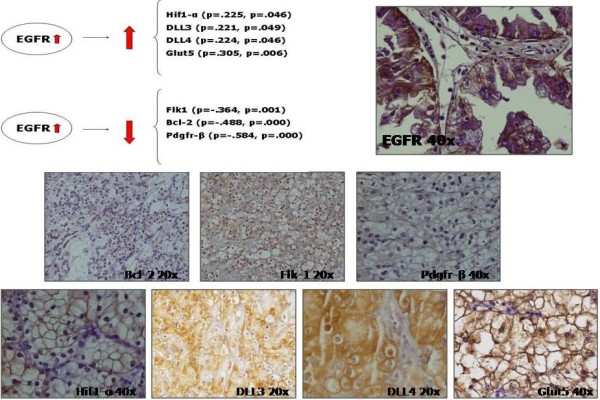
Figure 2
Immunohistochemistry of those EGFRs that are statistically associated proteins. Proteins with statistically significant associations are represented with their statistical values (Pearson correlation and p-value associated) and by immunohistochemistry staining.
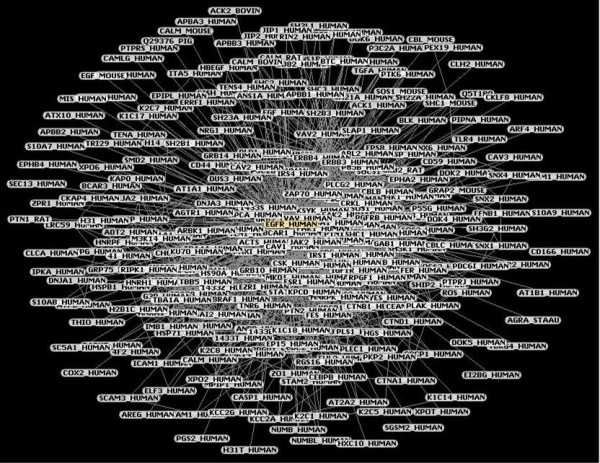
Figure 3
APID Network. Proteins displayed by APID without filters. Proteins are more or less close to EGFR according to their cluster coefficient.
Table 3
EGFR interaction partners obtained by APID
| PROTEIN INTERACTORS | EXPERIMENTS | PROVENANCE | CLUSTER COEFFICIENT |
|---|---|---|---|
| EGFR_HUMAN/PTN6_HUMAN | 3 | HPRD - BioGRID | 0.101232 |
The table shows 21 proteins with greater evidence for EIP (EGFR interacting proteins). The cluster coefficient, a graph parameter that indicates the degree of inter-connection of the group of proteins directly interact to a query protein, in our case, EGFR. A cluster coefficient value close to zero indicates that the protein pair is very close, a value away from zero shows that the protein pair is farthest.
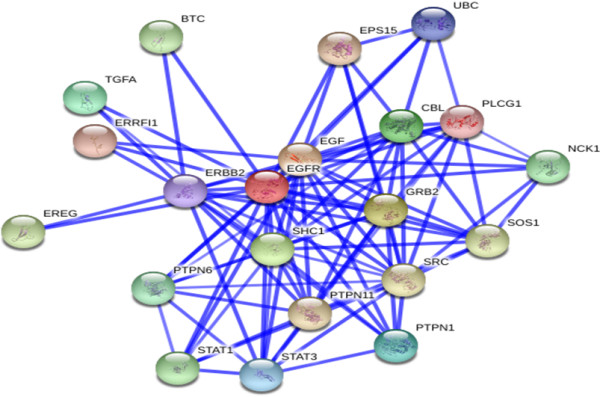
Figure 4
STRING Network. EGFR interacting protein network obtained by STRING. This view is the confidence view. Stronger associations are represented by thicker lines.
Table 4
EGFR scores for the interactors obtained by STRING
| Node 1 Node 2 Combined score | Node 1 Node 2 Combined score | ||||
|---|---|---|---|---|---|
| SHC1 | GRB2 | 0.999 | |||
The table shows all associations in STRING provided with a probabilistic confidence score for EIP and between proteins belongs to this EGFR interactome network. Each node represents a protein which by edges may be interacting with any other. Each score represents a rough estimate of how likely a given association describes a functional linkage between two proteins that is at least as specific as that between an average pair of proteins annotated on the same ‘map’ or ‘pathway’ in KEGG. *Proteins showed by STRING and APID as EIP.