
Figure 1
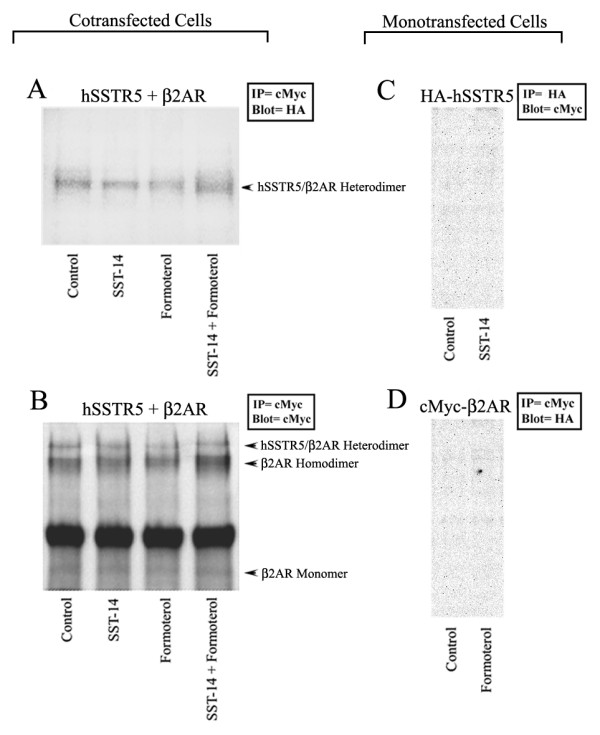
Heterodimerization of hSSTR5 and β2AR in cotransfected HEK-293 cells. Mono-and/or cotransfected cells were treated as indicated for 30 min at 37°C. A single band at the expected size of ~110 kDa an indicative of β2AR/hSSTR5 heterodimers was observed in β2AR immunoprecipitate (arrow panel A). Same membrane was reprobed for β2AR expression using anti-cMyc specific antibody for the specificity of heterodimers (arrow panel B). A band at the expected size of ~50 kDa was also seen for β2AR monomers. For specificity, monotransfected cells expressing SSTR5 or β2AR were used. No bands at the expected molecular weights were observed in either control or treated condition indicating the specificity of heterodimerization (Panels C and D). Data are representative of three independent experiments.
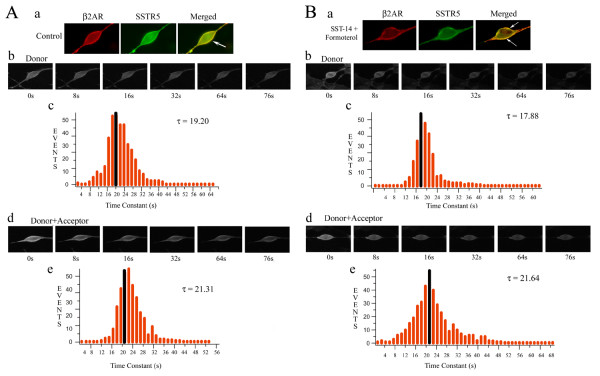
Figure 2
Microscopic Pb-FRET analysis in HEK-293 cells coexpressing cMyc-β2AR/HA-hSSTR5. (A) Representative photomicrographs of HEK-293 cells illustrating cMyc-β2AR (red), HA-hSSTR5 (green) and colocalization in merged image (yellow) (Panel a). Pb-FRET microscopy on HEK-293 cells coexpressing cMyc-β2AR/HA-hSSTR5 was performed as described in Material and Methods. A selection of photomicrographs illustrating photobleaching profile of donor alone and in the presence of acceptor are shown in panels b and d. Histograms shown in panels c and e represents pixel by pixel analysis of time constant of donor and donor + acceptor and the mean time constant shown in black was calculated from a Gaussian distribution curve. Note the increased time constant of donor in presence of acceptor, indicating interactions between cMyc-β2AR/HA-hSSTR5. (B) HEK-293 cells expressing cMyc-β2AR/HA-hSSTR5 were treated with SST (1 μM) and formoterol (1 μM) in combination for 15 min at 37°C. Activation of hSSTR5 with SST and β2AR with formoterol simultaneously displayed increase in the effective FRET efficiency. Representative photomicrographs illustrating bleaching profile of the donor in the absence or presence of acceptor are shown in panels b and d. Histograms shown in panels c and e represent pixel by pixel analysis of time constant of the donor alone or donor + acceptor respectively in cells treated with SST and β2AR specific agonist together for 15 min. Data are representative of three independent experiments performed in duplicate. Approximately 60-70 cells were analyzed per experiment.
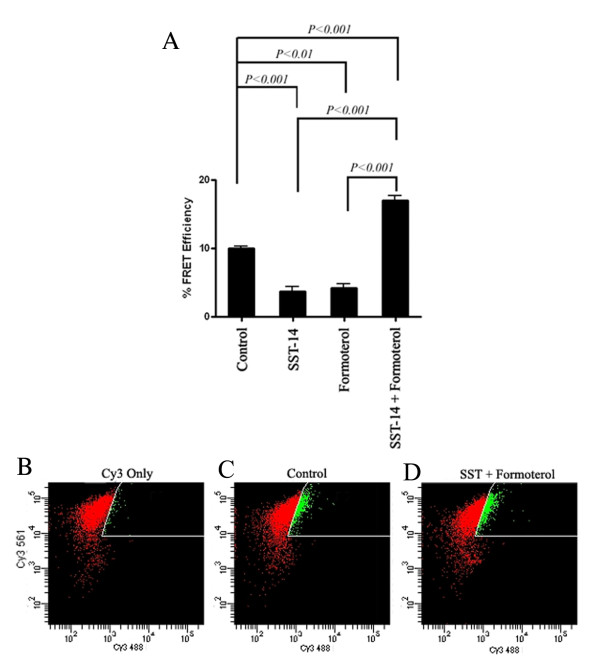
Figure 3
Histogram and photomicrographs illustrating relative FRET efficiencies and FACS analysis in HEK-293 cells cotransfected with hSSTR5 and β2AR. (A) Activation of hSSTR5 with SST or β2AR with formoterol displayed decrease in the FRET efficiency indicating the dissociation of receptor complex upon activation of individual receptors. In contrast, upon combined treatment with SST (1 μM) and formoterol (1 μM), cells displayed enhanced heterodimerization. Mean ± S.E. are representative of three independent experiments performed in duplicate. Data analysis was done by using ANOVA and post hoc Bonferroni's Multiple Comparison test to compare with control and treated conditions. (B-D) Approximately 2 × 10⁶ cells were treated with receptor specific agonist as indicated in materials and methods section. Cells were washed with FACS buffer, fixed in 4% paraformaldehyde and were processed for immunostaining as described. BD LSRII flow cytometer, configured with a 488 nm and 561 nm laser was used for the experiments. Cy3 labeled cells were used as control (Panel B). Note the increased emission in 610/20 channel when cells were excited with 488 nm laser in control (Panel C) as well as upon combined agonist treatment (Panel D).
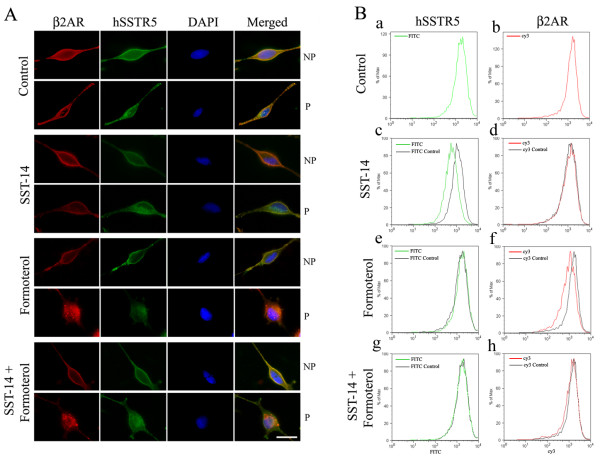
Figure 4
Representative photomicrographs and FACS analysis illustrating receptor and agonist dependent internalization. (A) The cells displayed colocalization at the membrane in non-permeabilized and intracellularly in permeabilized cells with distinct populations of hSSTR5 (green) and β2AR (red). Following treatment with SST, β2AR remain unchanged while hSSTR5 displayed agonist induced internalization. Upon activation with formoterol, β2AR internalized as indicated by the loss of β2AR and colocalization with hSSTR5 at cell surface which is accompanied with the increased intracellular expression. Combined treatment with SST and formoterol displayed colocalization between hSSTR5 and β2AR. In all representative photographs DAPI in blue color indicates nuclear staining. Scale bar = 10 μm. (B) BD LSRII flow cytometer configured with a 488 nm and 561 nm laser was used for the experiments. Cy3- (β2AR expression, panels b, d, f and h) was monitored using the 561 nm laser and a 610/20 emission filter whereas 488 nm laser was used to detect SSTR5 expression (FITC, panels a, c, e and g) and the emission was detected using a 530/30 filter. Cells were processed as described in materials and methods section. Note the left side shifts in the FITC and Cy3 expression (Panels c and f) indicating agonist dependent receptor specific internalization. No significant change in the expression pattern for the receptors was observed upon combined activation with both the ligands (Panels g and h).
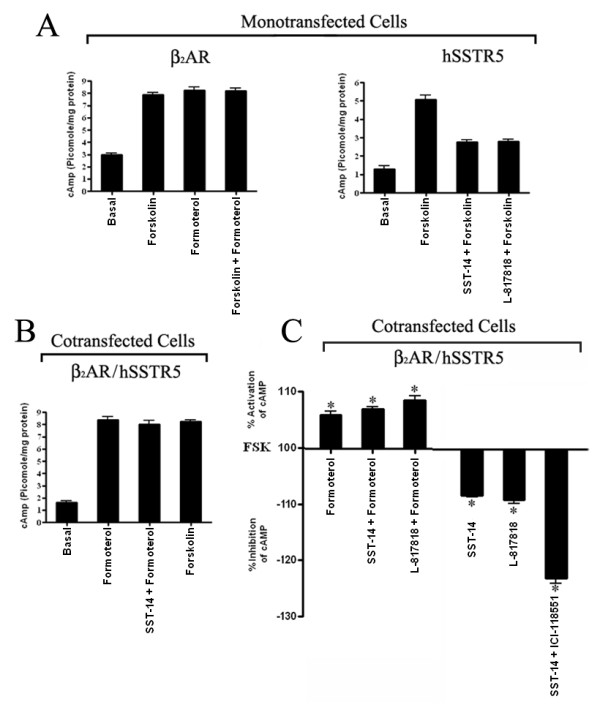
Figure 5
Inactivation of β2AR enhanced hSSTR5 coupling to adenylyl cyclase. Mono-and/or cotransfected HEK-293 cells were processed as described in materials and methods. In basal condition, cAMP level was relatively higher in cells expressing β2AR (Panel A) in comparison to hSSTR5 expressing cells (Panel A). However, both the cell lines displayed increased cAMP in the presence of FSK. As shown, SSTR5 transfected cells exhibited the inhibition of cAMP in presence of SST and SSTR5 specific agonist. In cotransfected cells, basal level of cAMP was comparable to hSSTR5 expressing cells (Panel B). Note the significant decrease in cAMP with SST in presence of β2AR antagonist (Panel C). Mean ± S.E. are representative of three independent experiments performed in triplicate. Data analysis was done by using ANOVA and post hoc Dunnett's to compare against basal level (*, p < 0.01).
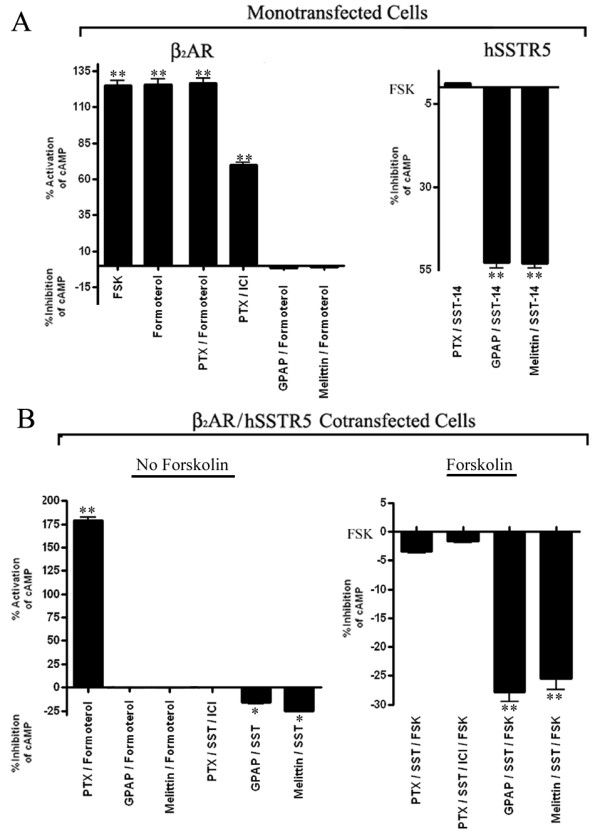
Figure 6
Specificity of G protein coupling. Mono-and cotransfected cells were treated with Gs inhibitors GPAP (5 μM) and Melittin (1 μM) for 2 h; 100 ng/ml PTX (Gi inhibitor) for 16-18 h in DMEM at 37°C and processed for cAMP estimation. GPAP and Melittin resulted in complete loss of formoterol induced cAMP levels, whereas PTX had no significant effect on increased cAMP levels upon formoterol treatment in mono and/or cotransfected cells (Panels A and B). In contrast regulation of cAMP levels by SSTR5 were completely abrogated upon PTX treatment in mono or cotransfected cells. Mean ± S.E. are representative of three independent experiments performed in triplicate. Data analysis was done by using ANOVA and post hoc Dunnett's to compare against basal level (*, p < 0.05; **, p < 0.01).
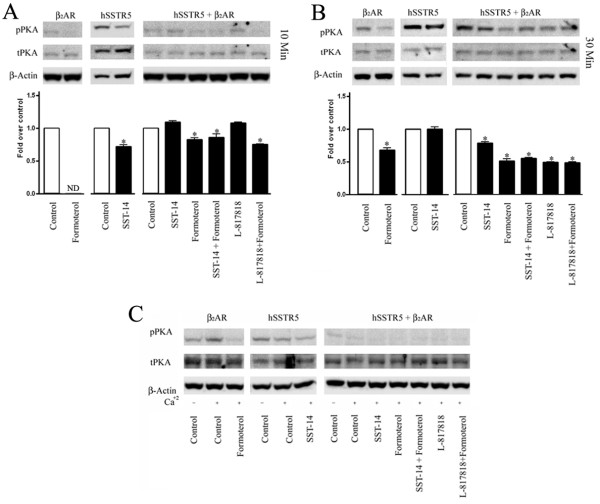
Figure 7
Time and receptor specific changes in PKA phosphorylation. To determine the expression levels of total and phospho-PKA, mono-and cotransfected cells were treated with SST, L-817818 and formoterol alone or in combination for 10 and 30 min at 37°C in the presence of basal (Panels A and B) and higher Ca2+(Panel C). Upon 10 min treatment, cells expressing hSSTR5 displayed inhibition of PKA phosphorylation in the presence of SST whereas no significant phosphorylation of PKA was detected in cells expressing β2AR. In cotransfected cells, β2AR effect was predominant showing inhibition of pPKA with all treatments as indicated (Panel A). Interestingly, PKA phosphorylation was enhanced in SSTR5 monotransfectant in control or in presence of SST for 30 min. With high Ca2+ in culture medium, pPKA expression was higher in the presence of β2AR in comparison to hSSTR5 and was inhibited upon activation of receptors respectively. In cotransfected cells, enhanced PKA phosphorylation seen in monotransfected cells was completely diminished following agonist treatment (Panel C). Densitometric analysis of western blot for pPKA is shown. Data analysis was done by using ANOVA and post hoc Dunnett's to compare against basal level (*, p < 0.01).
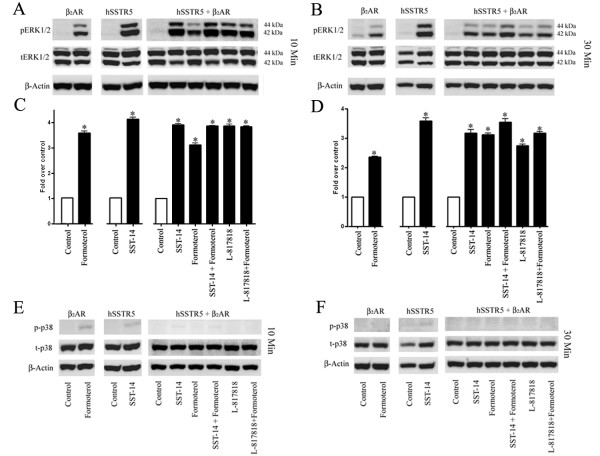
Figure 8
Receptor mediated changes in ERK1/2 and p38 phosphorylation. Mono-and cotransfected HEK-293 cells were treated with SST (1 μM), L-817818 (10 nM) and formoterol (1 μM) alone or in combination at 37°C for 10 and 30 min (Panels A and B). In monotransfected cells, increased expression of pERK1/2 was observed with more significant changes in SSTR5 expressing cells. Similar pattern was also seen following 30 min incubation albeit to the lesser degree. In comparison, cotransfected cells displayed discernable changes at 10 or 30 min treatments (Panels A and B). Densitometric analysis of western blot is shown for ERK1/2 (Panels C and D). Data analysis was done by using ANOVA and post hoc Dunnett's to compare against basal level (*, p < 0.01). As shown in panels E and F, no significant expression of phosphorylated p38 was observed in mono-and/or cotransfected HEK-293 cells with or without treatment. Data are representative of three independent experiments.
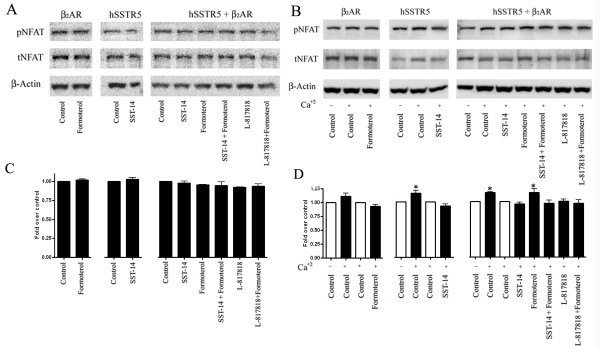
Figure 9
hSSTR5 and β2AR blocks the dephosphorylation of NFAT. Mono-and cotransfected HEK-293 cells were treated with SST (1 μM), L-817818 (10 nM), β2 agonist (1 μM) alone or in combination at 37°C for 30 min and analyzed for total and phosphorylated NFAT in presence of basal and elevated Ca2+. In the presence of basal Ca2+ no significant changes were seen in NFAT phosphorylation in mono-and/or cotransfected cells expressing β2AR or hSSTR5 (Panel A). In the presence of high Ca2+ in culture medium, increased level of phosphorylated NFAT was observed in monotransfected cells when compared with basal Ca2+ control. Cotransfected cells displayed increased phospho-NFAT upon formoterol treatment whereas NFAT phosphorylation remained comparable to control upon activation of SSTR5 alone or in combination with β2AR agonist (Panel B). Densitometric analysis of western blot for pNFAT is shown in panels C and D. Data analysis was done by using ANOVA and post hoc Dunnett's to compare against control (*, p < 0.05).