
Table 1
List of different PCR primers used in the study
| Gene | Specificity | Direction | Primer Sequence |
|---|---|---|---|
| CD 44 | Mouse | Forward | ctccagacaaccaccaggat |
| CD 44 | Mouse | Reverse | tgtggggtctcctcttcatc |
| CD 133 | Mouse | Forward | tcaaagggacccagaaactg |
| CD 133 | Mouse | Reverse | gccttgttcttggtgttggt |
| CD 166 | Mouse | Forward | ctcgttgctggtgtcgtcta |
| CD 166 | Mouse | Reverse | tccaatccgctcctctctta |
| ALDH 1a | Mouse | Forward | gggctgacaagattcatggt |
| ALDH 1a | Mouse | Reverse | ggaaaattccaggggatgat |
| Actin | Mouse | Forward | agatctggcaccacaccttc |
| Actin | Mouse | Reverse | ggggtgttgaaggtctcaaa |
| CD 44 | Human | Forward | aaggtggagcaaacacaacc |
| CD 44 | Human | Reverse | actgcaatgcaaactgcaag |
| CD 133 | Human | Forward | accgactgagacccaacatc |
| CD 133 | Human | Reverse | ggtgctgttcatgttctcca |
| CD 166 | Human | Forward | tagcaggaatgcaactgtgg |
| CD 166 | Human | Reverse | cgcagacatagtttccagca |
| ALDH 1a | Human | Forward | gttgtcaaaccagcagagca |
| ALDH 1a | Human | Reverse | ctgtaggcccataaccagga |
| Actin | Human | Forward | cccagcacaatgaagatcaa |
| Actin | Human | Reverse | acatctgctggaaggtggac |
ALDH1a represents ALDH1.
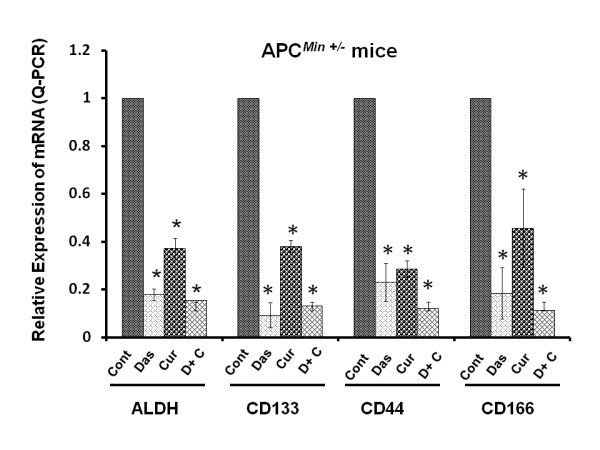
Figure 1
Relative expression of various cancer stem cell markers in tumor remnants from APCMin +/- mice treated with dasatinib and/or curcumin as determined by RT-PCR. Tissue was procured from our previous study where Female Min mice (5 weeks; female C57BL/6J- APCMin +/- ) were treated with dasatinib (10 mg/kg body weight) and/or curcumin (250 mg/kg body weight). The treatment was given for five consecutive days per week for 4 weeks. At the end of respective treatments, the mice were euthanized and tumor remnants were obtained as described previously [30]. RNA isolated from the tissue was analyzed for expression of different CSCs specific markers.
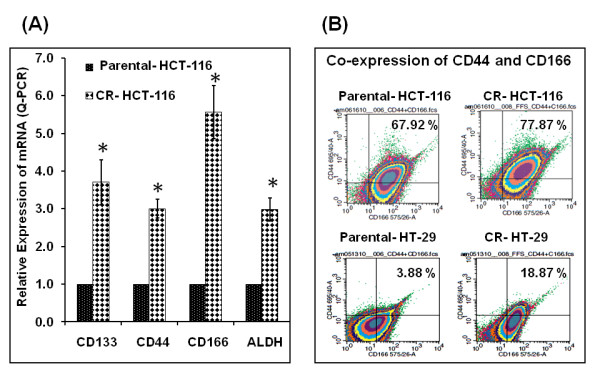
Figure 2
(A) Relative expression of various cancer stem cell markers in chemo-resistant (CR) HCT-116 cells as determined by RT-PCR; (B) Sorting of anti-CD44 and anti-CD166 antibodies-tagged untreated (control) and CR HCT-116 and CR- HT-29 cells by flow cytometry. Parental cells were maintained in DMEM, supplemented with 5% FBS and 1% antibiotic and antimycotic. The CR cells were continuously exposed to 50 μM 5-FU and 1.25 μM oxaliplatin.
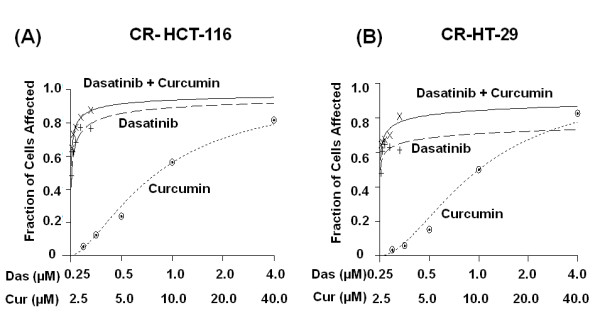
Figure 3
Effects of dasatinib and/or curcumin on the growth of (A) CR HCT-116 and (B) CR HT-29 colon cancer cells: Growth as determined by MTT assay after 72-h incubation with incremental doses of dasatinib and/or curcumin. All CR cells were exposed to 50 μM 5-FU and 1.25 μM oxaliplatin with or without (control) dasatinib and/or curcumin. This treatment strategy was utilized in all subsequent experiments. Dose response curves were generated for the drugs using Calcusyn 2.0 (Biosoft). All assays were performed in quadreplicates. A fractional effect (Fa) of 1 represents complete toxicity for the drug(s), whereas Fa value of "0" indicates no effect.
Table 2
Synergy analysis for dasatinib and curcumin combination therapy in chemo-resistant colon cancer cells
| COMBINATION THERAPY | COMBINATION INDEX (CI) | ||
|---|---|---|---|
| Dasatinib (μM) | Curcumin (μM) | CR HCT-116 (p53 wt) | CR HT-29 (p53 mutant) |
| 0.25 | 2.5 | 0.42 | 0.16 |
| 0.5 | 5.0 | 0.43 | 0.28 |
| 1.0 | 10.0 | 0.61 | 0.46 |
| 2.0 | 20.0 | 0.72 | 0.76 |
| 4.0 | 40.0 | 0.95 | 0.89 |
Combination indices < 1.0 are increasingly supra-additive, whereas values > 1.0 are increasingly less than additive.
Table 3
Dose Reduction Index (DRI) analysis for dasatinb in chemo-resistant HCT-116 colon cancer cells
| Drug Reduction Index for Dasatinib | |
|---|---|
| Fa |
DRI
CR HCT-116 (p53 wt) |
| 0.25 | 13.37 |
| 0.50 | 18.19 |
| 0.75 | 24.76 |
DRI represents the order of magnitude (fold) of dose reduction obtained for specific Fa in combination settings as compared to each drug alone.
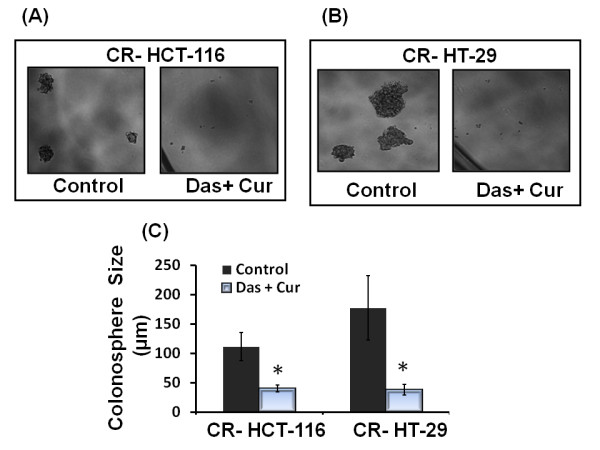
Figure 4
Representative photograph showing formation of colonospheres by (A) CR HCT-116 and (B) CR HT-29 cells after incubating with dasatinib(1 μM), and curcumin (10 μM). Average size of colonospheres formed by CR HCT-116 and CR HT-29 in response to the combination therapy (C). The controls were incubated with FOLFOX (50 μM 5-FU + 1.25 μM oxaliplatin) containing medium only. *P < 0.01, compared with the corresponding control.
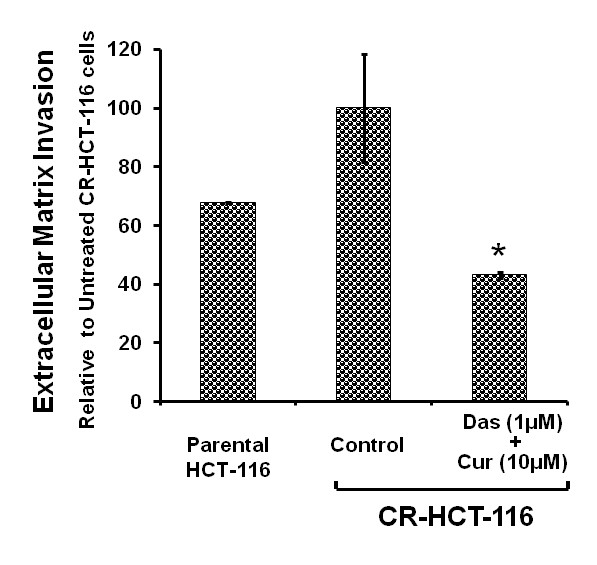
Figure 5
Effects of dasatinib and curcumin on extra cellular invasion by CR HCT-116 colon cancer cells. CR HCT-116 cells were allowed to invade in the presence or absence of dasatinib(1 μM), and curcumin (10 μM) for 3 days. The invading cells were stained with crystal violet and solubilized for quantitation. The controls represent the parental cells or CR HCT-116 cells that were incubated with FOLFOX (50 μM 5-FU + 1.25 μM oxaliplatin) containing medium only. *P < 0.01, compared with the corresponding control.
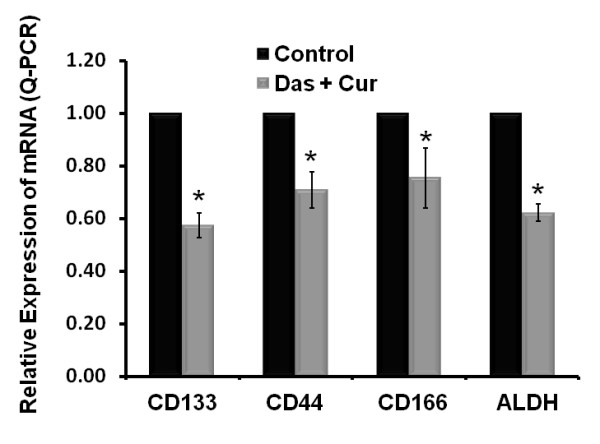
Figure 6
Relative expression of various colon cancer stem cell markers in chemo-resistant HCT-116 cells in response to the exposure to dasatinib (1 μM), and curcumin (10 μM) for 3 days. The controls represent the CR HCT-116 cells that were incubated with FOLFOX (50 μM 5-FU + 1.25 μM oxaliplatin) containing medium only. *P < 0.01, compared with the corresponding control.