
Figure 1
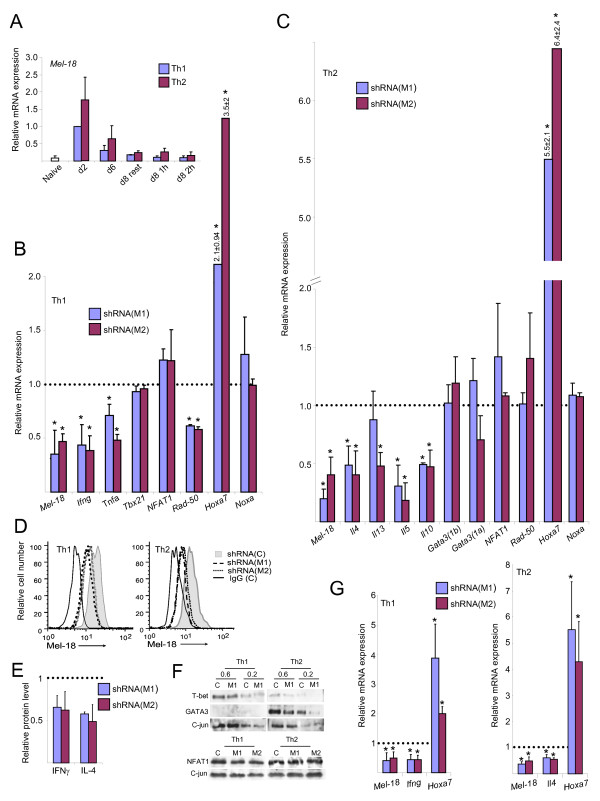
Knockdown of Mel-18 downregulates the expression of cytokine genes in primary Th1 and Th2 cells. (A) Quantitative RT-PCR for Mel-18 in naïve cells, differentiating Th1 and Th2 cells (days 2, 6, and 8), and 8th-day differentiated Th1 and Th2 cells after 1 or 2 hours of re-stimulation with P+I. The expression level in Th1 cells on day 2 was set as 1. (B,C) Quantitative RT-PCR for the indicated mRNAs following Mel-18 knockdown by Mel-18-directed shRNAs M1, M2 or control non-silencing scrambled shRNA during Th1 (B) and Th2 (C) differentiation. The results are presented relative to the control, defined as 1. The cells were transduced on day 0, and after 3 days of puromycin selection, on the 5th day, they were re-stimulated with P+I for 2 hours. Differences between knockdown and control with p values ≤ 0.05 (Student's t test) are indicated with an asterisk. (D) Intracellular staining of Mel-18 in the indicated transduced Th1 and Th2 cells. (E) ELISA for the levels of IFNγ and IL-4 in the supernatants of 4-hour-stimulated (αCD3 and αCD28) Th1 and Th2 cells, respectively, after Mel-18 knockdown. The results with control shRNA were set as 1. (F) Western blot assessing the indicated proteins on the 5th day of Th1 and Th2 cell transduced with control shRNA [C] or shRNA directed to Mel-18 [M1]. c-jun is used as loading control. (G) Quantitative RT-PCR for the indicated mRNAs after Mel-18 knockdown in Th1 (left) and Th2 (right) cells as described in Figure 1B, except the cells were re-stimulated with αCD3 and αCD28 antibodies. Differences between knockdown and control with p values ≤ 0.05 are indicated with an asterisk. The results in Figure 1 are the mean of two to five independent experiments +S.D., except in panels 1D and 1F, which are representative experiments.
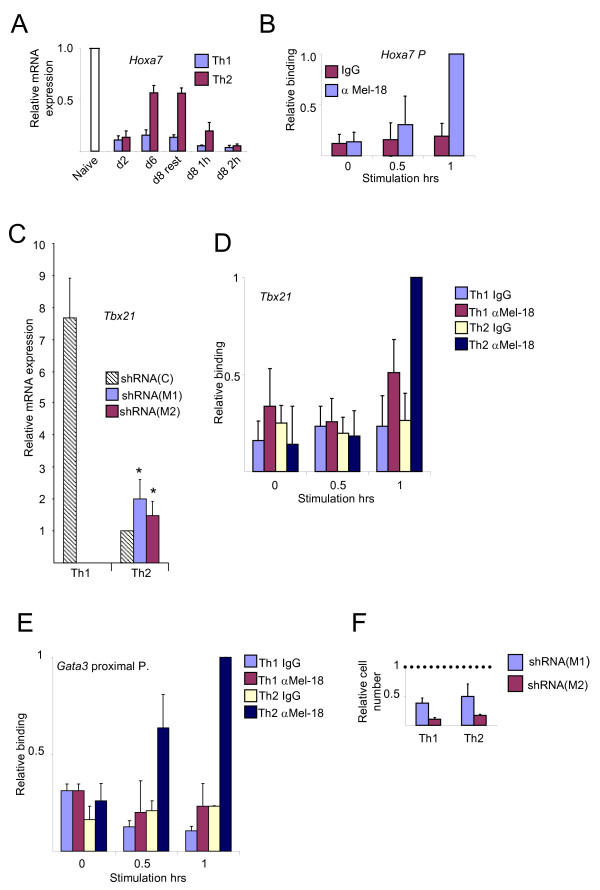
Figure 2
Bi-functional role of Mel-18. (A) Quantitative RT-PCR for Hoxa7 as described in Figure 1A. (B) ChIP experiment assessing the relative binding of Mel-18 at the Hoxa7 promoter region in resting and re-stimulated (P+I), 6-day-differentiated Th2 cells. The binding activity in 1-hr re-stimulated cells was set as 1. (C) Quantitative RT-PCR for Tbx21 mRNAs following the knockdown of Mel-18 as described in Figure 1B. The expression level of the control in Th2 cells was set as 1. (D) ChIP experiment assessing the binding of Mel-18 at the Tbx21 promoter in resting and re-stimulated (P+I), 6-day-differentiated Th1 and Th2 cells. The binding activity in 1-hr re-stimulated Th2 cells was set as 1. (E) ChIP experiment assessing the binding of Mel-18 at the Gata3 proximal promoter in resting and re-stimulated (P+I), 6-day-differentiated, Th1 and Th2 cells. The binding activity in 1-hr re-stimulated Th2 cells was set as 1. Similar results were obtained with the distal promoter. (F) The number of live cells on the 5th day after Mel-18 knockdown relative to the control that was set as 1. The results in Figure 2 are the mean of two or three independent experiments +S.D.
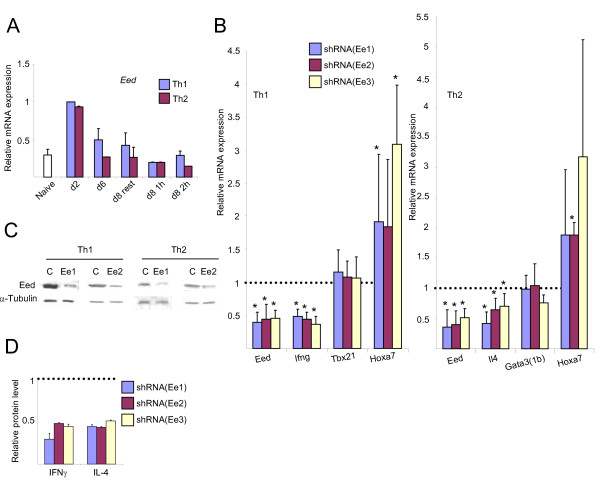
Figure 3
Knockdown of Eed downregulates the expression of cytokine genes in primary Th1 and Th2 cells. (A) Quantitative RT-PCR for Eed, as described in Figure 1A. (B) Quantitative RT-PCR for the indicated mRNAs after Eed knockdown in Th1 (left) and Th2 (right) cells with Eed-directed shRNAs Ee1, Ee2 and Ee3 or non-silencing scrambled shRNA as a control. The cells were transduced on day 0 and re-stimulated on the 5th day (αCD3 and αCD28) for 2 hours. The results are presented relative to the control, defined as 1. Differences between knockdown and control with p values ≤ 0.05 are indicated with an asterisk. C. Western blot for Eed for the indicated transduced Th1 and Th2 cells following knockdown of Eed. D. ELISA for the levels of IFNγ and IL-4 in the supernatants of 2-hour-stimulated (αCD3 and αCD28) Th1 and Th2 cells, respectively, after Eed knockdown. The results with control shRNA were set as 1. The results in Figure 3 are the mean of three to five independent experiments +S.D., except in panel 3C, which is a representative experiment.
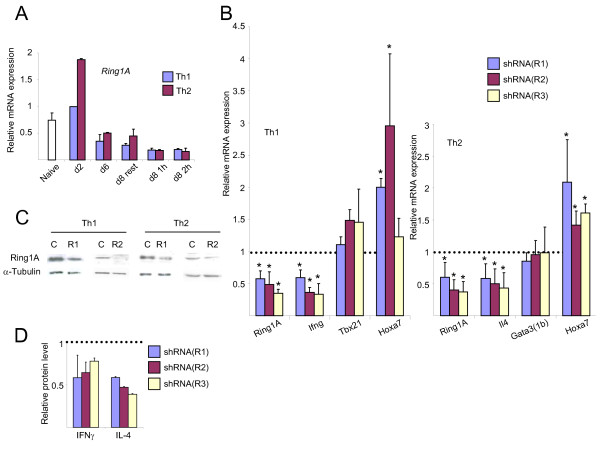
Figure 4
Knockdown of Ring1A downregulates the expression of cytokine genes in primary Th1 and Th2 cells. The experiments as described in Figure 3 were performed for Ring1A.
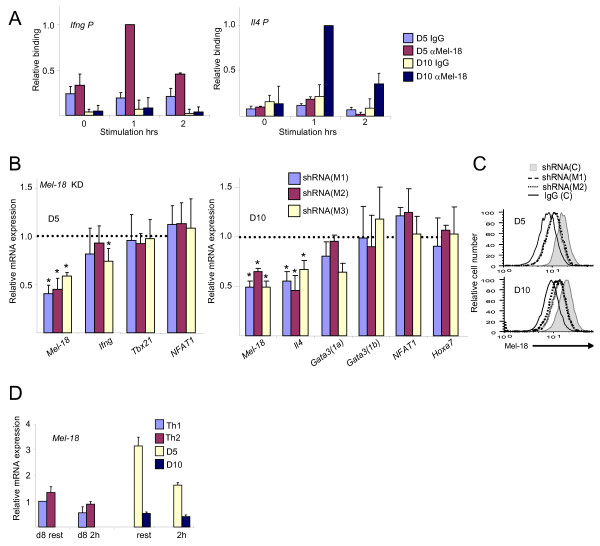
Figure 5
Mel-18 is a positive regulator of cytokine genes in D5 and D10 cells. (A) ChIP experiment assessing the binding of Mel-18 at the Ifng (left) and Il4 (right) promoters in D5 and D10 cells. The cells were stimulated with antigen-presenting cells (APCs) with the appropriate peptides, cultured for 2-3 weeks, and then left unstimulated or were re-stimulated (P+I) for the indicated time points. In the panel of the Ifng promoter the result of 1 hr stimulation of D5 cells was set as 1, and in the Il4 promoter panel the result of 1 hr stimulation in D10 was set as 1. (B) Quantitative RT-PCR for the indicated mRNAs following Mel-18 knockdown in D5 (left) and D10 (right) cells. The cells were re-stimulated with APCs with the appropriate peptides, transduced with lentiviral shRNAs, cultured in the presence of puromycin for 2-3 weeks, and then re-stimulated with anti-CD3 and anti-CD28 antibodies for 2 hours. The results are presented relative to the control, defined as 1. Differences between knockdown and control with p values ≤ 0.05 are indicated with an asterisk (C) Intracellular staining of Mel-18 in the indicated transduced D5 and D10 cells. (D) Quantitative RT-PCR for Mel-18 in resting and 2-hour-restimulated cells as indicated. The expression level in resting Th1 cells was set as 1. The results in Figure 5 are the mean of three to six independent experiments +S.D., except panel 5C, which is a representative experiment.
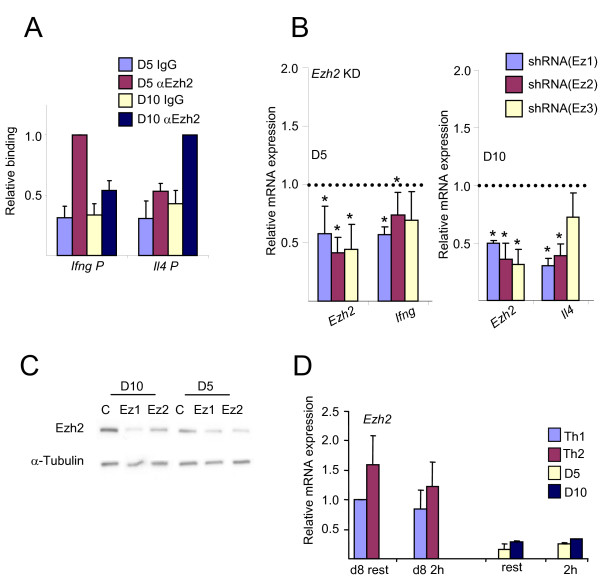
Figure 6
Ezh2 is a positive regulator of cytokine genes in D5 and D10 cells. (A) ChIP experiment assessing the binding of Ezh2 at the Ifng and Il4 promoters in stimulated D5 and D10 cells. In D5 cells the relative binding at the Ifng promoter was set as 1, and in D10 cells the relative binding to the Il4 promoter was set as 1. (B) Quantitative RT-PCR for the indicated mRNAs following Ezh2 knockdown in D5 (left) and D10 (right) cells. The cells were re-stimulated (αCD3 and αCD28) for 2 hours. The results are presented relative to the control, defined as 1. Differences between knockdown and control with p values ≤ 0.05 are indicated with an asterisk. (C) Western blot for Ezh2 for the indicated transduced D5 and D10 cells following knockdown of Ezh2. (D) Quantitative RT-PCR for Ezh2 in resting and 2-hour-restimulated cells as indicated. The expression level in resting Th1 cells was set as 1. The results in Figure 6 are the mean of three to six independent experiments +S.D., except panels 6C, which is a representative experiment.
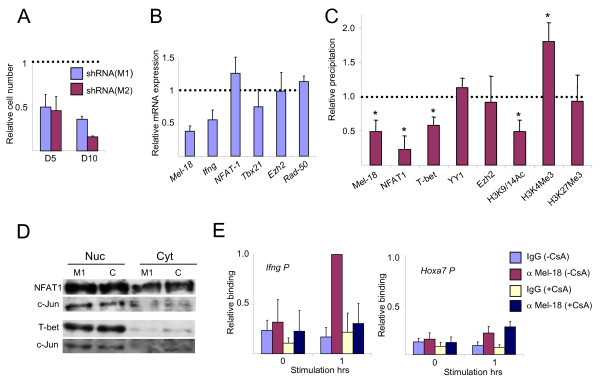
Figure 7
Mel-18 is required for the recruitment of T-bet and NFAT to the Ifng promoter in D5 cells. (A) The numbers of live cells following Mel-18 knockdown in D5 and D10 cells relative to the control that was set as 1. (B) Quantitative RT-PCR for the indicated mRNAs in 2-hour-restimulated (P+I) D5 cells following Mel-18 knockdown (3-4 weeks of selection) with shRNA M1 and control shRNA. The results are presented relative to the control that was set as 1. (C) ChIP experiment assessing selected modifications and the binding activity of the indicated factors at the Ifng promoter following Mel-18 knockdown as described in Figure 7B. Differences between knockdown and control with p values ≤ 0.05 are indicated with an asterisk. (D) Western blot assessing T-bet and NFAT1 under the conditions described in Figure 7B. c-jun is used as loading control. Cyt; cytosolic, Nuc; nuclear. (E) ChIP experiment assessing the binding of Mel-18 at the Ifng and Hoxa7 promoters in resting and 1-hour-restimulated D5 cells in the presence or absence of CsA. The binding activity at the Ifng promoter following stimulation in the absence of CsA was set as 1. The results in Figure 7 are the mean of three to five independent experiments +S.D., except panel 7D, which is a representative experiment.