
Table 1
Sources of the commercially available phosphoHSP27 specific antibodies used in this study.
| antibody/source | Millipore | Epitomics | CST* | Upstate |
|---|---|---|---|---|
| phosphoSer-15 | + | + | ||
| phosphoSer-78 | + | + | + | |
| phosphoSer-82 | + | + | + |
*Cellular Signaling Technology
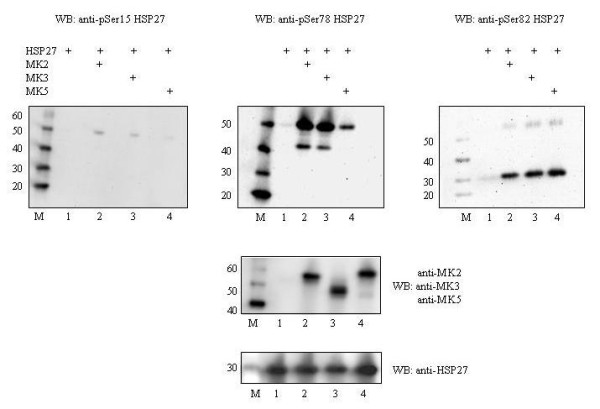
Figure 1
Detection of phosphoHSP27 by different phosphospecific antibodies after in vitro phosphorylation with MK2, MK3, or MK5. In vitro kinase assay was performed with either 200 ng recombinant GST-HSP27 (~52 kD; left and middle top panels) or histidine-tagged HSP27 (~28 kD; right top panel) in the presence of purified MK2 (60 μg), MK3 (96 μg), or MK5 (90 μg). Phosphorylation at the relevant phosphoacceptor sites Ser-15, Ser-78, and Ser-82 was monitored by western blot using phosphospecific antibodies against phosphoSer-15 (Upstate), phosphoSer-78 (Cell Signaling Technology), and phosphoSer-82 (Milipore). Top panel, left: phosphorylation at Ser-15; top panel middle: phosphorylation at Ser-78; top panel right: phosphorylation at Ser-82. The presence of MK2, MK3, or MK5 was verified by western blot with anti-MK2, anti-MK3, and anti-MK5 antibodies (middle panel). Equal loading of HSP27 was monitored with anti-HSP27 antibodies (bottom panel). M = protein molecular mass marker (in kD).
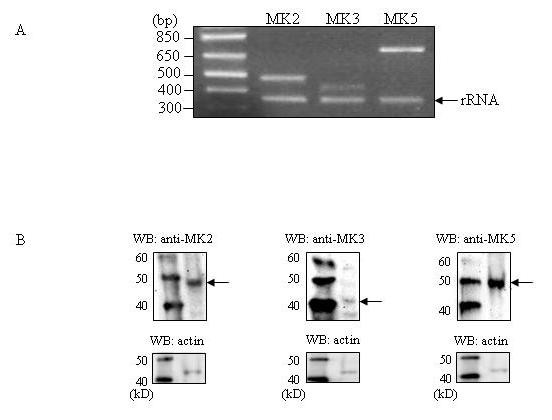
Figure 2
Expression levels of MK2, MK3, and MK5 in HEK293 cells. (A) Total RNA was reverse transcribed and MK2, MK3, MK5, and rRNA transcripts were amplified by PCR with specific primers. PCR products were visualized by electrophoresis on an agarose gel in the presence of ethidium bromide. A size marker (in base-pairs; bp) was run on the gel to confirm the correct size of the PCR products. rRNA was used as an internal control [33]. (B) The relative amounts of MK2, MK3, and MK5 in HEK293 cells was determined by western blotting. The band corresponding to the molecular mass of MK2, MK3, and MK5 is indicated by an arrow. To assure equal sample loading, the blot was stripped and re-probed with antibodies against actin. The molecular mass (in kD) of a protein marker is shown.
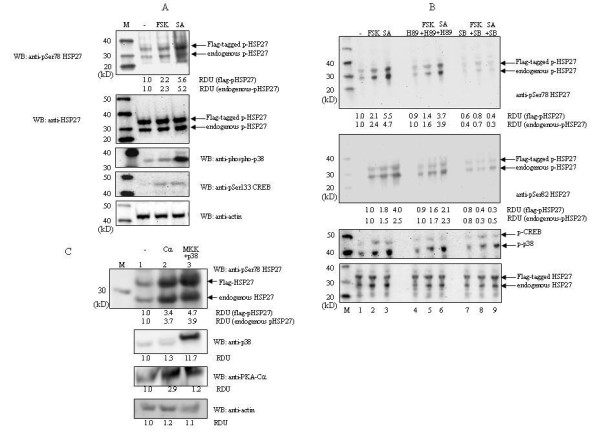
Figure 3
Activation of the p38MAPK and PKA pathways can provoke phosphorylation of HSP27. (A) HEK293 cells were transfected with an expression vector for Flag-tagged HSP27 and 24 h after transfection left untreated (-) or exposed to forskolin (FSK; 10 μM for 30 min) or sodium arsenite (SA; 250 μM for 30 min). The phosphorylation levels of phosphoSer-78 HSP27 were monitored. Equal loading was verified by examining the total levels of HSP27 and actin in the samples. To ensure that the stimuli were active, phosphorylation of the PKA substrate CREB at Ser-133 and of the p38MAPK was tested. The double bands observed in the blots with (phospho)HSP27 antibodies represent Flag-tagged HSP27 (upper band) and endogenous HSP27 (lower band). (B) HEK293 cells transfected with the Flag-HSP27 expression plasmid and cells were either left untreated, exposed for 30 min with the PKA inhibitor H89 (10 μM) or the p38MAPK inhibitor SB203580 (10 μM) before forskolin or arsenite was added, or were treated with forskolin or arsenite as described in (A). Lane 1: untreated Flag-Hsp27 transfected HEK293 cells; lane 2: stimulated with forskolin; lane 3: stimulated with sodium arsenite; lane 4: exposed to H89; lane 5: pretreated with H89 and then stimulated with forskolin; lane 6: pretreated with H89 and then stimulated with arsenite; lane 7: exposed to SB203580; lane 8: pretreated with SB203580 and then stimulated with forskolin; lane 9: pretreated with SB203590 and then stimulated with arsenite. PhosphoSer78 HSP27 and phosphoSer82 HSP27 were examined. Membranes were stripped and the lysates were assayed for phosphorylation of CREB and p38MAPK. Lower panel shows the expression levels of endogenous and Flag-tagged HSP27. (C) Cells were cotransfected with expression vectors for Flag-tagged HSP27 and the catalytic subunit of PKA (Cα) or p38MAPK and a constitutive active mutant of its upstream activator MKK6 (MKK). PhosphoSer78 HSP27 protein levels were examined by western blotting. M is the protein molecular mass (in kD) marker. RDU (relative densitometry units) indicates the increase in HSP27 phosphorylation and was calculated as follows. The densitometry values obtained for the signals of phosphorylated HSP27 were determined and corrected for the values obtained for actin (in A) or for total HSP27 (in B). This ratio obtained for untreated cells was arbitrarily set as 1.0 and the ratios obtained for stimulated cells were related to this. Values were calculated separately for flag-tagged HSP27 and endogenous HSP27.
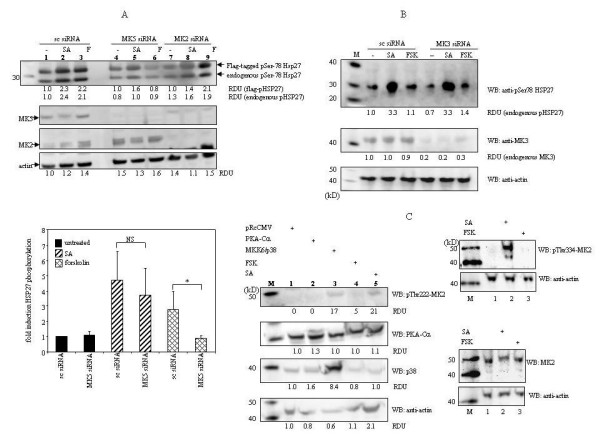
Figure 4
MK5 is implicated in PKA-induced HSP27 phosphorylation, while MK2 mediated p38MAPK-triggered HSP27 phosphorylation. (A) Top panel: cells were transfected with scrambled siRNA (sc siRNA; lanes 2-4) or siRNA directed against MK5 (MK5 siRNA, lanes 4-6) or MK2 (lanes 7-9). After transfection, cells were left untreated (-, lanes 1, 4 and 7) or treated for 30 min with 250 μM sodium arsenite (SA, lanes 2, 5 and 8) or 10 μM forskolin (FSK, lanes 3, 6 and 9) and the cells were harvest. Protein levels were examined by western blot. Equal loading was verified by examining the expression levels of actin. M = protein molecular mass marker (in kD). The intensity of the bands was determined by densitometry and the value obtained for phosphorylated Flag-tagged-HSP27 (respectively phosphorylated endogenous HSP27) was arbitrary set as 1.0 and the other values were related to this. A representative experiment is shown and similar results were obtained in two independent experiments. Bottom panel: relative fold induction of HSP27 phosphorylation at Ser-78 in untreated and treated cells that had been transfected with scrambled (sc) or MK5-targeting siRNA. The phosphoHSP27 levels in untreated, scrambled siRNA transfected cells were arbitrary set as 1.0. The bars represent the average (+standard deviation) of three independent results. A significant difference (*p < 0.05; student's t-test) was observed for forskolin-induced HSP27 phosphorylation in scrambled siRNA and MK5-targeting siRNA transfected cells. (B) As in (A), but cells were transfected with siRNA against MK3. RDU values were calculated as in (A). (C) Overexpression of active MKK6 plus p38MAPK (lane 3) or exposure of cells to 250 μM sodium arsenite (SA) for 30 min (lane 5) causes phosphorylation of MK2, while the catalytic subunit of PKA (Cα) or forskolin (FSK) failed to provoke HSP27 phosphorylation. Control cells were transfected with the empty expression vector pRcCMV (lane 1). The molecular mass (in kD) of the protein marker is shown (lane M). The densitometry values obtained for the signals of phosphorylated HSP27 or MK5 (respectively MK2 or MK3) were determined and corrected for the values obtained for actin. RDU values in control cells (lanes 1) were arbitrarily set as 1.0 and the other values were related to this.
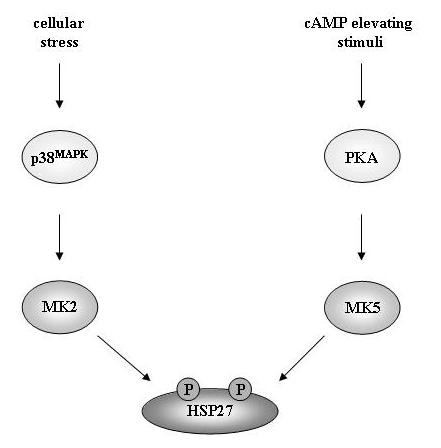
Figure 5
Different stimuli that trigger HSP27 phosphorylation engage distinct pathways with specific MKs. MK2 mediates phosphorylation of HSP27 in cells with an activated p38MAPK pathway, while MK5 functions as an HSP27 kinase induced by the cAMP/PKA pathway.