
Figure 1
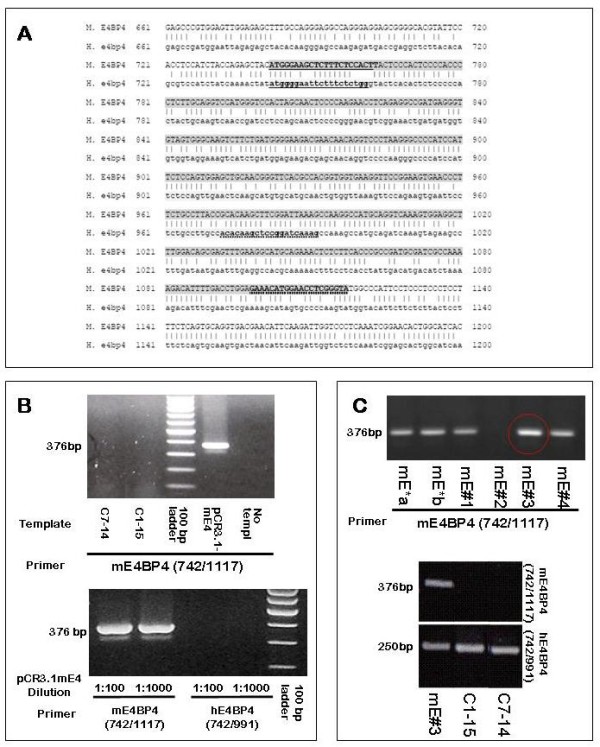
Primer Specificity for human and mouse E4BP4 and generation of M.E4BP4 expressing CEM C1-15mE#3 cells: Panel A: Sequence alignment of partial mouse and human E4BP4 coding sequences within exon 2 (numbering is based on +1 for the first nucleotide of the coding region). Upper rows indicate mouse E4BP4 sequence in upper case and lower rows show human E4BP4 sequence in lower case. Forward and reverse primers are underlined with solid and dotted lines respectively (mE4BP4 = 742/1117 and hE4BP4 = 742/991). Panel B: The top gel shows specificity of mE4BP4 primers for M. E4BP4 template. PCR using DNA extracted from human CEM clones failed to amplify any product. The positive control template of plasmid pCR3.1-mE4 amplified a 376bp fragment. For the lower gel, 1:100 and 1:1000 dilutions of the plasmid DNA pCR 3.1-mE4BP4 were subjected to qRT-PCR analysis using primers mE4BP4 (742/1117) and hE4BP4 (742/991). Product amplification was observed only with mE4BP4 (742/1117). Panel C: CEM-C1-15 cells electroporated with 13.5 μg of linearized pCR3.1-mE4 plasmid expressing M. E4BP4 were selected in the presence of 400 μg/ml Geneticin. Seven micrograms of total RNA extracted from two mass culture populations (mE*a and mE*b) and four clones (mE#1-mE#4) obtained by limiting dilution was subjected to reverse transcription followed by end-point PCR analysis for the expression of M. E4BP4 (top gel). The clone labeled mE#3 (CEM C1-15 mE#3) (circled) was used for further analysis. Lower gel shows PCR products obtained with both mE4BP4 (742/1117) and hE4BP4 (742/991) primers using reverse transcription products from clone mE#3, parental CEM-C1-15 and CEM C7-14 cells as the template.
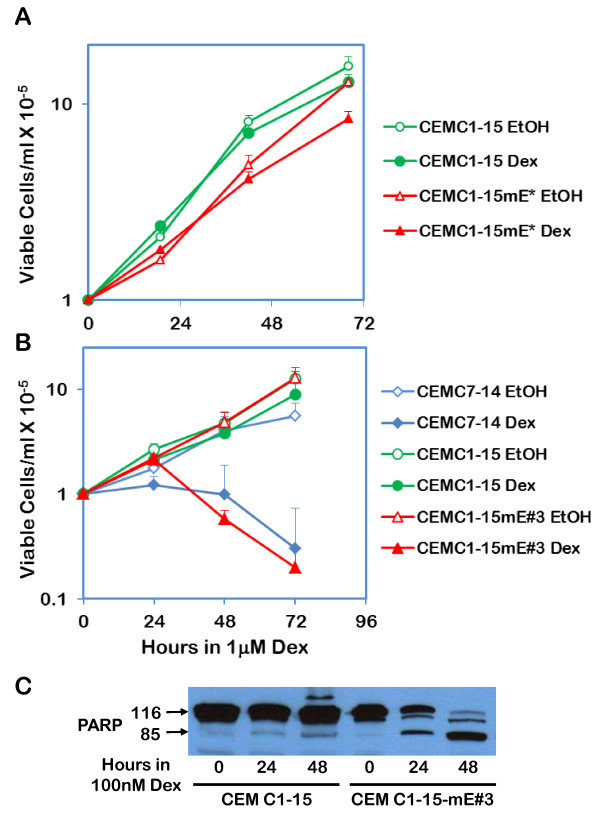
Figure 2
Dex induces apoptosis in CEM C1-15 cells transfected with M. E4BP4: Panel A:CEM C1-15 and a mass culture CEM C1-15 cells (CEM C1-15mE*) transfected with the mouse E4BP4 expressing construct pCR3.1-mE4 were seeded at a density of 1 × 10⁵cells/ml and treated for 72 h with either 0.1% ethanol (EtOH) or 1 μM Dex. Aliquots were taken at 24 h intervals and viable cell number was determined by trypan blue dye exclusion assay. Data represent average ± S.D. of three independent experiments with two replicates each. Panel B:A clone of CEM C1-15mE* with confirmed expression of mE4BP4 (CEM C1-15mE#3), and parental CEM C1-15 and CEM C7-14 cells were analyzed for cell viability in the presence of 0.1% ethanol or 1 μM Dex as in Panel A. Data represent averages ± S.D. of three separate experiments with two replicates each. Panel C: CEM C1-15 or CEM C1-15mE#3 cells treated for 48 h with 100 nM Dex and cell lysates were prepared from aliquots harvested every 24 h. Protein content of lysates was determined by the Bradford assay and 30 μg total protein from each sample was evaluated for PARP cleavage by Western blotting using a C-terminal-specific anti-PARP antibody (SC-7150, Santa Cruz Biotechnology).
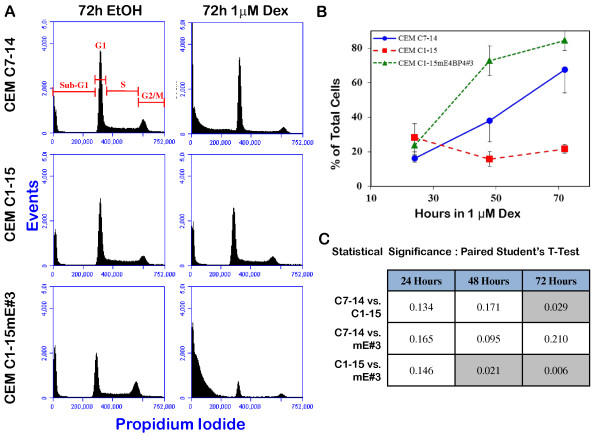
Figure 3
Flow cytometric cell cycle analysis demonstrates sub-G1 accumulation of CEM C1-15mE#3 cells treated with Dex: CEM C7-14, CEM C1-15 and CEM C1-15mE#3 cells were treated with 0.1% ethanol (EtOH) or 1 μM Dex for 24, 48 and 72 h, stained in propidium iodide, and analyzed for cell cycle distribution flow cytometrically using an Accuri C6 flow cytometer and CFlow® software. Panel A: Representative histograms of cell cycle distribution of ethanol and Dex treated cells after 72 h treatment. For each analysis 50,000 singlet cells were gated into sub-G1, G1, S and G2/M as indicated for the top left histogram. Panel B: Time course of accumulation of cells with sub-G1 DNA content as a percentage of total cells analyzed. Average ± S.D. from three independent experiments. Panel C: Data from three independent experiments were subjected to a paired Student's T-test (two sample, equal variance). Gray shaded boxes represent significant differences with p-values < 0.05.
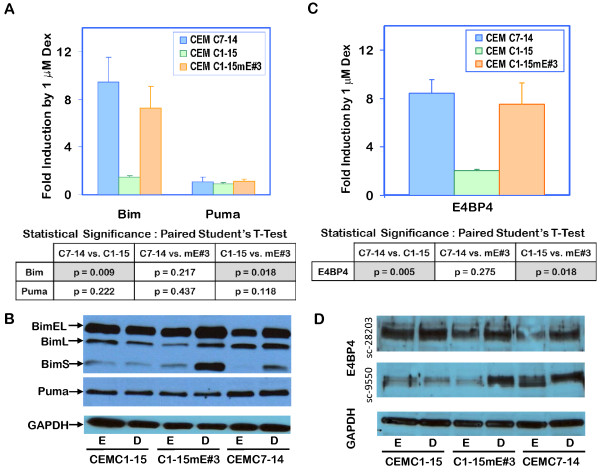
Figure 4
Dex-mediated upregulation of Bim and E4BP4 is restored in CEM C1-15mE#3 cells: Panels A and C: CEM C7-14, CEM C1-15 and CEM C1-15mE#3 cells were treated with 0.1% ethanol or 1 μM Dex for 24 h and total RNA was extracted in TriZol. Seven microgram RNA was subjected to reverse transcription reaction and real-time qPCR using primers specific for Bim or Puma (Panel A) or E4BP4 (Panel C) as listed in Table 1. Fold change in expression of each transcript by 1 μM Dex was calculated by the Pfaffl method using β-actin as a reference. Data represent averages ± S.D. from three independent experiments, which were analyzed for statistical significance using a paired student t-test, as shown in the table below each bar chart. Shaded boxes represent significant differences with p-values ≤ 0.05. Panels B and D: CEM C7-14, CEM C1-15 and CEM C1-15mE#3 cells were treated with 0.1% ethanol (E) or 100 nM Dex (D) for 24 h and total protein was extracted in lysis buffer. Protein content of lysates was measured by the Bradford assay, and 30 μg protein from each sample was evaluated by Western blotting for Bim and Puma expression (Panel B) or for E4BP4 expression using two different antibodies from Santa Cruz Biotechnology (Panel D). An antibody for GAPDH was used as a reference.
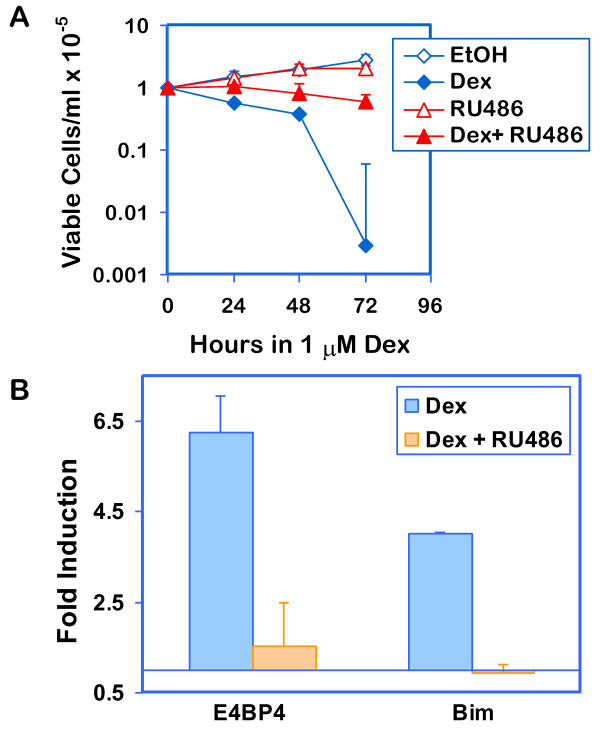
Figure 5
RU38486 blocks Dex-mediated effects in CEM C1-15mE#3 cells : Panel A: CEM C1-15mE#3 cells were seeded at a density of 1 × 10⁵cells/ml and treated for 72 h with either 0.1% ethanol (EtOH), 1 μM Dex, 1 μM RU486, or both Dex and RU486. Trypan blue excluding viable cells were counted at 24h intervals. Data represent averages ± SD from triplicate sets of treatments from two experiments. Panel B: CEM C1-15mE#3 cells were treated as in Panel A for 24h and RNA was extracted with TriZol. RNA was subjected to reverse transcription reaction and real-time qPCR using primers specific for Bim or Puma as described for Figure 4. Fold change in expression was calculated by the Pfaffl method using β-actin as a reference. Data represent averages ± SD from two independent experiments run in duplicates.
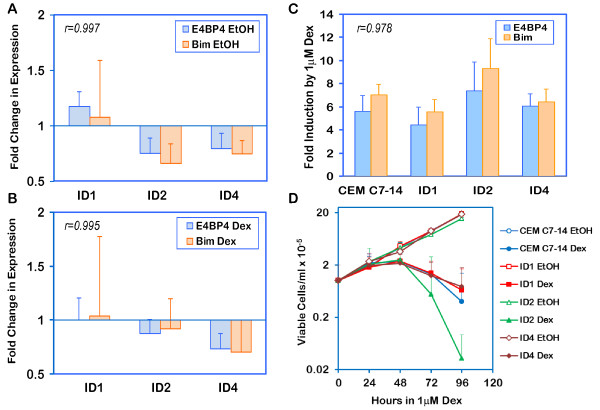
Figure 6
shRNA based variable knockdown of E4BP4 correlates with corresponding repression of Bim expression: CEM C7-14 cells were transfected with three different E4BP4 shRNA plasmidsID1, ID2 and ID4 with a puromycin selection marker. Transfected cells were selected in the presence of 1 μg/ml puromycin, and surviving cells were analyzed for extent of E4BP4 knockdown and Bim expression in comparison to untransfected cells. Cells were treated with 0.1% ethanol or 1 μM Dex for 24h and total RNA was extracted in TriZol. Seven microgram RNA was subjected to reverse transcription reaction and real-time qPCR using primers specific for E4BP4 or Bim as listed in Table 1. Fold change in expression in knockdown cells (ID1, ID2 or ID4), compared to CEM C7-14 cells, for ethanol treated (Panel A) and Dex treated (Panel B) cells was calculated by the Pfaffl formula: (Etarget)ΔCTtarget/(Eref)ΔCTref where ΔCTtarget = (CTCEM C7-14-CTID) for E4BP4 or Bim and ΔCTref = (CTCEM C7-14-CTID) for β-actin. Induction of E4BP4 or Bim expression in response to 1 μM Dex was calculated for CEM C7-14, ID1, ID2, and ID4, by the Pfaffl method, whereΔCTtarget = (CTethanol-CTDex) for E4BP4 or Bim and ΔCTref = (CTethanol-CTDex) for β-actin (Panel C). Efficiency for each reaction was calculated using the software LinRegPCR. Data represent averages ± S.D. from three independent experiments. Correlation between E4BP4 and Bim expression was determined by calculating the correlation coefficients (r) which are indicated on each panel. Panel D: CEM C7-14 and mass cultures of cells transfected with ID1, ID2 and ID4 shRNA plasmids against E4BP4, and selected with puromycin were seeded at a density of 1 × 10⁵cells/ml and treated for 96 h with either 0.1% ethanol (EtOH) or 1 μM Dex. Aliquots were taken at 24 h intervals and viable cell number was determined by trypan blue dye exclusion assay. Data represent average ± S.D. of three independent experiments with two replicates each.
Table 1
Primers used for PCR
| Transcript (Primer Name) | Forward Primer | Reverse Primer | Product Size |
|---|---|---|---|
| H. E4BP4 (HUMANE4BP4-742 & 991) | 5'ATGGGGAATTCTTTCTCTGG3' | 5'CTTTGATCCGGAGCTTGTGT3' | 250 bp |
| M. E4BP4 (Mouse E4BP4-742 &1117) | 5'ATGGGAAGCTCTTTCTCCACT3' | 5'TACCCGAGGTTCCATGTTTC3' | 376 bp |
| Bim (BIM 5/6 SENSE & ANTI) | 5'CAGATATGCGCCCAGAGATA3' | 5'ACCAGGCGGACAATGTAAC3' | 163 bp |
| Puma (PUMA SENSE & ANTI) | 5'AAGAGCAAATGAGCCAAACG3' | 5'GCAGAGCACAGGATTCACAG3' | 181 bp |
| β-actin (B-ACTIN-130 SENSE & ANTI) | 5'AGTCCTCTCCCAAGTCCACA3' | 5'CACGAAGGCTCATCATTCAA3' | 130 bp |