
Figure 1
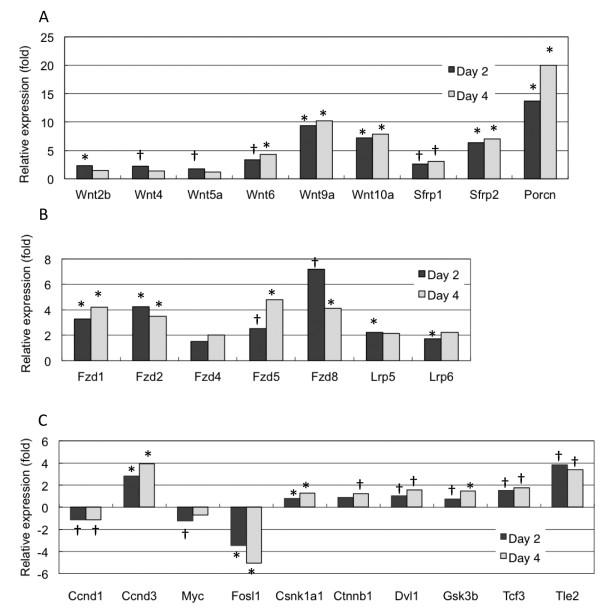
Endogenous Wnt signaling component expression during myogenic differentiation of C2C12 cells. Wnt signaling molecule expression was measured by quantitative RT-PCR. After 2 or 4 days culture in differentiation medium, cells were harvested, total RNA prepared and relative gene expression quantified by real-time PCR as follows: (A) wingless-related MMTV integration, Wnt; secreted frizzled-related protein, Sfrp; and porcupine, Porcn. (B) frizzled, Fzd; and low density lipoprotein receptor-related protein, Lrp. (C) cyclin D, Ccnd; myelocytomatosis oncogene, Myc; fos-like antigen 1, Fosl1; casein kinase 1, alpha 1, Csnk1a1; catenin, beta 1, Ctnnb1; dishevelled 1, Dvl1; glycogen synthase kinase 3 beta, Gsk3b; transcription factor 3, Tcf3; and transducin-like enhancer of split 2, Tle2. Day 2 and 4 time points were normalized to expression levels at day 0. Data are from three independent experiments, *P < 0.005 and † P < 0.05.
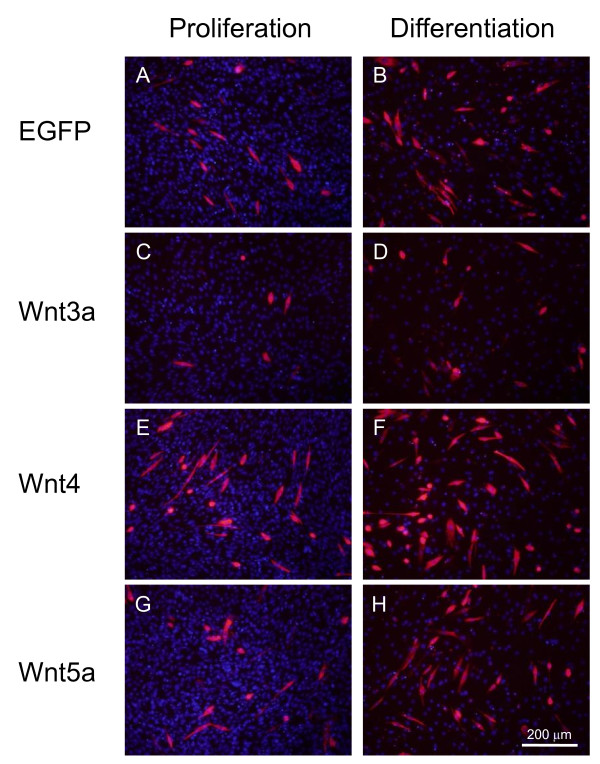
Figure 2
Wnt4 promotes myogenic differentiation of C2C12 cells. Expression constructs of Wnt family members in adenovirus vector were transfected into C2C12 cells and myogenic differentiation was determined by troponin T immunostaining after 2 days culture in differentiation medium, which commenced 24 h post-transfection.
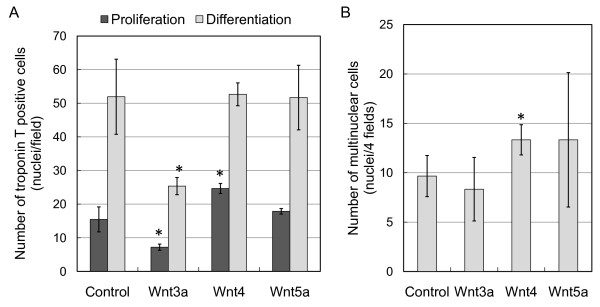
Figure 3
Wnt4 promotes myogenic differentiation and induces fusion of C2C12 cells. (A) Troponin T expression after 3 day culture in proliferation or differentiation medium with recombinant adenoviruses expressing Wnt3a, Wnt4, Wnt5a or eGFP (control). Cell numbers are the means and standard deviations of three independent experiments performed in triplicate, *P < 0.01 vs. control. (B) Differentiated myotubes were evaluated by counting nuclei within fused multinucleated cells expressing troponin T. Four fields in triplicate cultures were used for counting fused cells cultured under a differentiation condition, *P < 0.04 vs. control.
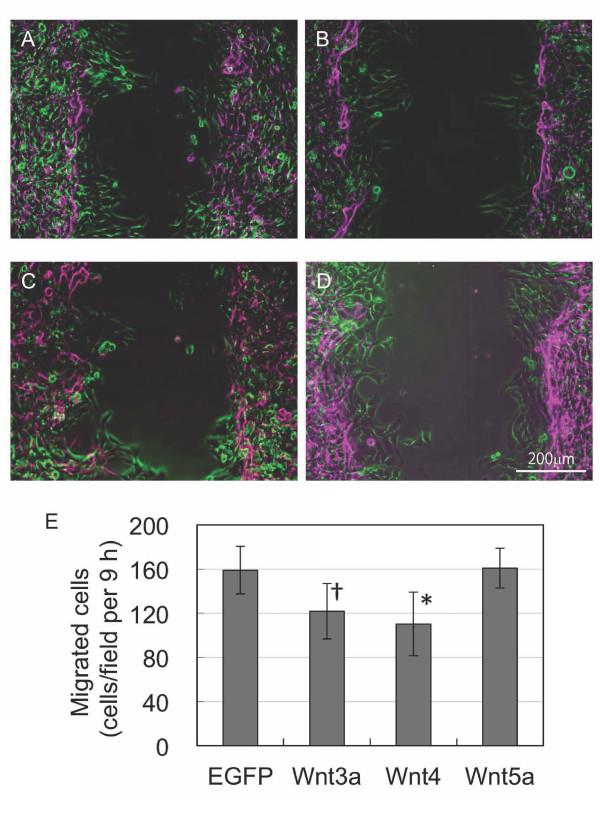
Figure 4
Effect of Wnt expression on cell migration. A scratch test was used to determine C2C12 cell proliferation and migration. Cell numbers were counted over 9 h, and mobility was monitored by time-lapse microscopy. Phase contrast images at 0 h (purple) and 9 h (green) were merged to show the migration of C2C12 cells expressing eGFP (A), Wnt3a (B), Wnt4(C) and Wnt5a (D). (E) Summary of cell numbers counted over 9 h (cells/field) with n = 3 for control, Wnt3a and Wnt4, and n = 4 for Wnt5a. *P < 0.01; † P < 0.02 vs. eGFP.
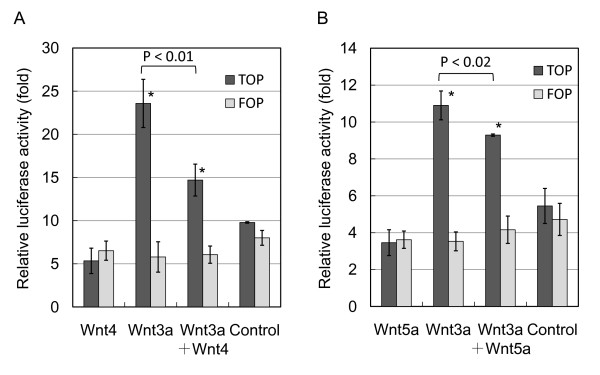
Figure 5
Wnt4 reduces Wnt-3a-induced transcriptional activity in myoblasts. Reporter assays were performed using TOP/FLASH and FOP/FLASH (luciferase assay) in C2C12 cells. Wnt3a significantly increases luciferase activity in TOP over FOP. (A) Wnt4 has no effect on luciferase activity, whereas Wnt4 inhibits Wnt3a activity. (B) Wnt5a poorly inhibits Wnt3a activity. Bars are the means of four independent experiments. *P < 0.01 between TOP and FOP; P < 0.01 between Wnt3a and Wnt3a + Wnt4 in TOP; P < 0.02 between Wnt3a and Wnt3a + Wnt5a in TOP.
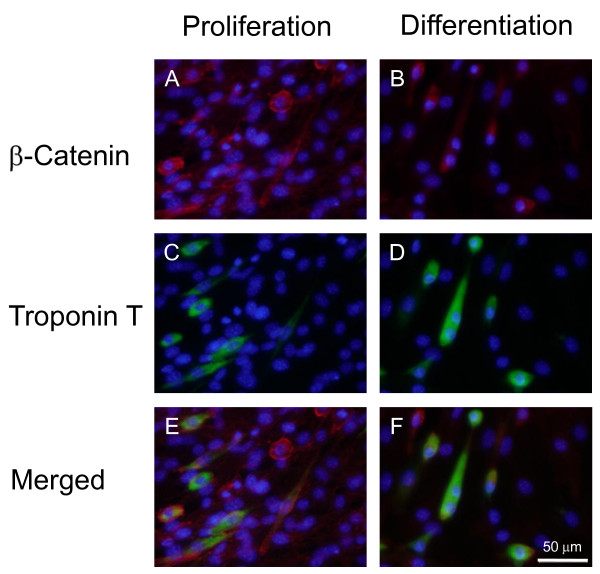
Figure 6
Localization of β-catenin and troponin T in proliferative and differentiating C2C12 cells. C2C12 cells cultured in proliferation and differentiation medium were double immunostained for β-catenin (A, B; red) and troponin T (C, D; green), and counterstained with DAPI (blue). Immunofluorescent images with various filters are merged (E, F).
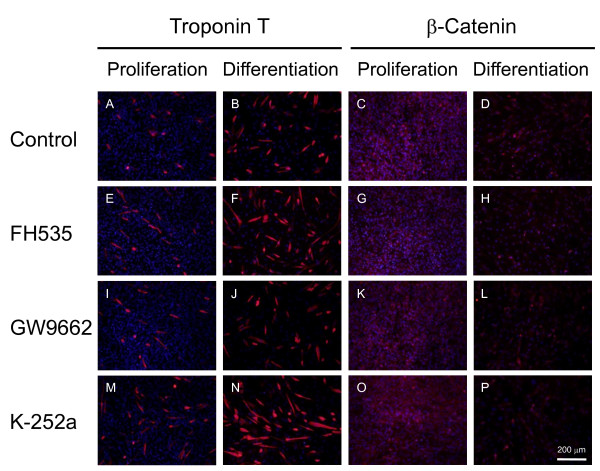
Figure 7
Effect of small-molecule inhibitors on C2C12 cell proliferation and differentiation. C2C12 cells were cultured without inhibitors (A-D) and with 1 μM FH535 (E-H), 1 μM GW9662 (I-L) and 3.6 nM K-252a (M-P), then immunostained with anti-troponin T (A, B, E, F, I, J, M, N) and anti-β-catenin (C, D, G, H, K, L, O, P) antibodies. FH535 interferes with β-catenin/Tcf complex formation, whereas GW9662 is structurally similar to FH535, but does not interfere with complex formation. K252a is a Trk kinase inhibitor, which phosphorylates β-catenin at tyrosine 654.
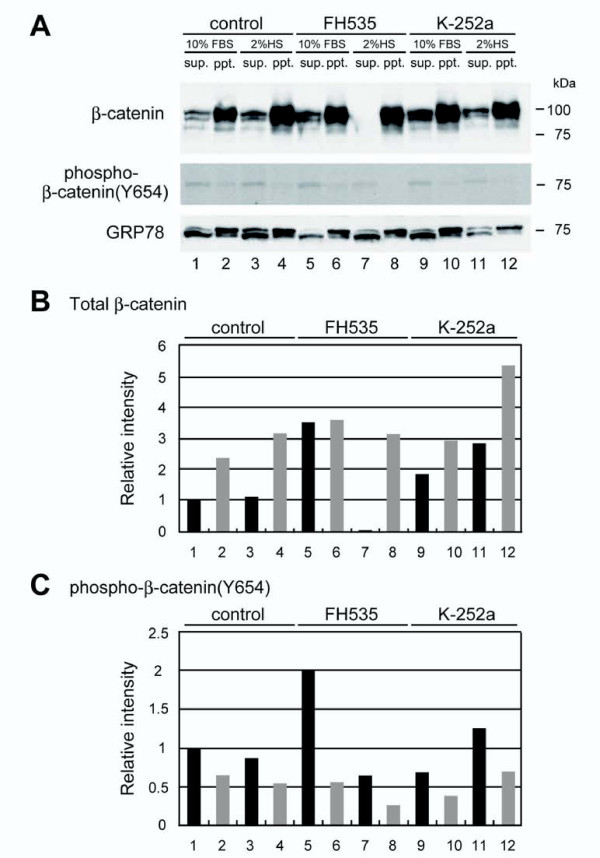
Figure 8
FH535 and K252a alter total and phospho-β-catenin (Y654) in C2C12 cells. (A) Western blots of cytosolic and membrane fractions from C2C12 cells treated with FH535 and K-252a using antibodies against total cellular-β-catenin (upper panel) and phosphorylated β-catenin (lower panel). GRP78 indicates loading control. (B, C) Relative levels of total and phosphorylated β-catenin in cytosolic (black) and membrane (grey) fractions were calculated as the β-catenin/GRP78 ratio. Band intensities are relative to the control cell values in the cytosolic fraction and defined as 1.0. Similar results were obtained in three independent experiments.
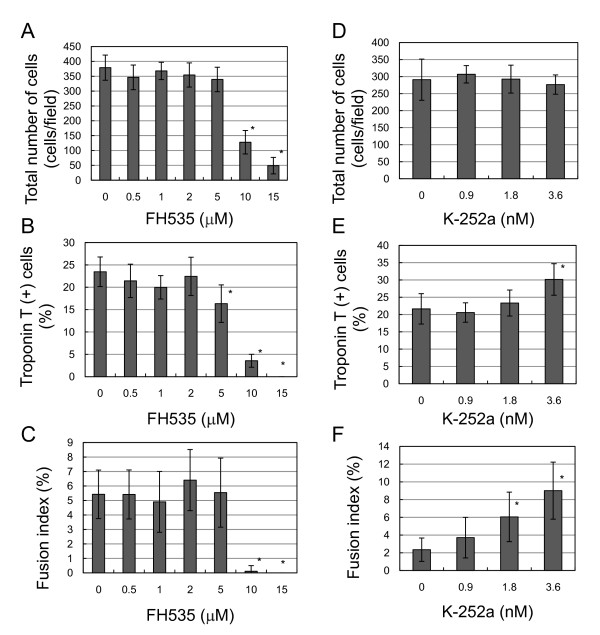
Figure 9
Effect of FH535 and K252a on C2C12 cell proliferation and differentiation. C2C12 cells were cultured with or without various FH535 and K252a concentrations followed by troponin T immunostaining. Total cell numbers are the counted DAPI-stained nuclei and the fusion index is the percentage of multinucleated cells among troponin T-positive cells. *P < 0.001 vs. absence of inhibitors.
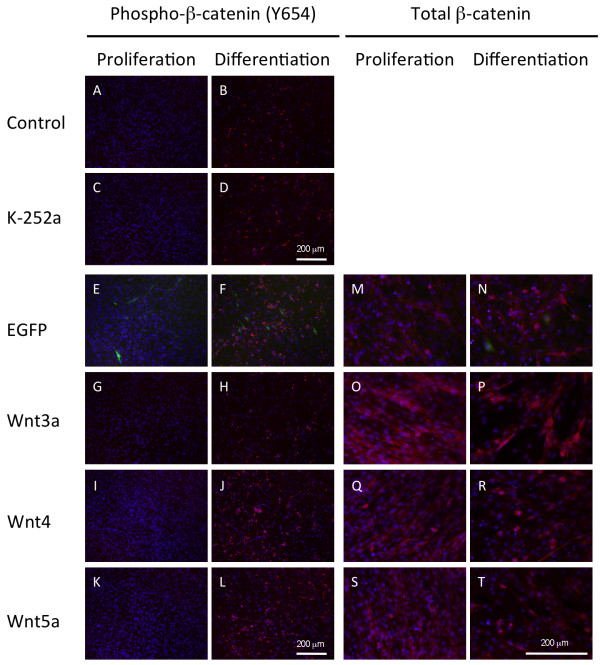
Figure 10
Wnt family members differentially regulate β-catenin phosphorylation and subcellular localization in C2C12 cells. (A-D) C2C12 cells were cultured with or without K252a, and then phospho-β-catenin (Y654) was immunostained. K252a caused an accumulation of vesicles containing phospho-β-catenin (Y654) in C2C12 cells. (E-L) Wnt3a, Wnt4 and Wnt5a are overexpressed in C2C12 cells by adenovirus-mediated gene transfer. After 2 day culture in differentiation medium commencing 24 h post-transfection, subcellular phospho-β-catenin (Y654) localization was determined by immunostaining. (M-T) C2C12 cells expressing eGFP, Wnt3a, Wnt4 and Wnt5a were immunostained with anti-pan-β-catenin antibodies. Cytoplasmic β-catenin is elevated with Wnt3a expression in proliferation medium and maintained at a higher level in differentiation medium, whereas nuclear and membrane-bound β-catenin is increased with Wnt4 expression.