
Figure 1
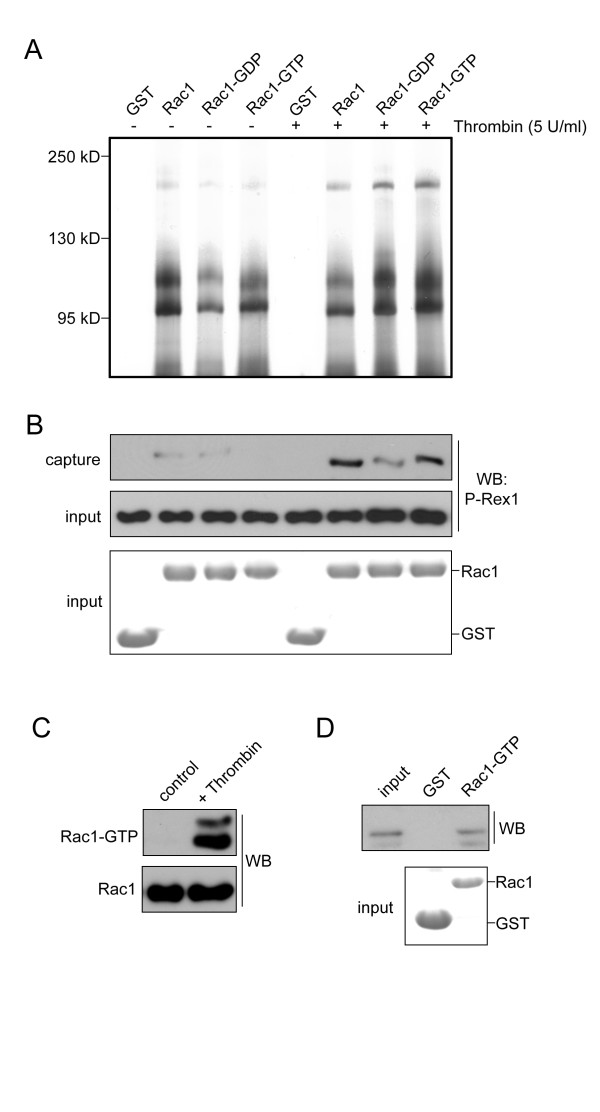
Identification of P-Rex1 as a Rac1-associated protein in platelets. Lysates from quiescent or thrombin stimulated platelets were incubated with glutathione agarose conjugated to GST-tagged Rac1, GDP-loaded Rac1, GTP-loaded Rac1 or GST alone. (A) Captured proteins were eluted into sample buffer and resolved by SDS-PAGE followed by silver staining. (B) Captured protein eluates and whole platelet lysates (input, middle panel) were probed for the presence of P-Rex1 by western blot (WB) with P-Rex1 antisera sc-85805 (Santa Cruz) as previously described [24,25]. Total Rac1-GST and GST protein inputs for capture experiments are shown by Coomassie stain. (C) Platelets from wild type mice (5 × 10⁸/ml) were treated with 1 U/ml of thrombin for 5 minutes and analyzed for Rac1 activation as previously described [5]. (D) Thrombin-stimulated mouse platelets were lysed in MPER buffer as previously described [19] and incubated with glutathione agarose conjugated to GTP-loaded Rac1-GST or GST alone for 1 hour at 4°C. Eluates were probed for mouse P-Rex1 capture by western blot (WB). Total P-Rex1 from mouse platelet lysates is shown as input (10% of total P-Rex1). Total Rac1-GST and GST protein inputs for capture experiments are shown by Coomassie stain.
Table 1
Recovered P-Rex1 peptides
| Peptide (n) | Sequence |
| 1 | EIDQDAYLQLFTK |
| 2 | LVDWLLAQGDCQTR |
| 3 | FLQSAFLHR |
| 4 | NQLLLALLK |
| 5 | GSLAEVAGLQVGR |
| 6 | TTDIPLEGYLLSPIQR |
| 7 | IACYQEFAAQLK |
| 8 | TTDIPLEGYLLSPIQR |
| 9 | LCVLNEIGTER |
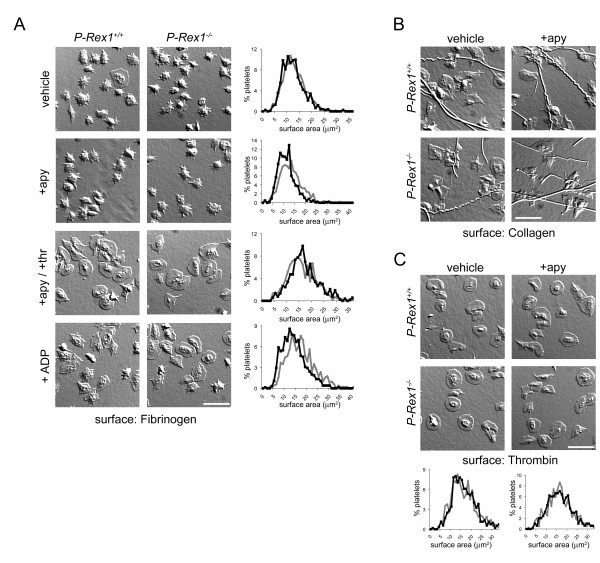
Figure 2
Substrate surface spreading of P-Rex1-/- platelets. Washed mouse platelets from wild type (P-Rex1+/+) or P-Rex1-/- mice were placed on 100 μg/ml fibrinogen-coated (A), 100 μg/ml fibrillar collagen-coated (B) or 50 μg/ml thrombin-coated (C) coverslips in the presence of vehicle, 2 U/ml apyrase (+apy), apyrase and 1 U/ml thrombin (+apy/+thr) or 10 μM ADP for 45 min at 37°C and imaged by DIC microscopy. The individual surface areas of 300 P-Rex1+/+ (black line) and 300 P-Rex1-/- (grey line) platelets were quantified using Image J software and plotted as a frequency distribution. DIC images and platelet surface area histograms are representative of > 3 experiments. Scale bar = 10 μm.