
Figure 1
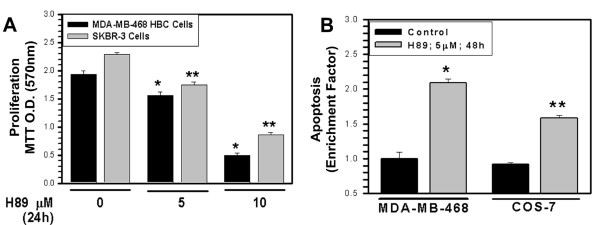
H89 attenuates cell proliferation (A) and enhances apoptosis (B). Cells growing in normal serum conditions were either untreated (noted as 0) or treated with noted doses of H89 for indicated time, followed by determination of cell proliferation by MTT assay (panel A) or apoptosis (panel B) as in methods. Columns in histograms in panels A and B represent data from 3 independent experiments; bars, SE. Data in both panels were analyzed using a two-tailed Student t test. For panel A, *P and **P < 0.0018 and 0.00002, respectively, and for panel B, *P and **P < 0.000026 and 0.0003, respectively, compared to the corresponding untreated controls.
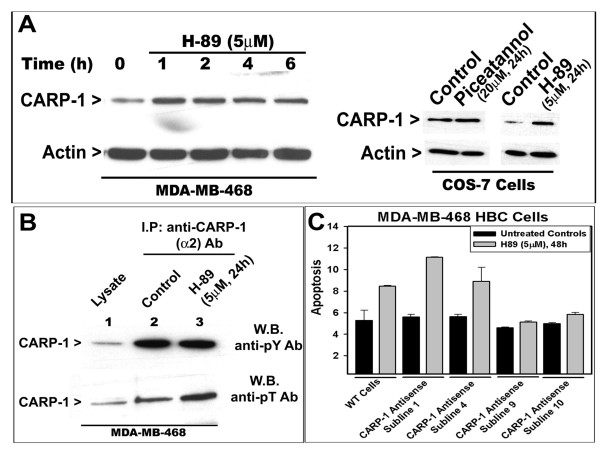
Figure 2
H89 induces CARP-1 expression (A) and threonine phosphorylation (B), and depletion of CARP-1 abrogates apoptosis by H89 (C). In panel A, the cells were treated with noted dose of H89 or piceatannol for indicated time periods. Approximately 100 μg of respective protein lysates were electrophoresed on 10% SDS-PAGE, followed by western immunoblotting. The membranes were first probed with anti-CARP-1 (α2) antibody [3], followed by probing with anti-actin antibody to assess loading. In panel B, cells were either untreated (Control) or treated with H89 for indicated dose and time, and cell lysates were prepared. In lanes 2 and 3, co-immunoprecipitation using noted antibodies and 1000 μg protein lysate was carried out prior to western blotting. In lane 1, 100 μg protein lysate was analyzed along with immunoprecipitates on 10% SDS-PAGE followed by immunoblotting with anti-phospho-tyrosine or anti-phospho-threonine antibodies. In panel C, HBC cells expressing normal (indicated as CARP-1 antisense sublines 1, 4) or 50% reduced CARP-1 (indicated as sublines 9, 10) were either untreated or treated with noted time and dose of H89, and apoptosis determined as in figure 1D. Columns in histogram represent data from 3 independent experiments; bars, SE.
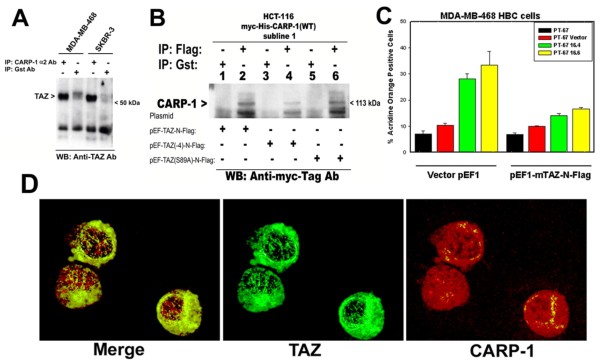
Figure 3
CARP-1 interacts with TAZ (A, B), TAZ expression interferes with CARP-1-dependent apoptosis (C), and CARP-1 and TAZ co-localize in cytoplasmic/perinuclear region (D). For CARP-1 binding with TAZ, Breast cancer cells (panel A) or HCT-116 colon cancer cells expressing myc-His-tagged wild-type CARP-1 (panel B) were utilized. In panel B, the cells were transfected with plasmids encoding wild-type or mutant TAZ proteins as indicated, prior to generating cell lysates. The cell lysates were then utilized for immunoprecipitation and western blotting using noted antibodies essentially as in figure 2C. In panel C, cells were transfected with plasmids encoding vector or wild-type TAZ followed by their transduction with indicated retroviruses expressing vector or wild-type CARP-1 as detailed in methods. The apoptosis levels were assessed by determining the acridine orange-positive cells as described before [4]. Columns in histogram represent data from 3 independent experiments; bars, SE. In panel D, the cells were transfected with a combination of plasmids encoding myc-His-tagged wild-type CARP-1 and flag-tagged wild-type TAZ proteins, followed by their fluorescent labeling and photography as described in methods.
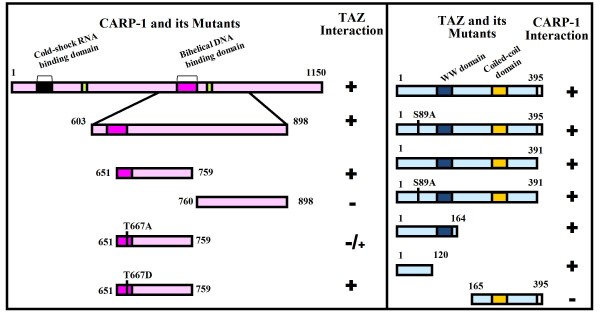
Figure 4
CARP-1 (651-759) binds with TAZ (1-120). Schematic diagram of CARP-1 (WT and its various mutants; Left Box) and TAZ (WT and its mutants; Right Box) constructs that were utilized to map minimal epitopes for their interaction. All CARP-1 proteins have myc and 6 × His epitopes at their carboxyl termini. All the TAZ proteins, with the exception of 1-120, 1-164, and 165-395, harbored flag epitope at their amino termini, while TAZ 1-120 and its 1-164 and 165-395 mutants had Gst epitope at their amino termini. Positive interactions are indicated by + and loss/absence of interaction is denoted by -.
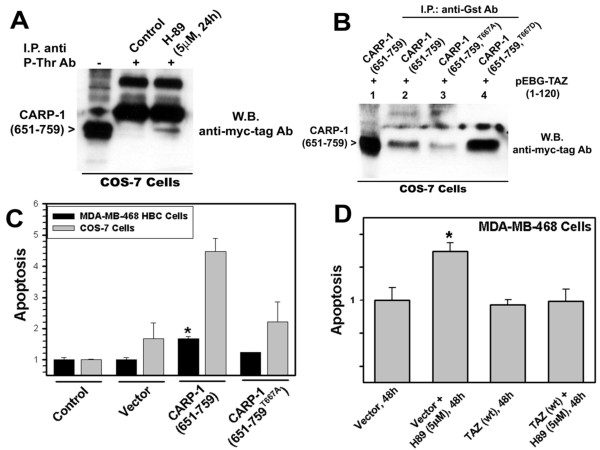
Figure 5
CARP-1 threonine667 is a target of H89 signaling, regulates CARP-1-TAZ binding, and CARP-1-dependent apoptosis. (A) Cells transfected with plasmid encoding myc-His-tagged CARP-1 (651-759) mutant were either untreated (Control) or treated with H89 for indicated dose and time, and cell lysates were prepared, and protein lysate subjected to immunoprecipitation using phospho-theronine antibodies (noted as P-Thr Ab), and protein lysate (100 μg, lane indicated with -) along with immunoprecipitates (lanes indicated with +) analyzed by western blotting with anti-myc-tag antibody. (B) Cells were transfected with plasmid encoding flag-tagged TAZ (1-120) mutant [indicated as pEBG-TAZ (1-120)] in combination with plasmids expressing noted myc-His-tagged CARP-1 mutant proteins. The cell lysates in lanes 2, 3, and 4 were subjected to immunoprecipitation using anti-Gst tag antibodies essentially as in figure 4B. Protein lysate and immunoprecipitates analyzed by western blotting as in panel A. Presence of CARP-1 (651-759) proteins is indicated on the left side of each panel. (C) Cells were either untransduced (Control), or transduced with retroviruses expressing vector or myc-His-tagged CARP-1 mutants. (D) Cells were transduced with retroviruses encoding vector plasmid or wild-type TAZ followed by treatments with H89 for noted dose and time. Protein lysates in both panels C and D were assayed for apoptosis essentially as in figure 1D. Columns in histograms represent data from 2 independent experiments; bars, SE. Data in panels C and D were analyzed using a two-tailed Student t test. For panel C, *P < 0.005, while for panel D, *P < 0.0087, compared to the corresponding vector controls.
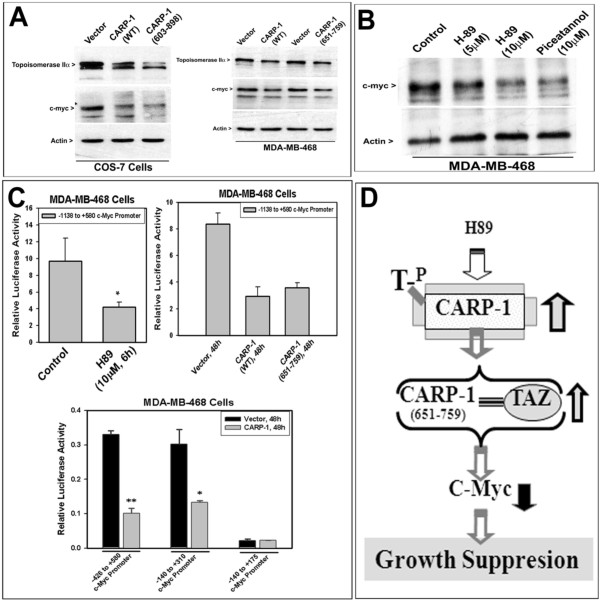
Figure 6
Expression of CARP-1 (A) or H89 treatment (B) causes reduced c-myc levels, in part by suppressing c-myc transcription (C). Cells were transduced with retroviruses encoding vector or CARP-1 proteins as indicated in panel A. For panel B, HBC cells were either untreated or treated with indicated doses of H89 or piceatannol. Approximately 100 μg of respective protein lysate was analyzed by SDS-PAGE, followed by western immunoblotting with either anti c-myc or topoisomerase IIα antibodies essentially as in methods. The membrane was subsequently probed with anti-actin antibody to assess loading. Presence of c-myc, topoisomerase IIα and actin proteins is denoted on the left side of each panel. In panel C, HBC cells were transfected with indicated c-myc promoter-luciferase reporter plasmid. The cells were either untreated (Control) or treated with H89. In addition, the HBC cells were separately transfected with luciferase reporter plasmids having full length c-myc promoter or its various deletions, followed by their transduction with retroviruses encoding vector or CARP-1 protein. The cell lysates were analyzed for luciferase reporter activities as in methods. Columns in the histograms represent means of two independent experiments; bars, SE. Data were analyzed using a two-tailed Student t test. For top left histogram, *P < 0.044, compared to the corresponding control, and for the lower histogram, *P < 0.0055 and **P < 0.006, compared to the respective vector-transduced controls. Panel D, Schematic of CARP-1-dependent growth suppression signaling in the presence of H89. = , Binding.