
Figure 1
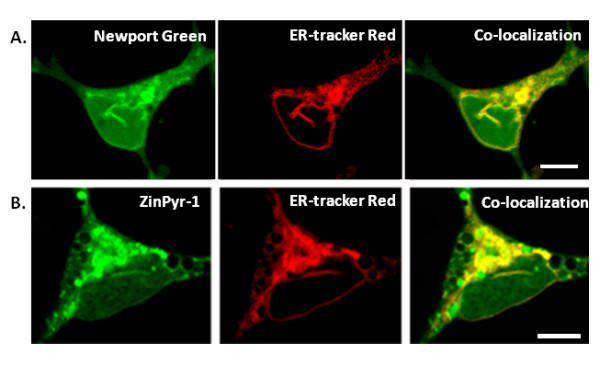
Co-localization of intracellular Zn2+ and ER fluorescence. Images of cultured cortical neurons co-labeled with the intracellular fluorescent Zn2+ indicators and a live cell marker for the ER. A. Fluorescent Zn2+ indicator Newport Green AM co-localizes with the ER marker ER-Tracker Red. B. Fluorescent Zn2+ indicator ZinPyr-1 co-localizes with the ER marker ER-Tracker Red. Cells were incubated with 10 μM of the specified fluorescent Zn2+ indicator and 1 μM ER-Tracker Red then imaged using a LSM510 confocal microscope equipped with a 100x/1.3NA objective.
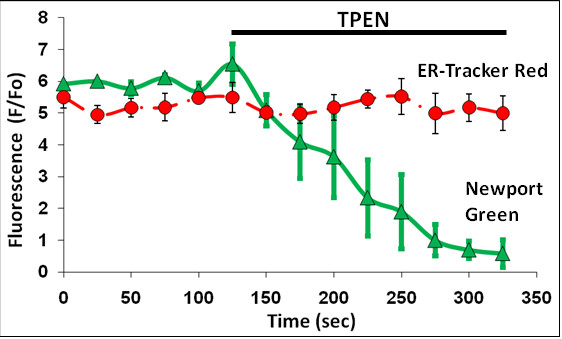
Figure 2
Effect of Zn2+ chelation. The graph indicates the fluorescent response of Newport Green (green line) and ER-Tracker Red (red line) in unstimulated neurons upon TPEN (10 μM) exposure, data points represent the mean ± SD of n = 5 trials. The quenching of Newport Green fluorescence with TPEN indicates the presence of free Zn2+ in the basal condition.
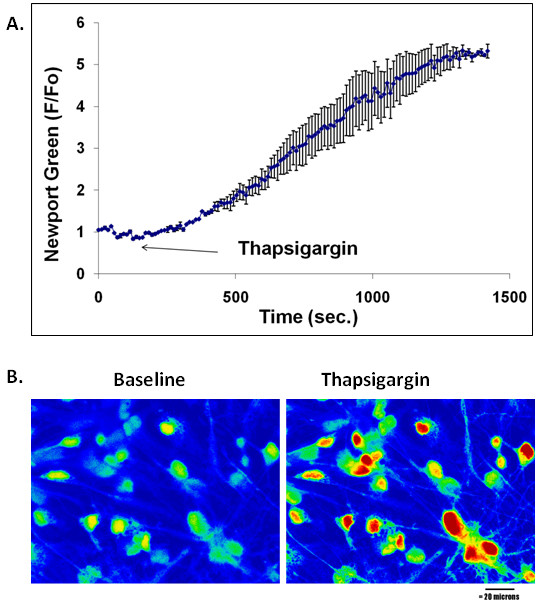
Figure 3
Thapsigargin-induced Zn2+ release in cultured cortical neurons. A. The graph shows the increases in fluorescence intensity of cells in response to the treatment with thapsigargin (2 μM). Data points represent the mean ± SD of n = 3 trials. Cells were labeled with Newport Green (10 μM). B. Representative fluorescent images of cortical neurons loaded with Newport Green before and after exposure to thapsigargin.
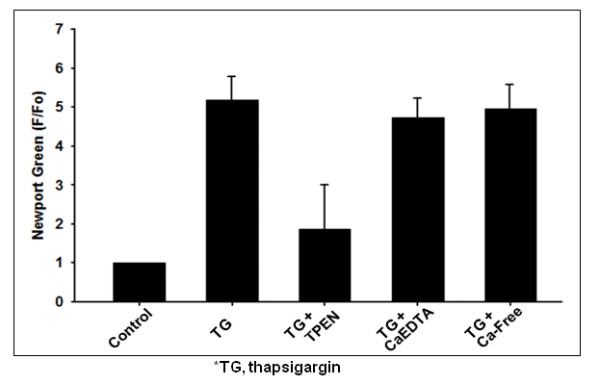
Figure 4
Summary of Zn2+ transients induced by thapsigargin in cortical neurons. The bar graphs show peak fluorescence after the treatment with thapsigargin alone (n = 6), thapsigargin plus TPEN (10 μM; n = 6), thapsigargin plus CaEDTA (1 mM; n = 3), and thapsigargin in the medium without added Ca2+ (n = 4). Data points represent the mean ±SD.
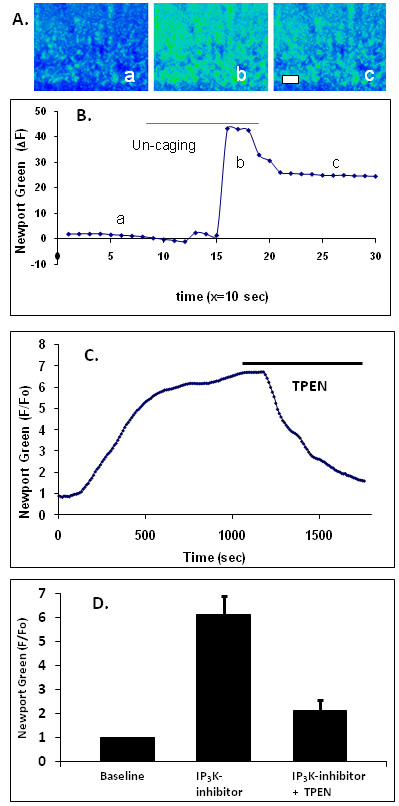
Figure 5
IP3 stimulation results in the release of intracellular Zn2+. A. The photo-uncaging of caged IP3 (2 μM) in brain hippocampal neurons loaded with the Zn2+ fluorescent indicator Newport Green results in an increase of cytosolic Zn2+. Scale bar = 20 μm and the images a, b, and corresponding to points in B. B. The graph shows a change of fluorescence in response to IP3 stimulation. C. A change of fluorescence in responses to the treatments of the IP3-3K inhibitor N2-(m-trifluorobenzyl),N6-(p-nitrobenzyl)purine (20 μM) and TPEN (10 μM) in cells loaded with Newport Green. D. Bar graph shows the average response of Newport Green to the IP3K-inhibitor (n = 4). The application of TPEN at the peak of fluorescence resulted in significant (n = 2) fluorescence quenching, demonstrating that the fluorescence elevation was due to increased free Zn2+.