
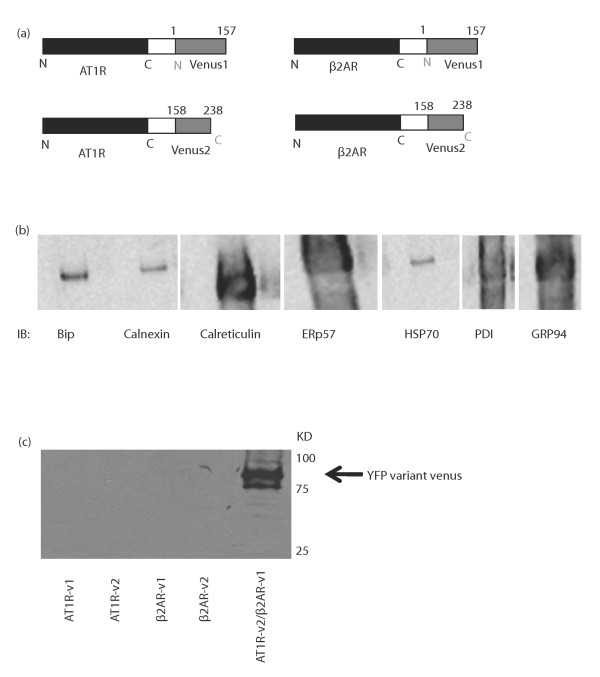
Figure 1
Expression of the receptor dimer pairs. a) Schematic presentation of the constructs used in the experiments. Venus1 contains the N- terminal end of the yellow fluorescent protein variant (venus) and represents the first 157 amino acids while venus2 contains the C- terminal end of the protein and represents amino acids 158 to 238. b) HEK293 cells were harvested, washed and lysed with RIPA buffer. Samples were then run on SDS-PAGE and Western analysis was performed using indicated chaperone antibodies (1:2000). c) Specificity of GFP antibody to dimers was tested in HEK293 cells. The cells were transfected with AT1R-v1 or v2, β2AR-v1 or v2 and AT1R-v2 with β2AR-v1. 48 hours after transfection, cells were lysed in RIPA buffer. Western analysis was performed using anti-GFP (1:2000) and indicate the presence of a yellow fluorescent protein variant, venus. Results are representative of 3 independent experiments.
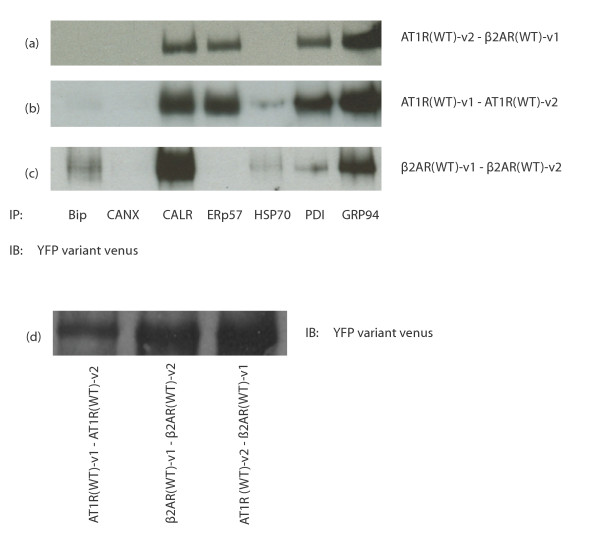
Figure 2
Interaction of wild type receptor dimers with chaperones. HEK293 cells were transfected with AT1R (WT)-v1/v2 and β2AR (WT)-v1/v2. After 48 hours, cells were harvested, washed, lysed with RIPA. This lysate was distributed into eight different microcentrifuge tubes and co-immunoprecipitations were performed using the indicated chaperone antibody. a) AT1R/β2AR (WT) heterodimer, b) AT1R (WT) homodimer c) β2AR (WT) homodimer. The eighth sample was loaded as a control to show the expression level of the wild type receptor dimers as shown in d. Results are representative of 4 independent experiments.
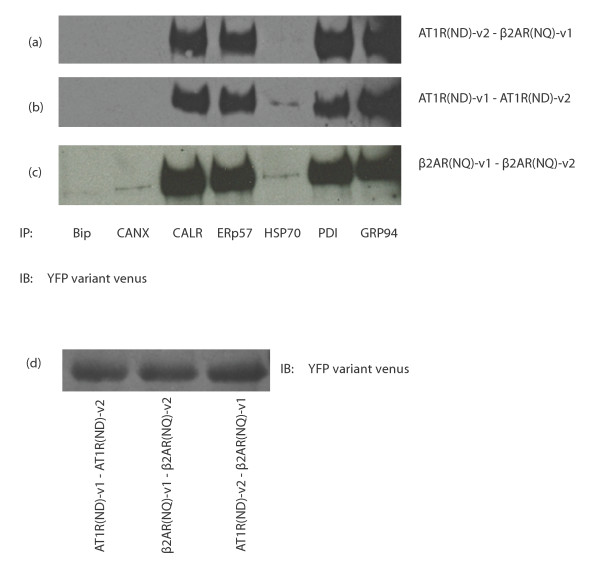
Figure 3
Interaction of immature receptor dimers with chaperones. HEK293 cells were transfected with AT1R (N4, 176, 188D)-v1/v2 and β2AR (N 4, 15, 176Q)-v1/v2. After 48 hours, cells were harvested, washed, lysed with RIPA and precleared with protein A-sepharose beads. This lysate was distributed into eight different microcentrifuge tubes and co-immunoprecipitations were performed using the indicated chaperone antibody. a) AT1R (ND)/β2AR (NQ) heterodimer, b) AT1R (ND) homodimer, c) β2AR (NQ) homodimer. The eighth sample was loaded as a control to show the expression level of the immature receptor dimers as shown in d. Results are representative of 4 independent experiments.
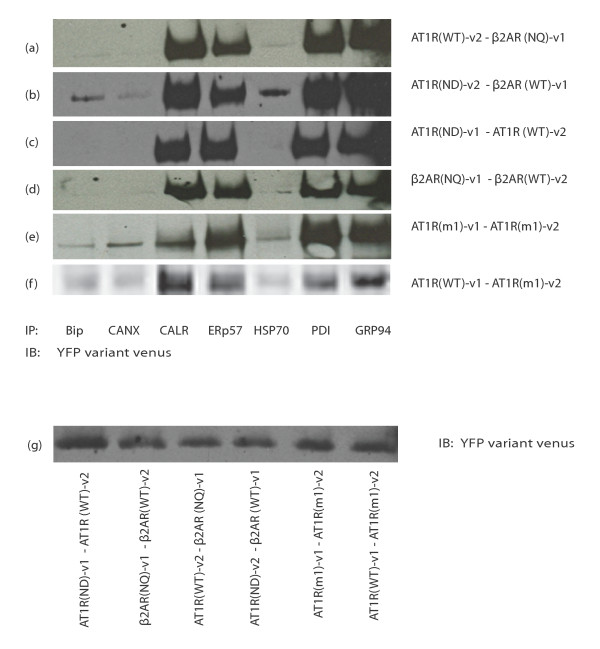
Figure 4
Immature receptors dictate dimers interaction with chaperones. HEK293 cells were transfected with AT1R (WT or ND)-v1/v2 and β2AR (WT or NQ)-v1/v2. After 48 hours, cells were harvested, washed, lysed with RIPA and precleared with protein A-sepharose beads. The lysate was distributed into eight different microcentrifuge tubes and co-immunoprecipitations were performed using the indicated chaperone antibody. The eighth sample was loaded as a control to show the expression level of the different receptor dimers as shown in g. Results are representative of 4 independent experiments.
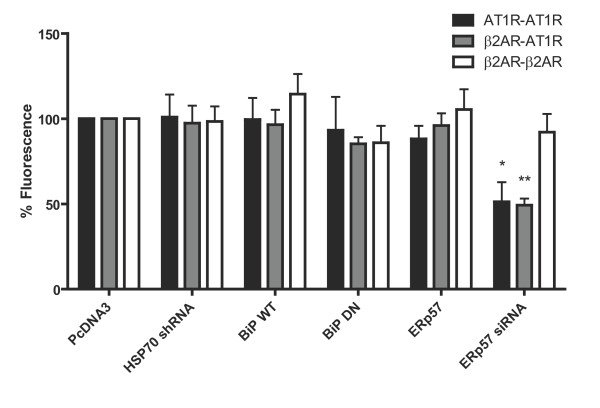
Figure 5
The effect of Bip, HSP70 and ERp57 on receptor dimerization. HEK293 cells were transfected with WT AT1R-v1/v2 and β2AR-v1/v2. After 48 hours, cells were harvested, washed with 1X PBS and resuspended in 100 μl PBS. Fluorescence was then measured using an EnVision plate reader at 528 nm. Results are expressed as means ± sem of at least 3 experiments. * = p < 0.05; ** = p < 0.01 compared with negative controls using two-tailed paired Student's t test. Results are representative of 3 independent experiments.
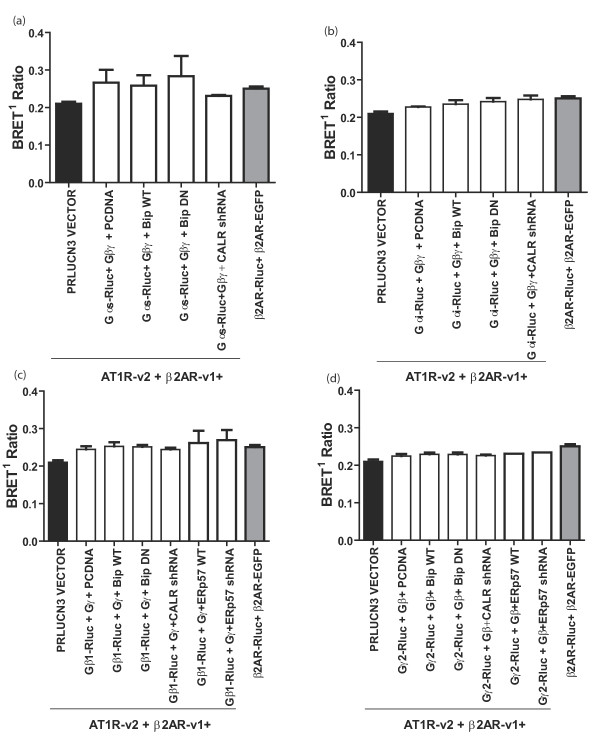
Figure 6
The effect of Bip, Calreticulin and ERp57 on G-protein assembly with the heterodimer. HEK293 cells were transfectedwith β2AR-v1, AT1R-v2 and Rluc G-proteins (Gαs, Gαi, Gβ1 and Gγ2). 48 hours post transfection, cells were harvested, washed three times with PBS then suspended in 100 μl PBS. 90 μl of the samples was distributed into 96 well plates and 10 μl of 5 μM coelenterazine H was added and mixed then the fluorescence energy emitted by Rluc and YFP (venus) was measured at their corresponding emission wavelengths (460 and 528 nm, respectively). The BRET ratio was then calculated and plotted with the ratios for a negative control (β2AR-v1, AT1R-v2 and the pRluc-N3 vector) and a positive control (β2AR-Rluc and β2AR-EGFP). Results are expressed as means ± sem of at least 3 experiments. Statistical analysis was performed using two-tailed paired Student's t test.