
Figure 1
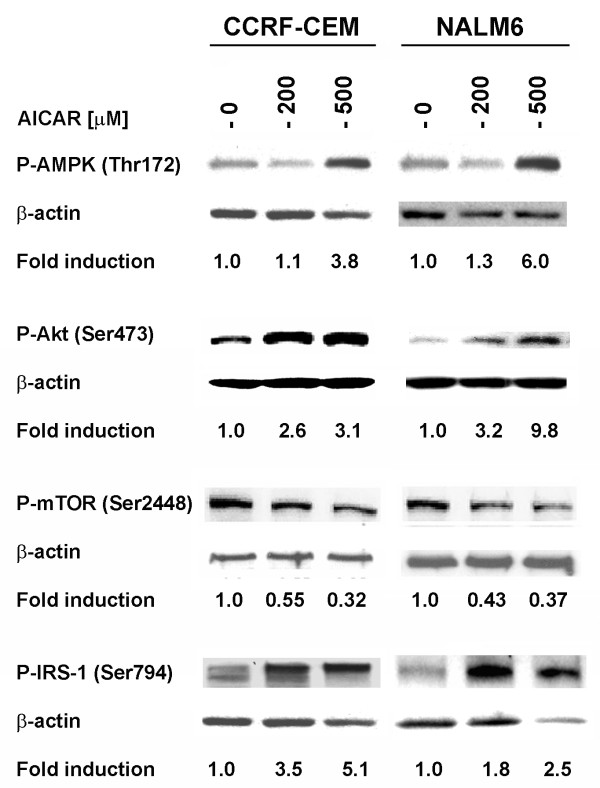
Activation of AMPK induces phosphorylation of IRS-1 at Ser794 and down-regulation of mTOR (Ser2448) in ALL cell lines. Western blot analysis of the expression of AMPK (Thr172), Akt (Ser473), mTOR (Ser2448) and IRS-1 (Ser794) in CCRF-CEM (T-ALL) and NALM6 (Bp-ALL) cells treated with AICAR (200 and 500 μM) and incubated for 24 h at 37°C. The density value of each band was normalized to β-actin level and expressed relative to control (shown as fold induction).
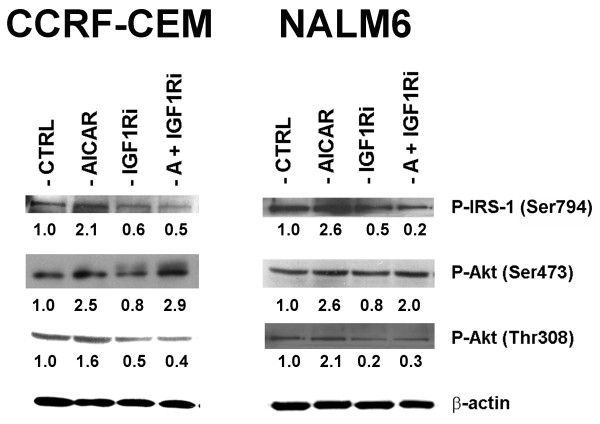
Figure 2
AICAR-induced AMPK activation phosphorylates Akt at Ser473 in a mechanism independent of IGF-1R/IRS-1 signaling in ALL cell lines. Western blot analysis of P-IRS-1 (Ser794), P-Akt (Ser473), and P-Akt (Thr308) in CCRF-CEM and NALM6 cells treated with 0.1% DMSO (CTRL), AICAR (200 μM), the IGF-1R tyrosine kinase inhibitor HNMPA(AM)3 (IGF1Ri, 10 μM), or both agents (A + IGF1Ri) and incubated for 24 h at 37°C. The levels of P-IRS-1 and P-Akt were normalized to β-actin (loading control) and expressed relative to control (shown as fold induction).
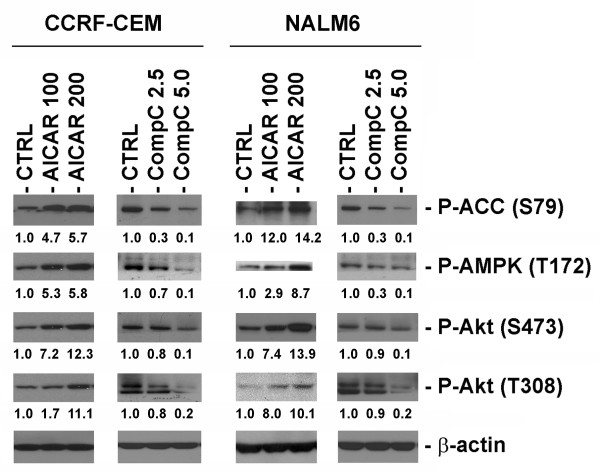
Figure 3
Functional AMPK activity is required for activation of Akt at Ser473 and Thr308 in ALL cell lines. CCRF-CEM and NALM6 cells were exposed to either the AMPK activator AICAR (100 and 200 μM) or the AMPK inhibitor compound-C (CompC, 2.5 and 5.0 μM) for 24 h at 37°C. Proteins were extracted and analyzed by Western immunoblotting for the expression of P-Akt (Ser473 and Thr308), P-AMPK (Thr172), and P-ACC (Ser79). The density value of each band was normalized to β-actin level and expressed relative to control (shown as fold induction).
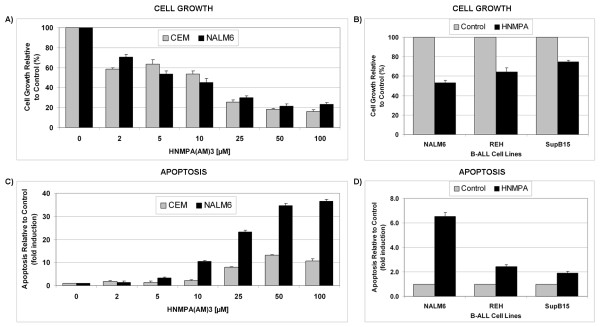
Figure 4
Inhibition of IGF-1R tyrosine kinase activity induces growth inhibition and apoptosis in ALL cell lines. Cell growth (A) and level of apoptosis (C) detected in ALL CCRF-CEM and NALM6 cells treated with the IGF-1R inhibitor HNMPA(AM)3 (2 - 100 μM) and incubated for 24 h at 37°C. Proliferation (B) and level of apoptosis (D) detected in Bp-ALL subtypes NALM6, REH (t[12;21]), and SupB15 (t[9;22]) treated with HNMPA(AM)3 (10 μM) and incubated for 24 h at 37°C. The cell growth (viability) values are expressed as a percentage relative to those obtained with untreated control cells (mean ± SEM, n = 3). Annexin V-FITC/PI staining data (apoptosis) were normalized and expressed as fold induction relative to control values (mean ± SEM, n = 3) as described in Methods.
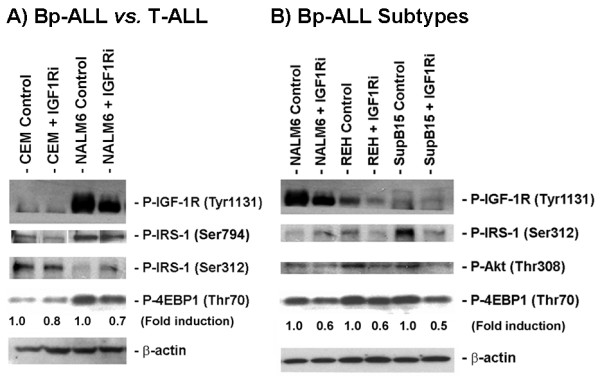
Figure 5
Expression level of IGF-1R and downstream regulated signaling factors in B-ALL vs. T-ALL cell lines. A) Western blot analysis of P-IGF-1R (Tyr1131), P-IRS-1 (Ser794 and Ser312), and P-4EBP1 (Thr70) expression in Bp-ALL (NALM6) and T-ALL cells (CCRF-CEM) treated with 0.1% DMSO (Control) or the IGF-1R inhibitor HNMPA(AM)3 (IGF1Ri, 10 μM) and incubated for 24 h. B) Basal expression level of P-IGF-1R (Tyr1131), P-IRS-1 (Ser312), P-Akt (Thr308), and P-4EBP1 (Thr70) in Bp-ALL NALM6 and subtypes characterized by non-random translocations (REH (t[12;21]), and SupB15 (t[9;22])). The levels of P-4EBP1 were normalized to β-actin (loading control) and expressed relative to control (shown as fold induction).
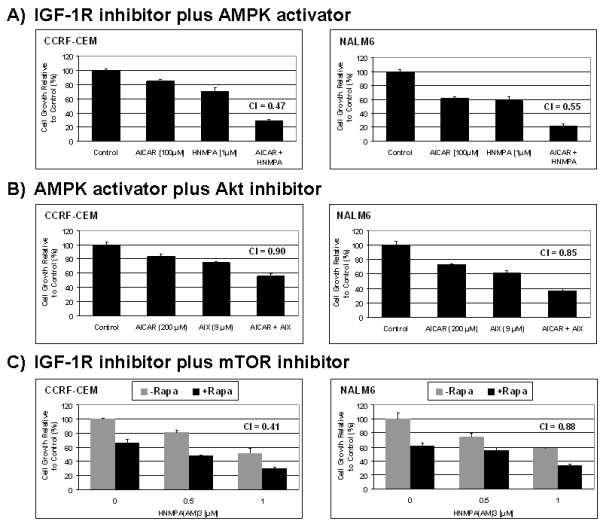
Figure 6
Simultaneous inhibition of IGF-1R with drug altering AMPK, mTOR, or Akt signaling pathway induces synergistic growth inhibition in ALL cell lines. Cell growth of ALL CCRF-CEM and NALM6 cells treated with either AICAR (100 μM) plus the IGF-1R inhibitor HNMPA(AM)3 (1.0 μM) (panel A); AICAR (200 μM) plus the Akt inhibitor-X (AIX, 9.0 μM) (panel B); or rapamycin (1.0 μg/ml) plus HNMPA(AM)3 (0.5 and 1.0 μM) (panel C). Cells were treated with either agent alone or in combination at the indicated doses and incubated for 24 h at 37°C. The cell growth values are expressed as a percentage relative to those obtained with control cells (mean ± SEM, n = 3). Combination index (CI) values were determined for each drug combination as described in Methods (CI <1 indicates synergism).
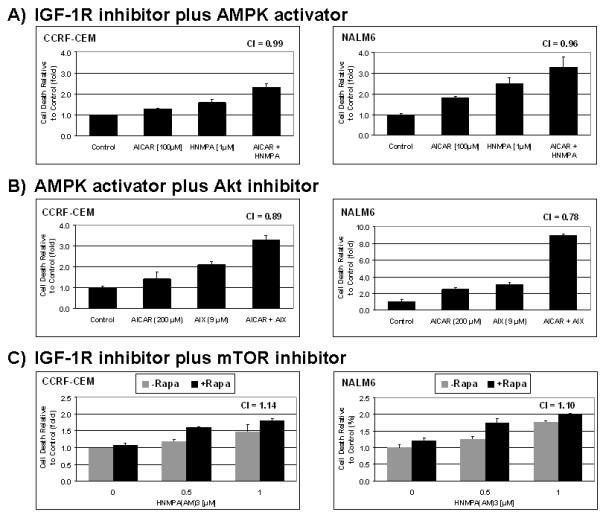
Figure 7
Co-targeting AMPK and Akt signaling pathway induces synergistic cell death in ALL cell lines. Cell death values obtained from the ALL CCRF-CEM and NALM6 cells shown in Fig. 6 which were treated with either AICAR (100 μM) plus the IGF-1R inhibitor HNMPA(AM)3 (1.0 μM) (panel A); AICAR (200 μM) plus the Akt inhibitor-X (AIX, 9.0 μM) (panel B); or rapamycin (1.0 μg/ml) plus HNMPA(AM)3 (0.5 and 1.0 μM) (panel C). The cell death values were generated from the trypan blue exclusion data and are expressed as a percentage relative to those obtained with control cells (mean ± SEM, n = 3). Combination index (CI) values were determined for each drug combination as described in Methods (C <1, = 1, and >1 indicate synergism, additive effect, and antagonism, respectively).