
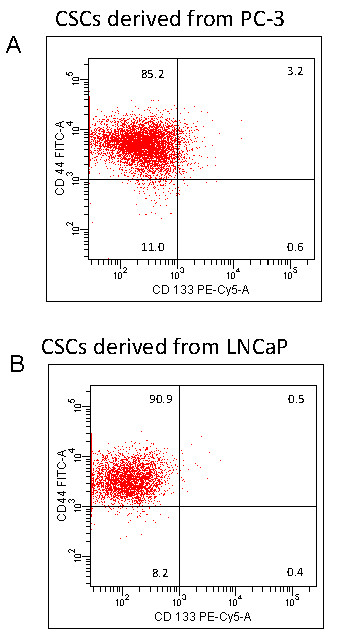
Figure 1
The presence of CSCs in PC-3 and LNCaP cells. (A), PC-3 cells were harvested, and stained with anti-CD44-FITC, anti-CD133-PE or isotype control antibody. The presence of CD44+ and CD133+ cells were examined by the flowcytometry. (B), LNCaP cells were harvested, and stained with anti-CD44-FITC, anti-CD133-PE or isotype control antibody. The presence of CD44+ and CD133+ cells were examined by the flowcytometry.
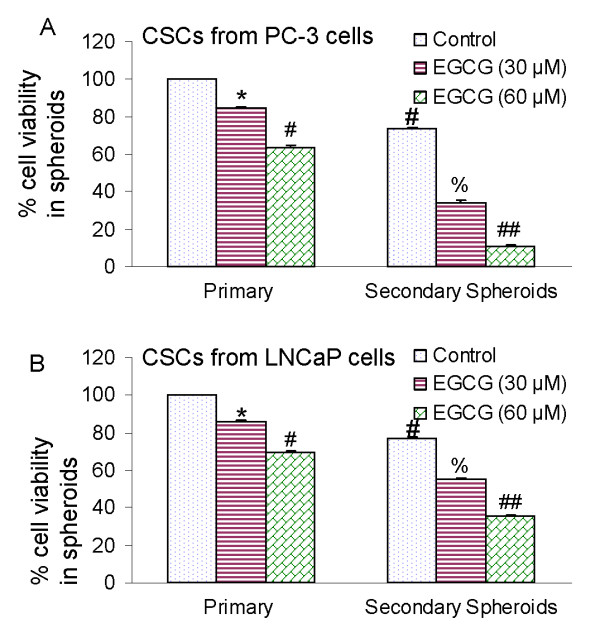
Figure 2
Effects of EGCG on spheroid cell viability in cancer stem cells (CSCs) derived from human prostate cancer cell lines. (A), The CSCs were enriched from PC-3 cells, and grown in suspension in keratinocyte serum-free medium supplemented with B27, 10 ng/ml EGF, and 10 ng/ml basic fibroblast growth factor (Invitrogen). Prostate CSCs were re-seeded in suspension and treated with EGCG (0-60 μM) for 7 days. The spheroids were dissociated with Accutase (Innovative Cell Technologies, Inc.), and sieved through a 40-μm filter. Cell viability was measured by trypan blue assay. For secondary sphere formation, CSCs were reseeded and treated with EGCG for 7 days. Data represent mean ± SD. *, #, % or ## = significantly different from control, P < 0.05. (B), Prostate cancer stem cells were isolated from LNCaP cells, seeded in suspension and treated with EGCG (0-60 μM) for 7 days. At the end of incubation period, sheroids were dissociated with Accutase (Innovative Cell Technologies, Inc.), and sieved through a 40-μm filter. Cell viability was measured by trypan blue assay. Data represent mean ± SD. *, #, % or ## = significantly different from control, P < 0.05.
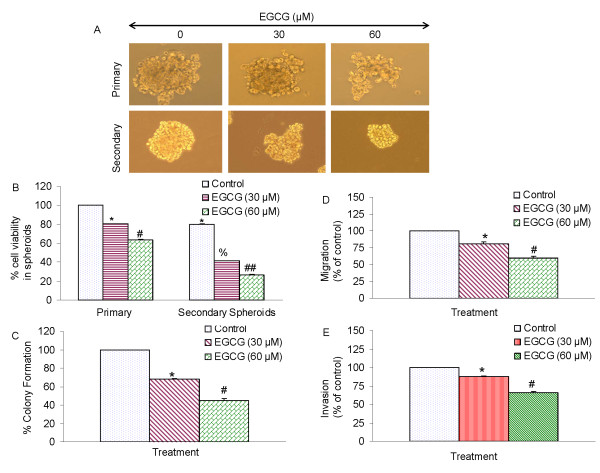
Figure 3
Effects of EGCG on tumor spheroids and cell viability of prostate cancer stem cells (CSCs). (A), Prostate CSCs were seeded in suspension and treated with EGCG (0-60 μM) for 7 days. Pictures of spheroids formed in suspension were taken by a microscope. (B), Prostate CSCs were seeded in suspension and treated with EGCG (0-60 μM) for 7 days. At the end of incubation period, all the spheroids were collected and resuspended. Cell viability was measured by trypan blue assay. Data represent mean ± SD. *, #, % or ## = significantly different from control, P < 0.05. (c), EGCG inhibits colony formation by prostate CSCs. Prostate CSCs were seeded in soft agar and treated with various doses of EGCG and incubated at 4°C for 21 days. At the end of incubation period, colonies were counted. Data represent mean ± SD. * or # = significantly different from respective controls, P < 0.05. (D), Transwell migration assay. Prostate CSCs were plated in the top chamber of the transwell and treated with EGCG (0-60 μM) for 24 h. Cells migrated to the lower chambered were fixed with methanol, stained with crystal violet and counted. Data represent mean ± SD. * or # = significantly different from respective controls, P < 0.05. (E) Matrigel invasion assay. Prostate CSCs were plated onto the Matrigel-coated membrane in the top chamber of the transwell and treated with EGCG (0-60 μM) for 48 h. Cells invaded to the lower chambered were fixed with methanol, stained with crystal violet and counted. Data represent mean ± SD. * or # = significantly different from respective controls, P < 0.05.
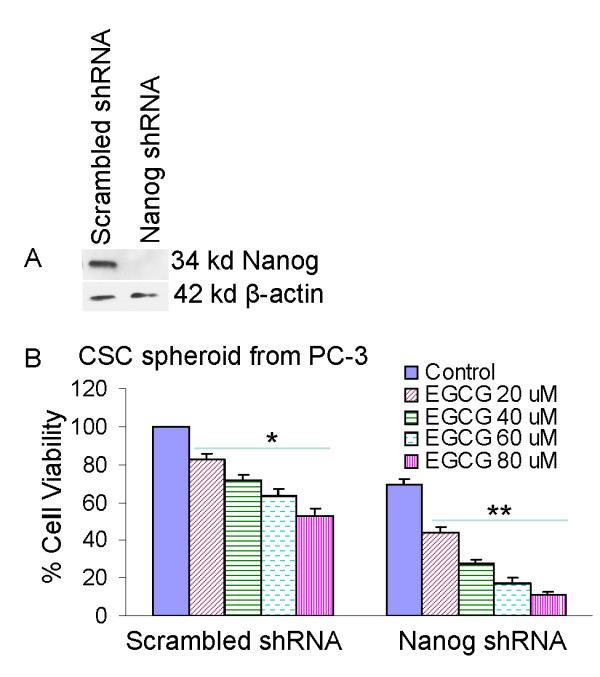
Figure 4
Inhibition of Nanog enhances the effects of EGCG on CSC spheroid formation. CD133+ and CD44+ CSCs were isolated from PC-3 cells and plated in six-well ultralow attached plates at a density of 1,000 cells/ml. (A), CSCs were transduced with either scrambled shRNA or Nanog shRNA expressing lentiviral vector (pLKO.1), and cell lysates were collected and western blot analysis was performed using anti-Nanog antibody. (B), CSC/scrambled and CSC/Nanog shRNA were seeded as described above and treated with EGCG (0-80 μM). After 7 days, spheroids were collected and cell suspentions were prepared and viable cells were counted by trypan blue assay. Data represent mean ± SD. * or ** = significantly different from control, P < 0.05.
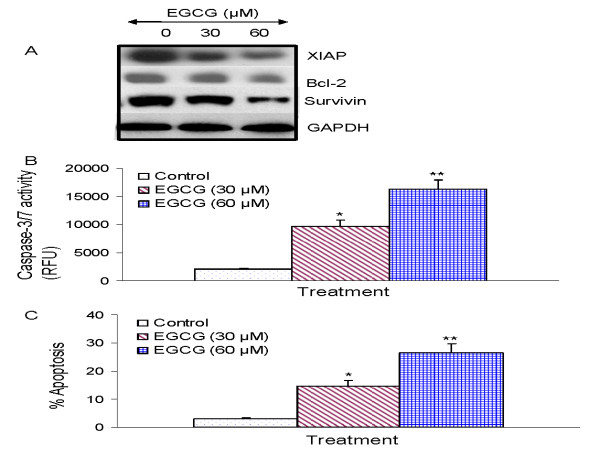
Figure 5
Regulation of apoptosis-related proteins, caspase-3/7 activity and apoptosis by EGCG on CSCs derived from human primary prostate tumors. (A), Regulation of apoptosis-related proteins. Prostate CSCs from primary tumors were treated with EGCG (0-60 μM) for 48 h. The Western blot analyses were performed to examine the expression of XIAP, Bcl-2 and survivin, and GAPDH. (B), Regulation of caspase-3/7 activity by EGCG. Prostate CSCs were treated with EGCG (0-60 μM) for 24 h, and caspase-3/7 activity was measured as per manufacturer's instructions. Data represent mean ± SD. * or ** = significantly different from control, P < 0.05. (C), Regulation of apoptosis by EGCG. Prostate CSCs were treated with EGCG (0-60 μM) for 48 h, and apoptosis was measured by TUNEL assay. Data represent mean ± SD. * or ** = significantly different from control, P < 0.05.
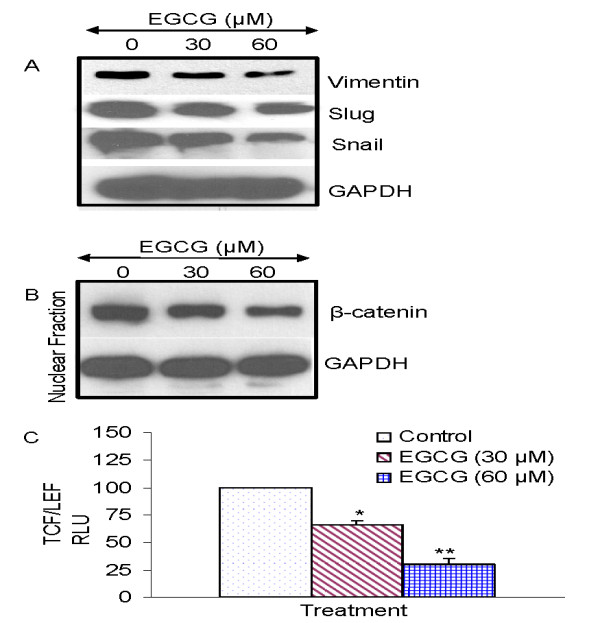
Figure 6
Regulation of epithelial mesenchymal transition factors by EGCG in prostate cancer stem cells isolated from primary tumors. (A), Prostate CSCs were treated with EGCG (0-60 μM) for 48 h. At the end of incubation period, the expression of vimentin, slug, and snail was measured by the Western blot analysis. (B), Effects of EGCG on the expression of nuclear β-catenin. Prostate CSCs were treated with EGCG (0-60 μM) for 48 h. At the end of incubation period, cells were harvested and nuclear fractions were prepared. The expression of β-catenin and GAPDH was measured by was measured by the Western blot analysis. (c), Effects of EGCG on TCF-1/LEF activity. Prostate CSCs were transduced with lentiviral Top-dGFP-reporter (pRLR.sm-18.ppt). Transduced CSCs were treated with EGCG (0-60) for 3 days and the GFP fluorescence was measured. Data represent mean ± SD. * or ** = significantly different from control, P < 0.05.
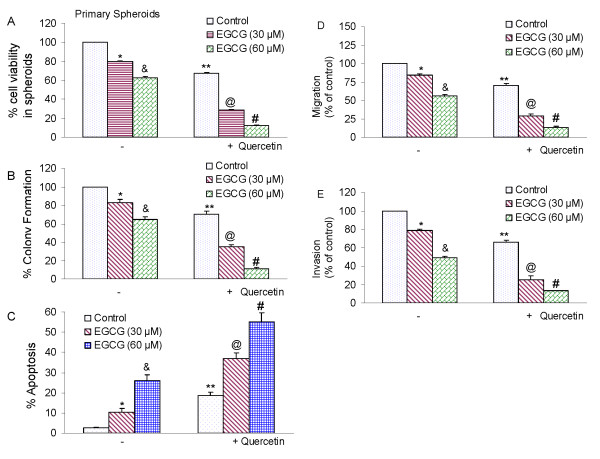
Figure 7
Quercetin synergizes with EGCG to inhibit self-renewal capacity of prostate cancer CSCs isolated from primary tumors. (A), Quercetin synergizes with EGCG to inhibit spheroid cell viability. Prostate CSCs were seeded in suspension and treated with EGCG (0-60 μM) with or without quercetin (20 μM) for 7 days. At the end of incubation period, all the spheroids were collected and resuspended. Cell viability was measured by trypan blue assay. Data represent mean ± SD. *, &, **, @ or # = significantly different from control, P < 0.05. (B), Quercetin synergizes with EGCG to inhibit colony formation. Prostate CSCs were seeded in soft agar and treated with various doses of EGCG (0-60 μM) with or without quercetin (20 μM) and incubated at 4°C for 21 days. At the end of incubation period, colonies were counted. Data represent mean ± SD. *, &, **, @ or # = significantly different from control, P < 0.05. (C), Quercetin synergizes with EGCG to induce apoptosis. Prostate CSCs were seeded in suspension and treated with EGCG (0-60 μM) with or without quercetin (20 μM) for 7 days. At the end of incubation period, all the spheroids were collected. Apoptosis was measured by TUNEL assay. Data represent mean ± SD. *, &, **, @ or # = significantly different from control, P < 0.05. (D), Migration assay. Prostate CSCs were plated in the top chamber of the transwell and treated with EGCG (0-60 μM) with or without quercetin (20 μM) for 24 h. Cells migrated to the lower chambered were fixed with methanol, stained with crystal violet and counted. Data represent mean ± SD. *, &, **, @ or # = significantly different from control, P < 0.05. (E) Matrigel invasion assay. Prostate CSCs were plated onto the Matrigel-coated membrane in the top chamber of the transwell and treated with EGCG (0-60 μM) with or without quercetin (20 μM) for 48 h. Cells invaded to the lower chambered were fixed with methanol, stained with crystal violet and counted. Data represent mean ± SD. *, &, **, @ or # = significantly different from control, P < 0.05.