
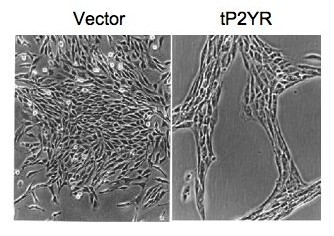
Figure 1
Expression of tP2YR in 1321N1 astrocytoma cells results in an altered cell morphology. 1321N1 cells were stably infected with expression constructs encoding either tP2YR or empty retrovirus vector as indicated (1000× magnification).
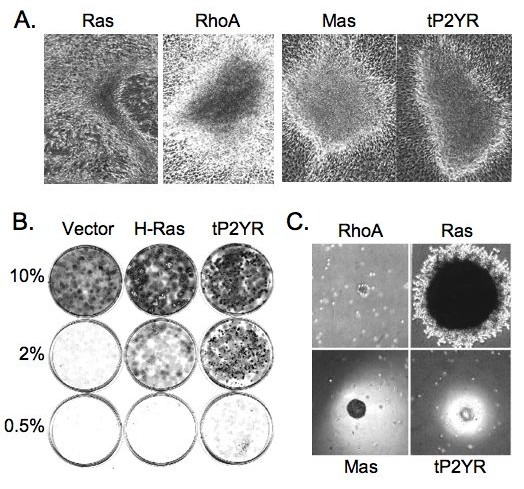
Figure 2
Expression of tP2YR causes tumorigenic transformation of NIH3T3 cells. A. Expression of tP2YR in NIH3T3 cells induces the formation of transformed foci. NIH3T3 cells were transfected with empty vector, H-Ras(61L) or RhoA(63L), the Mas Oncogene or tP2YR. The appearance of foci of transformed cells was evaluated 14 to 16 days after transfection (40× magnification). B. tP2YR-expressing NIH3T3 cells exhibit serum independent growth. NIH3T3 cells stably-transfected with the empty vector or encoding activated H-Ras(61L) or tP2YR were plated at a density of 103 cells per 60 mm dish in growth medium supplemented with 10% calf serum. After 24 hr, the growth medium was changed to media supplemented with 0.5%, 2% or 10% calf serum. The cultures were then maintained for 2 weeks and stained with 4% crystal violet to better visualize the cells. C. tP2YR-expressing NIH3T3 cells show anchorage-independent growth. NIH3T3 cells stably-transfected with pZIP-NeoSV(x)1 retrovirus vectors encoding the indicated proteins were plated in soft agar at a density of 103 [for Ras(61L)] or 104 [for RhoA(63L), Mas and tP2YR)] cells per 60 mm dish. The appearance of colonies of proliferating cells was evaluated after 3 weeks (40× magnification).
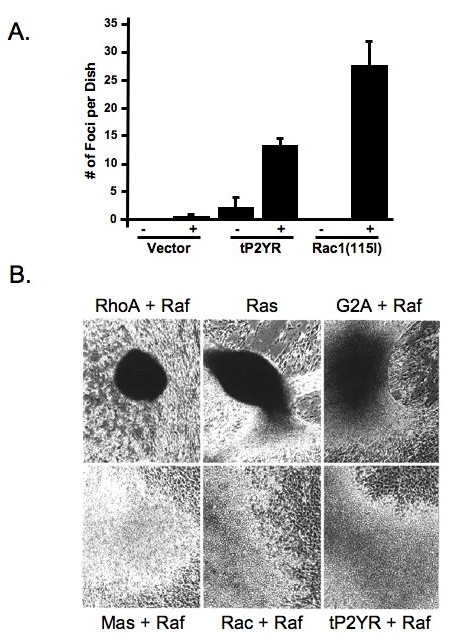
Figure 3
tP2yR synergizes with activated Raf1 to induce foci with similar characteristics to activated Rac1. A. Quantitation of the number of foci induced when tP2YR or activated Rac1(115I) were co-transfected with activated Raf-1(340D). NIH3T3 cells were co-transfected with 1 μg of pZIP-NeoSV(x)1 retrovirus expression plasmids encoding tP2YR or Rac1(115I) and either 1 μg of the empty pZIP-NeoSV(x)1 plasmid DNA (-) or encoding the weakly activated Raf-1(340D) mutant (+). The appearance of foci of transformed cells was quantitated after 14 days. Data shown are the mean ± standard error for triplicate plates and are representative of three independent assays. B. The appearance of transformed foci induced in NIH3T3 cells were co-transfected with activated Raf-1(340D) is similar to those induced by activated Rac(115I) and distinct from those induced by activated Rho(63L). pZIP-NeoSV(x)1 expression vectors encoding RhoA(63L), G2A, Mas, Rac1(115I) or tP2YR were co-transfected with pZIP-raf-1(340D). pZIP-H-ras(61L) was co-transfected with the empty pZIP-NeoSV(x)1 plasmid DNA. The appearance of foci of transformed cells was monitored 14 days after transfection (40× magnification).
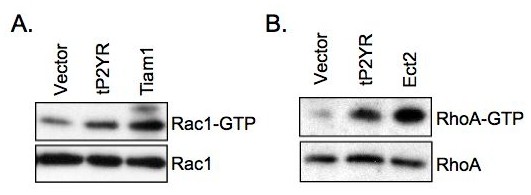
Figure 4
Expression of tP2YR results in lamellipodia formation and activation of both Rac1 and RhoA. NIH3T3 cells were transiently transfected with either empty pcDNA3 expression vector or those encoding tP2YR, Tiam1-C1199 (A, potent activator of Rac1) or Ect2-DH/PH/C (B, potent activator of RhoA). Activated GTP-bound Rac1 and RhoA were isolated in pull-down assays with GST-Pak-PBD and GST-Rhotekin-RBD, respectively.
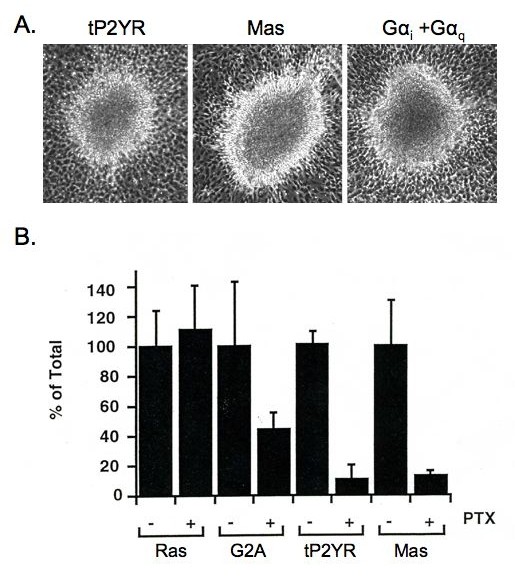
Figure 5
Transformation of NIH3T3 cells by tP2YR is caused by coordinated activation of Gαi and Gαq. A. Gαi and Gαq cooperate and cause the appearance of transformed foci similar to those caused by tP2YR. NIH3T3 cells were transfected with pZIP-NeoSV(x)1 expression vectors encoding tP2YR or Mas, or co-transfected with vectors encoding constitutively activated mutants of GαI2(QL) and Gαq(QL). The appearance of foci of transformed cells was monitored 3 weeks after transfection (40× magnification). B. Transformation by tP2YR and Mas requires Gαi protein function. NIH3T3 cells were transfected with pZIP-NeoSV(X)1 expression vectors encoding H-Ras(61L) (25 ng per 60 mm dish), G2A (2 μg per dish), tP2YR (2 μg per dish) or Mas (1 μg per dish). Cultures were then maintained in growth medium (-) or medium supplemented with 100 ng per ml PTX (+) for 14 to 16 days after which the number of foci were quantitated. Data shown are expressed as the mean of the percent of the total number of foci in the untreated dishes ± standard error and are representative of two separate assays performed in triplicate.