
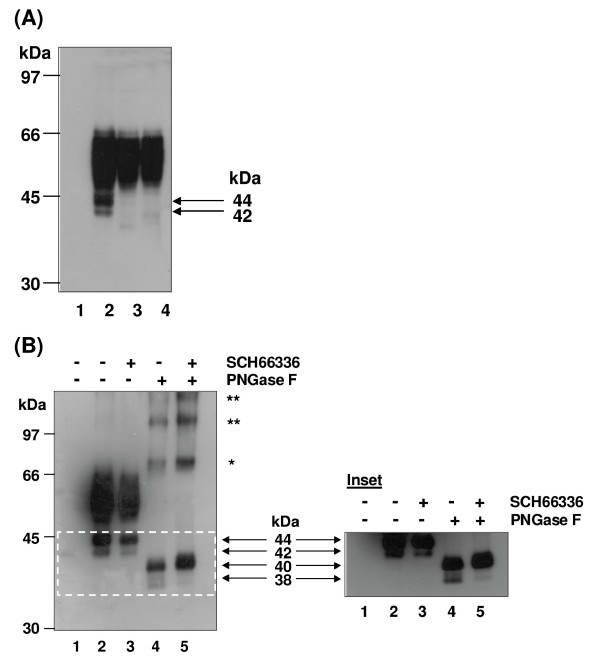
Figure 1
Identification of the molecular species of the hIP expressed in HEK.hIP cells. A, western blot analysis of whole cell protein (50 μg) from HEK 293 cells (lane 1) or HEK.hIP cells (lanes 2-4) incubated with vehicle (0.001% DMSO, lanes 1, 2 & 4) or tunicamycin (2 μg/ml, lane 3) for 24 hr. Whole cell protein (50 μg) was treated with endoglycosidase H (Endo H, 200 units/50 μg protein; lane 4). B, HEK 293 cells (lane 1) or HEK.hIP cells (lanes 2-5) were incubated in the absence (-) or presence (+) of SCH66336 (5 nM) for 24 hr prior to harvesting. Where indicated, whole cell protein (50 μg) was treated with PNGase F (500 units/50 μg protein, lanes 4 & 5). A &B, reactions were stopped by the addition of SDS-sample Buffer and proteins were resolved by SDS-PAGE, electroblotted onto PVDF membrane and screened with the anti-HA (3F10) antibody. B, Inset, the region highlighted by the dashed-line box in B is shown following long-term chemiluminescence exposure. The arrows between the panel and inset highlight the apparent molecular weights (MW) of the core glycosylated, non-farnesylated (44 kDa); core glycosylated, farnesylated (42 kDa); non-glycosylated, non-farnesylated (40 kDa); and non-glycosylated, farnesylated (38 kDa) species of the hIP, respectively. The variably glycosylated mature hIP has an apparent MW of ~46-66 kDa. The higher MW species detected in panel B, lanes 4 & 5 may represent dimeric (*) and oligomeric (**) forms of the hIP. The positions of the molecular size markers (kDa) are indicated to the left of the panels. Data are representative of three independent experiments.
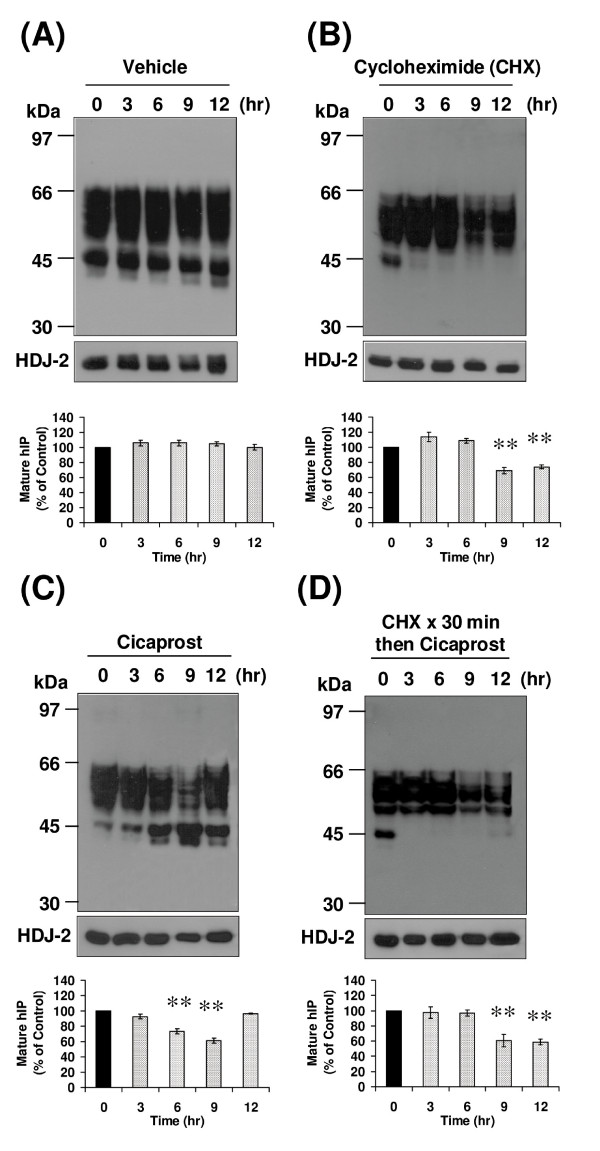
Figure 2
Investigation of basal and agonist-induced turnover of the hIP. HEK.hIP cells were incubated with (A) vehicle (0.001% DMSO), (B) cycloheximide (CHX, 20 μg/ml) or (C) cicaprost (1 μM) for 0-12 hr. Additionally, cells were (D) pretreated with CHX (20 μg/ml) for 30 min prior to incubation with cicaprost (1 μM) for 0-12 hr. Whole cell protein (50 μg) was resolved by SDS-PAGE, electroblotted onto PVDF membrane and screened with the anti-HA (3F10) antibody (A - D, upper panels). Membranes were stripped and reprobed with the anti-HDJ-2 antibody (A - D, lower panels). The positions of the molecular size markers (kDa) are indicated to the left of the panels. Data are representative of three to six independent experiments. The bar charts show the mean percentage increase or decrease in levels of the mature (46-66 kDa) species of the hIP ± S.E.M. (n = 3-6) where the level of the mature hIP in untreated (0 hr) cells is assigned a value of 100%. **, p < 0.01 indicates that the mean percentage levels of the mature hIP was significantly reduced following the respective treatment(s) compared to those levels in untreated (0 hr) cells at that time point.
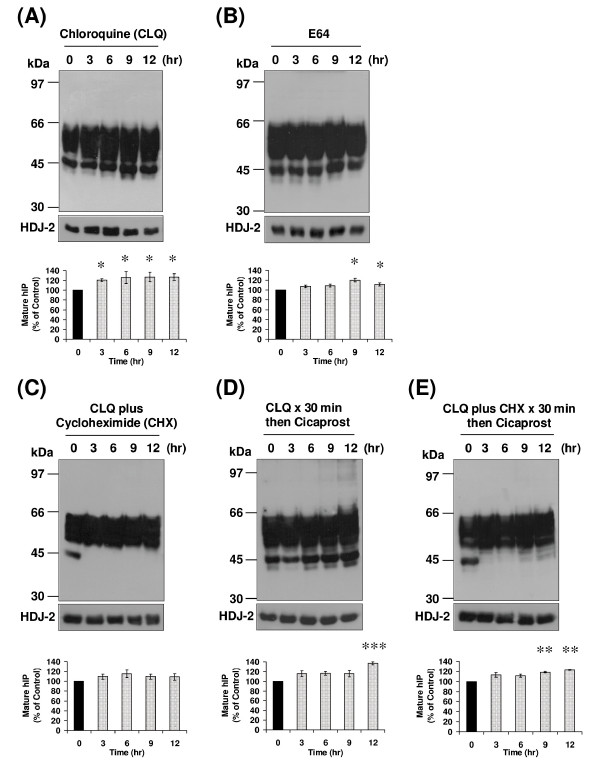
Figure 3
Effect of lysosomal inhibition on basal and agonist-induced turnover of the hIP. HEK.hIP cells were incubated with (A) chloroquine (CLQ, 100 μM), (B) E64 (20 μM) or (C) CLQ (100 μM) plus cycloheximide (CHX, 20 μg/ml) for 0 - 12 hr. Alternatively, cells were pretreated with either (D) CLQ for 30 min or (E) CLQ plus CHX for 30 min prior to incubation with cicaprost (1 μM) for 0-12 hr. A - E, whole cell protein (50 μg) was resolved by SDS-PAGE, electroblotted onto PVDF membrane and screened with the anti-HA (3F10) antibody (upper panels). Membranes were stripped and reprobed with the anti-HDJ-2 antibody (A - E, lower panels). The positions of the molecular size markers (kDa) are indicated to the left of A - E. Data are representative of three to five independent experiments. The bar charts show the mean percentage increase or decrease in levels of the mature (46-66 kDa) species of the hIP ± S.E.M. (n = 3 - 5) where the level of the mature hIP in untreated (0 hr) cells is assigned a value of 100%. *, p < 0.05, **, p < 0.01 and ***, p < 0.001 indicates that the mean percentage levels of the mature hIP was significantly increased following the respective treatment(s) compared to those levels in untreated (0 hr) cells at that time point.
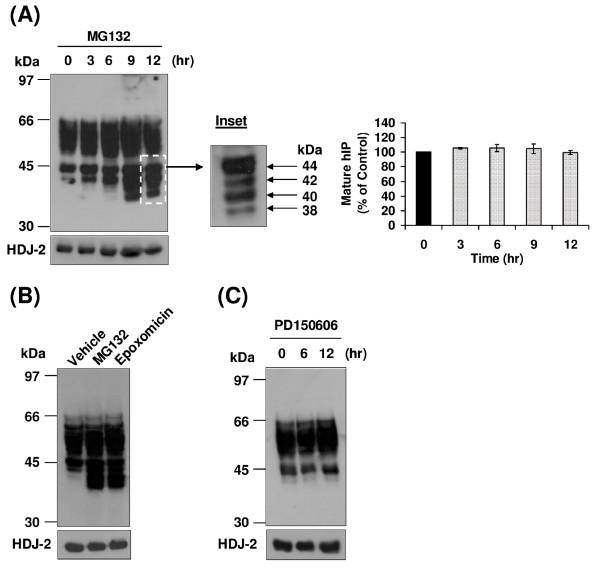
Figure 4
Effect of proteasomal inhibition on the hIP expressed in HEK.hIP cells. A, HEK.hIP cells were incubated with MG132 (10 μM) for 0-12 hr. Whole cell protein (50 μg) was resolved by SDS-PAGE, electroblotted onto PVDF membrane and screened with the anti-HA (3F10) antibody (upper panel). Inset, the region highlighted by the dashed-line box in A is shown following short-term chemiluminescence exposure where the arrows to the right of the Inset indicate the presence of the four predominant bands that accumulate in HEK.hIP cells following proteasomal inhibition with MG132. These bands correspond to the core glycosylated, non-farnesylated (44 kDa); core glycosylated, farnesylated (42 kDa); non-glycosylated, non-farnesylated (40 kDa); and non-glycosylated, farnesylated (38 kDa) species of the hIP, respectively. Alternatively, HEK.hIP cells were incubated with (B) MG132 (10 μM) or epoxomicin (0.1 μM) for 12 hr or (C) PD150606 (20 μM) for 0, 6 or 12 hr. B &C, whole cell protein (50 μg) was resolved by SDS-PAGE, electroblotted onto PVDF membrane and screened with the anti-HA (3F10) antibody (upper panels). In all cases, membranes were stripped and reprobed with the anti-HDJ-2 antibody (A - C, lower panels). The positions of the molecular size markers (kDa) are indicated to the left of A - C. Data are representative of three to five independent experiments. The bar chart to the right of A shows the mean percentage increase or decrease in levels of the mature (46-66 kDa) species of the hIP ± S.E.M. (n = 5) where the level of the mature hIP in untreated (0 hr) cells is assigned a value of 100%.
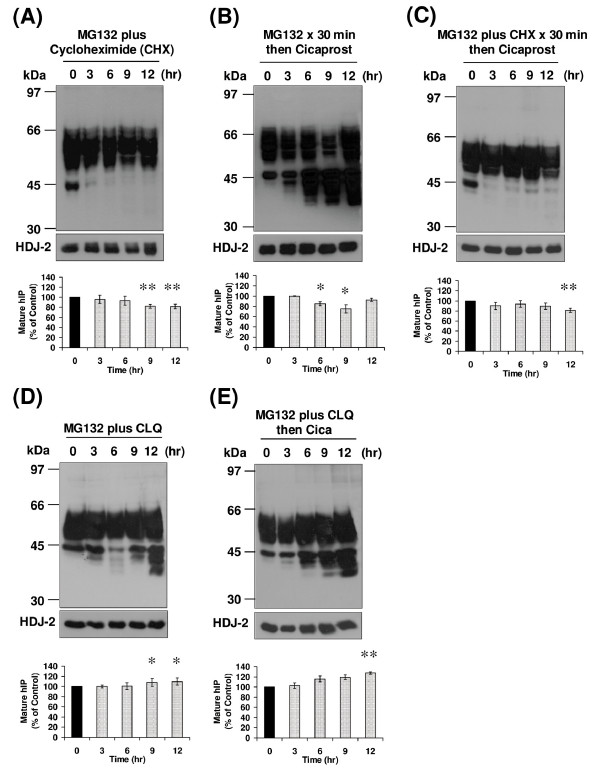
Figure 5
The effect of proteasomal and lysosomal inhibitors on basal and agonist-induced turnover of the hIP. HEK.hIP cells were incubated with (A) MG132 (10 μM) plus cycloheximide (CHX, 20 μg/ml), (B) MG132 (10 μM) for 30 min prior to incubation with cicaprost (1 μM), (C) MG132 (10 μM) plus CHX (20 μg/ml) for 30 min prior to incubation with cicaprost (1 μM), (D) MG132 (10 μM) plus CLQ (100 μM) or (E) MG132 (10 μM) plus CLQ (100 μM) for 30 min prior to incubation with cicaprost (1 μM) for 0-12 hr. A - E, whole cell protein (50 μg) was resolved by SDS-PAGE, electroblotted onto PVDF membrane and screened with the anti-HA (3F10) antibody (upper panels). In all cases, membranes were stripped and reprobed with the anti-HDJ-2 antibody (A - E, lower panels). The positions of the molecular size markers (kDa) are indicated to the left of A - E. Data are representative of three to five independent experiments. The bar charts show the mean percentage increase or decrease in levels of the mature (46-66 kDa) species of the hIP ± S.E.M. (n = 3-5) where the level of the mature hIP in untreated (0 hr) cells is assigned a value of 100%. *, p < 0.05 and **, p < 0.01 indicates that the mean percentage levels of the mature hIP was significantly increased or decreased following the respective treatment(s) compared to those levels in untreated (0 hr) cells at that time point.
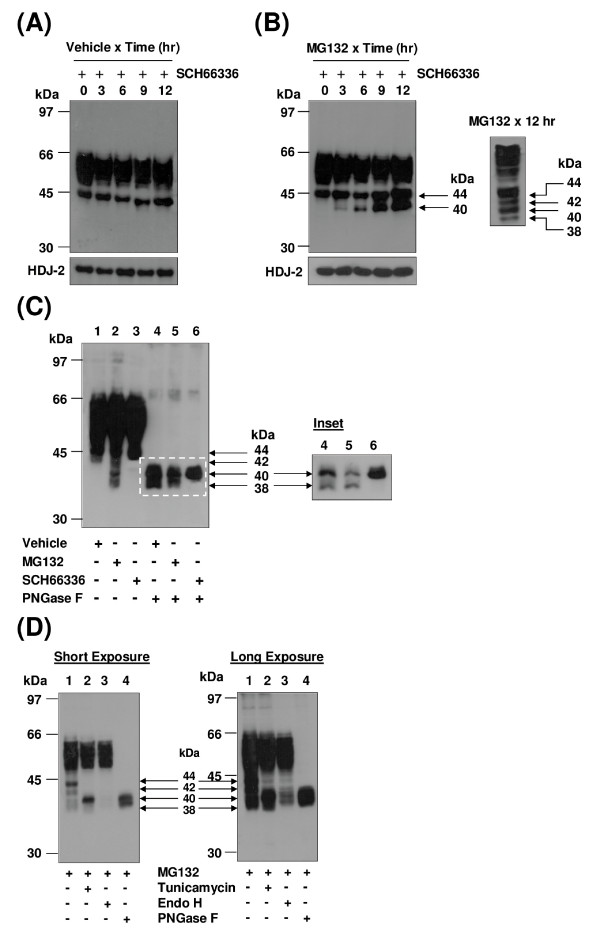
Figure 6
Clarification of the molecular species of the hIP expressed in HEK.hIP cells. A &B, HEK.hIP cells were treated with SCH66336 (5 nM) for 24 hr and then incubated with (A) vehicle (0.001% DMSO) or (B) MG132 (10 μM) for 0-12 hr prior to harvesting. As a control, HEK.hIP cells were treated with MG132 (10 μM) for 12 hr in the absence of SCH66336 (panel to the right of B). Whole cell protein (50 μg) was resolved by SDS-PAGE, electroblotted onto PVDF membrane and screened with the anti-HA (3F10) antibody. Membranes were then stripped and reprobed with the anti-HDJ-2 antibody (lower panels). C, HEK.hIP cells were incubated with vehicle (0.001% DMSO, lanes 1 & 4), MG132 (10 μM, lanes 2 & 5) or SCH66336 (5 nM, lanes 3 & 6) for 12 hr prior to harvesting. Where indicated, whole cell protein (50 μg) was treated with PNGase F (500 units/50 μg protein; lanes 4-6). Inset, the region highlighted by the dashed line box in C is shown following short-term chemiluminescence exposure. D, HEK.hIP cells were pretreated with MG132 (10 μM, lanes 1, 3 & 4) or 10 μM MG132 plus 2 μg/ml tunicamycin (lane 2) for 12 hr prior to harvesting. Thereafter, where indicated, whole cell protein (50 μg) was treated with endoglycosidase H (endo H, 200 units/50 μg protein; lane 3) or PNGase F (500 units/50 μg protein, lane 4), where both short- and long-term exposures are shown. Panels B - D, the respective arrows indicate the presence or absence of the core glycosylated, non-farnesylated (44 kDa); core glycosylated, farnesylated (42 kDa); non-glycosylated, non-farnesylated (40 kDa); and non-glycosylated, farnesylated (38 kDa) species of the hIP detected following the various treatments. The positions of the molecular size markers (kDa) are indicated to the left of the panels. Data are representative of three independent experiments.
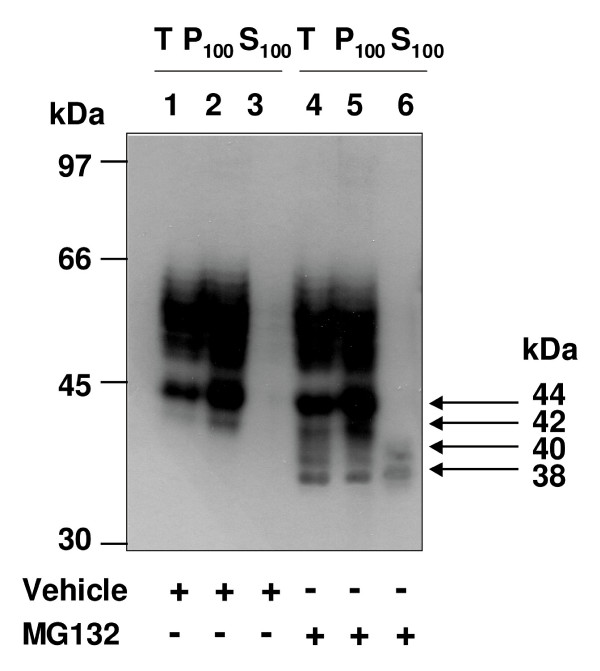
Figure 7
Subcellular localisation of the hIP in the presence of MG132. HEK.hIP cells were pretreated in the presence (+) or absence (-) of vehicle (0.001% DMSO, lanes 1-3) or MG132 (10 μM, lanes 4-6) for 12 hr. Aliquots of total (T; 50 μg), membrane (P100; 37.5 μg) and soluble (S100; 25 μg) fractions were resolved by SDS-PAGE, electroblotted onto PVDF membrane and screened with the anti-HA (3F10) antibody. The arrows at the right of the panel indicate the core glycosylated, non-farnesylated (44 kDa); core glycosylated, farnesylated (42 kDa); non-glycosylated, non-farnesylated (40 kDa); and non-glycosylated, farnesylated (38 kDa) species of the hIP, respectively, that accumulate following the various treatments. The positions of the molecular size markers (kDa) are indicated to the left of the panel. Data are representative of three independent experiments.
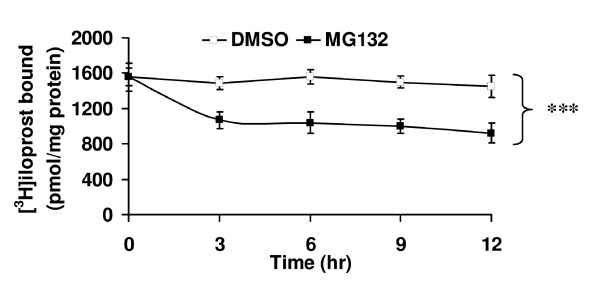
Figure 8
Effect of MG132 on radioligand binding by the hIP. HEK.hIP cells were pretreated with DMSO (0.001%) or MG132 (10 μM) for 0-12 hr, with untreated cells serving as the reference. Cells were harvested and radioligand-binding assays were then performed on crude membrane (P100) fractions in the presence of 4 nM [3H]iloprost at 30°C, as outlined in Experimental Procedures. The data are presented as the mean [3H]iloprost bound (pmol/mg protein ± S.E.M., n = 4). For untreated cells (0 hr), the actual value for mean [3H]iloprost bound (pmol/mg protein ± S.E.M.) was 1.55 ± 0.10 pmol/mg protein. ***, p < 0.0001 indicates that the mean [3H]iloprost bound (pmol/mg protein) ± S.E.M. was significantly reduced in the presence of MG132 compared to DMSO at each time point.
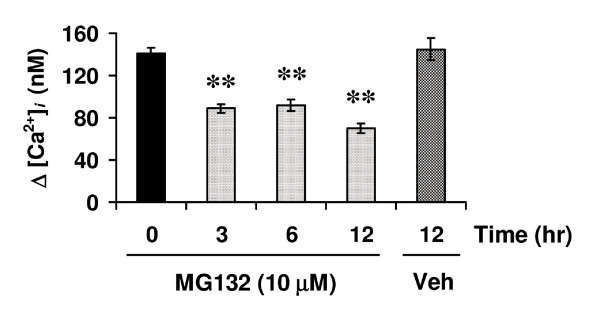
Figure 9
Effect of MG132 on intracellular calcium ([Ca2+]i) mobilisation by the hIP. HEK.hIP cells were pretreated with MG132 (10 μM) for 3 hr, 6 hr or 12 hr prior to harvesting, where untreated (0 hr) or vehicle-treated (0.001% DMSO, 12 hr) cells served as controls. Cells were preloaded with Fura2/AM and stimulated with 1 μM cicaprost. In all cases, mean maximal changes in intracellular calcium mobilised (Δ[Ca2+]i (nM) ± S.E.M.) were determined from at least four independent experiments. Actual mean Δ[Ca2+]i ± S.E.M. were: 0 hr, 141.2 ± 5.76 nM; vehicle, 12 hr, 145.0 ± 10.3 nM; MG132, 3 hr, 89.0 ± 4.11 nM; MG132, 6 hr, 91.8 ± 5.8 nM; and MG132, 12 hr, 70.4 ± 4.48 nM. Typically, actual baseline [Ca2+] levels in HEK.hIP cells were 10-15 nM. In all cases, mean maximal changes in intracellular calcium mobilised (Δ[Ca2+]i (nM) ± S.E.M.) were determined from at least four independent experiments. **, p < 0.01 indicates that the mean Δ[Ca2+]i was significantly reduced in the presence of MG132 compared to those levels in untreated cells at the specified time points (3, 6 & 12 hr).
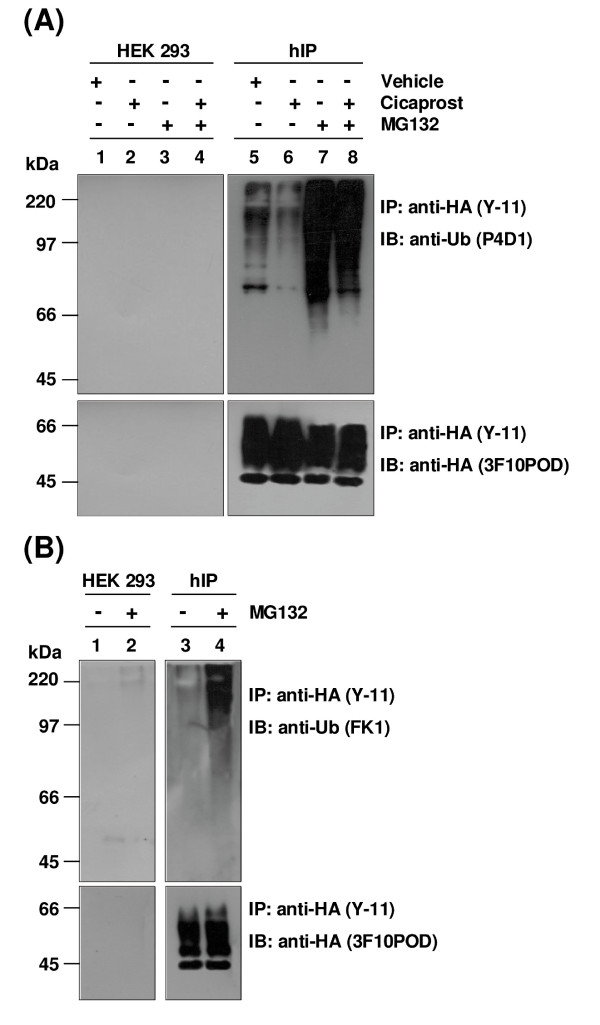
Figure 10
Immunodetection of ubiquitination of the hIP. A, HEK 293 (lanes 1-4) and HEK.hIP (hIP, lanes 5-8) cells were incubated in the presence (+) or absence (-) of vehicle (0.001% DMSO), cicaprost (1 μM) or MG132 (10 μM) for 4 hr. Additionally, cells were pretreated with MG132 (10 μM) for 30 min prior to incubation with cicaprost (1 μM) for 4 hr. B, HEK 293 (lanes 1 & 2) and HEK.hIP (hIP, lanes 3 & 4) cells were incubated in the presence (+) or absence (-) of MG132 (10 μM) for 4 hr. A &B, thereafter, cells were harvested, lysed in Radio-immunoprecipitation (RIP) Buffer and HA-tagged hIPs were immunoprecipitated (IP) using the anti-HA antibody (IP: anti-HA (Y-11)), as described under Experimental Procedures. Immunoprecipitates were resolved by SDS-PAGE, followed by electroblotting to PVDF membrane. In each case, membranes were initially immunoblotted (IB) with the anti-HA peroxidase-conjugated antibody (IB: anti-HA (3F10POD), lower panels) to detect the HA-tagged hIP. A, membranes were rescreened with the anti-ubiquitin monoclonal antibody (IB: anti-Ub (P4D1), upper panel), which recognises both mono- and polyubiquitinated proteins. B, membranes were rescreened with the anti-ubiquitin monoclonal antibody (IB: anti-Ub (FK1), upper panel), which recognises polyubiquitinated proteins only. The positions of the molecular size markers (kDa) are indicated to the left of A &B. Data are representative of three independent experiments.
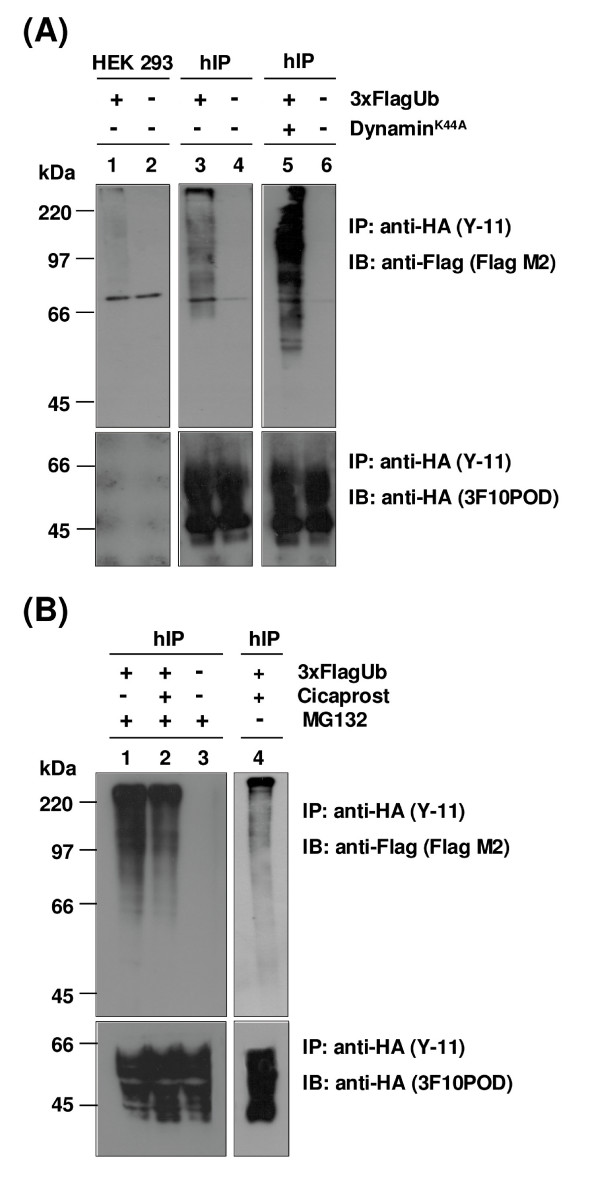
Figure 11
Ubiquitination of the hIP. A, HEK 293 (lanes 1 & 2) and HEK.hIP (hIP, lanes 3-6) cells were transiently transfected with pCMV5:3xFlag Ubiquitin (3xFlagUb), pcDNA3:HADynaminK44A (DynaminK44A) or, as controls, with the empty vectors pCMV5 or pcDNA3. B, HEK.hIP (hIP) cells were transiently transfected with pCMV5:3xFlag Ubiquitin (3xFlagUb) or, as control, with pCMV5 empty vector. Some 44 hr later, cells were treated with MG132 (10 μM) for 4 hr (lanes 1 & 3). Additionally, cells were pretreated with MG132 (10 μM) for 30 min prior to incubation with cicaprost (1 μM) for 4 hr (lane 2). As a control, cells were treated with cicaprost (1 μM) for 4 hr in the absence of MG132 (lane 4). A &B, thereafter, cells were harvested, lysed in Radio-immunoprecipitation (RIP) Buffer and HA-tagged hIPs were immunoprecipitated (IP) with the anti-HA antibody (IP: anti-HA (Y-11)). Immunoprecipitates were resolved by SDS-PAGE, followed by electroblotting to PVDF membrane. A &B, membranes were initially immunoblotted (IB) with the anti-HA peroxidase-conjugated antibody (IB: anti-HA (3F10POD), lower panels) to detect the HA-tagged hIP and were rescreened with the anti-Flag monoclonal antibody (IB: anti-Flag (Flag M2), upper panel) to detect Flag-tagged ubiquitinated species. The positions of the molecular size markers (kDa) are indicated to the left of A &B. Data are representative of three independent experiments.
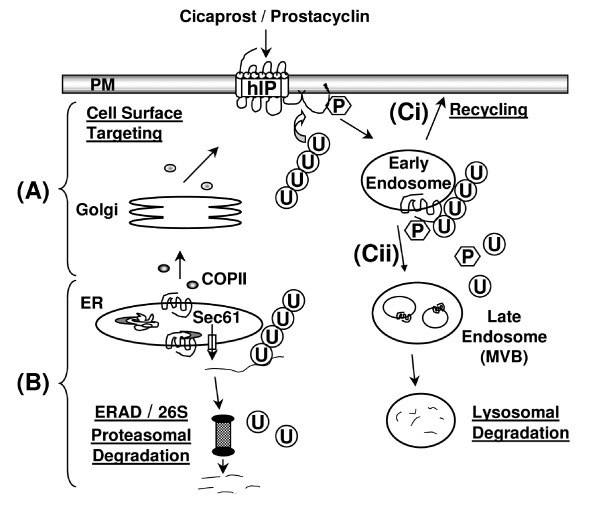
Figure 12
Proposed model of the mechanisms mediating degradation of the hIP. (A), synthesis of the hIP begins in the rough ER. The hIP is then subject to co-and post-translational modifications, such as N-linked glycosylation and disulphide bond formation which, along with interaction with essential molecular chaperones, assist it to fold into its native conformation. Correctly folded receptors transit via ER exit sites and are subsequently transported in coatomer protein (COP)II vesicles to the Golgi complex. Further post-translational modification of the hIP may occur in the Golgi complex before the fully mature hIP is targeted to the plasma membrane. P indicates that the hIP may be phosphorylated. (B), terminally misfolded hIPs may, however, be retrotranslocated to the cytosol, possibly through the Sec61 channel. Once the polypeptide chain is accessible in the cytosol, the hIP is polyubiquitinated and, following release from the ER membrane, is degraded by the 26S proteasomes through the ER-associated degradation (ERAD) system. (C), following agonist-induced activation, the mature hIP is internalised into early Rab5a positive-endosomes. From there, it may be (i) recycled to the plasma membrane or (ii) polyubiquitinated which targets it to the late endosomes/multi-vesicular bodies (MVBs) and, thereafter, to the lysosomes for degradation.