
Table 1
PCR Primers
| Transcript | Forward | Reverse | Size |
| RCAN1 All | 5'GGACATCACCTTTCAGTATT3' | 5'TTCCTCTTCTTCCTCCTTCT3' | 394 bp |
| RCAN1-1 | 5'ACCATCGCCTGTCACCTGGA3' | 5'GGTGATGTCCTTGTCATACGTCCT3' | 96 bp |
| RCAN1-4 | 5'CTCCCTGATTGCCTGTGTGG3' | 5'TTCCTCTTCTTCCTCCTTCT3' | 484 bp |
| β actin | 5'TCATGAAGTGTGACGTTGACATCCGT3' | 5'CTTAGAAGCATTTGCGGTGCACGATG3' | 285 bp |
RCAN1 All = total RCAN1. Forward primers for RCAN1 All, RCAN1-1 and RCAN1-4 correspond to exons 5, 1 and 4 respectively. A common reverse primer for RCAN1 All and RCAN1-4 corresponds to exon 7, while the reverse primer for RCAN1-1 corresponds to exon 5.
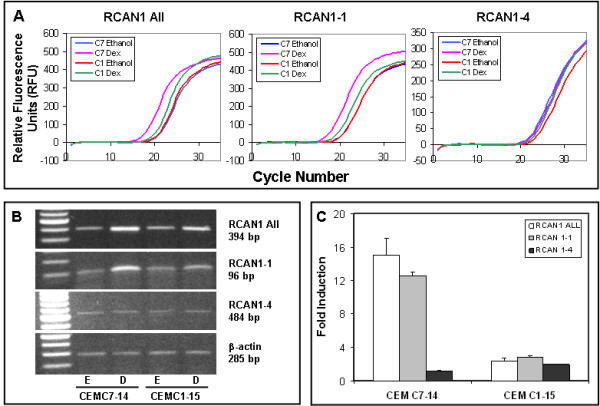
Figure 1
GCs selectively upregulate RCAN1-1 specific transcript: Total RNA extracted from cells treated with 100 nM Dex (D) or 0.15 ethanol (E) was subjected to reverse transcription reaction and analyzed by Real-time Q-PCR using primers specified in Table 1. Panel A: Raw amplification profiles of each RCAN1 specific transcript. Panel B: Gel electrophoresis of Real-time Q-PCR products after 18-22 cycles. Panel C: Relative expression of each transcript was calculated using the Pfaffl method using β-actin as a reference.
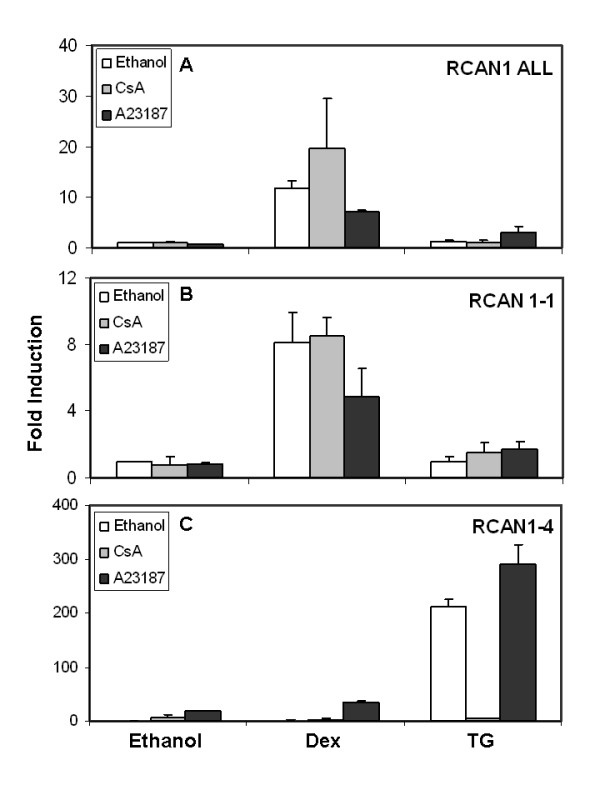
Figure 2
Regulation of RCAN1-1 and RCAN1-4 expression by calcium signaling: CEM-C7-14 cells were treated for 24 h with either ethanol vehicle, Dex or 500 nM thapsigargin (TG) in the presence or absence of the calcineurin inhibitor cyclosporin A (CsA, 600 nM) or the calcium ionophore A23187 (150 nM). RT-QPCR analysis was performed as in Figure 1 for total RCAN1 (RCAN1 All, Panel A), RCAN1-1 (Panel B) and RCAN1-4 (Panel C) using primers specified in Table 1. Data were normalized using β-actin as a reference, and fold induction was calculated using the Pfaffl method (28). Data presented are averages of 2-4 independent experiments.
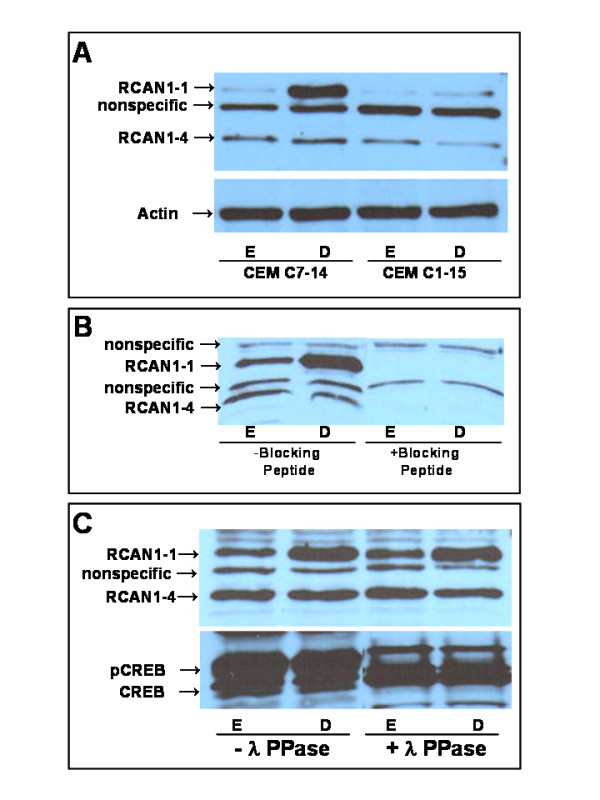
Figure 3
GCs induce RCAN1-1 protein levels in CEM-C7-14 Cells: Panel A: CEM-C7-14 and CEM-C1-15 cells were treated with ethanol vehicle (E) or 100 nM Dex (D) for 24 h. Western blotting was performed on 50 μg protein extracts using RCAN1 antibody (Abgent # AP6315c), or β-actin specific antibody (Santa Cruz # sc-8432). Panel B: Lysates prepared from ethanol (E) or Dex (D) treated CEM-C7-14 cells were subjected to Western blotting as in Panel A, but the antibody was preincubated for 1 h with or without blocking peptide (Abgent # BP6315c). Panel C: Lysates prepared from CEM-C7-14 cells treated with ethanol vehicle (E) or 100 nM Dex (D) for 24 h were treated with lambda buffer alone or lambda phosphatase for 20 min prior to Western blotting with either RCAN1 antibody as in Panel A, or CREB antibody (Santa Cruz #sc-186) to detect phosphorylation state.
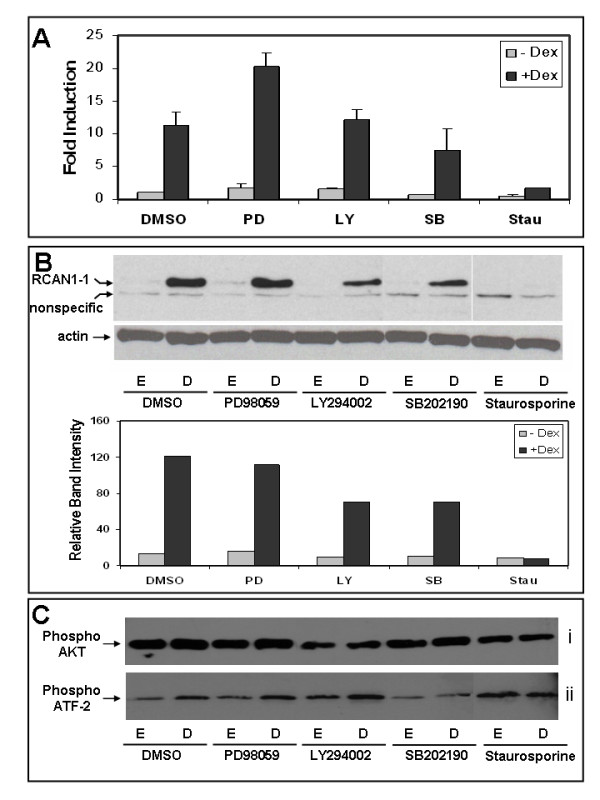
Figure 4
GCs induce RCAN1-1 transcript and protein levels in CEM-C7-14 Cells in a kinase-dependent fashion: Panel A: CEM-C7-14 cells were treated for 24 h with the indicated kinase inhibitors in the presence of ethanol (E) or 100 nM Dex (D), total RNA was extracted, and analyzed by reverse transcription-Real-time Q-PCR using primers specific for RCAN1-1. Relative transcript expression in various conditions was calculated by the Pfaffl method using β-actin as a reference. Panel B: CEM-C7-14 cells were treated with the indicated kinase inhibitors in the presence of either ethanol (E) or 100 nM Dex (D) for 24 h prior to Western blotting with either RCAN1 or β-actin specific antibodies as in Panel A. Densitometric analysis of two independent experiments was performed using ImageJ software, and average data are presented below the gel. Panel C: CEM-C7-14 cells were treated with the indicated kinase inhibitors in the presence of either ethanol (E) or 100 nM Dex (D) for 24 h were subjected to (i) Western blotting with phospho-Akt specific antibody (Cell Signaling Technology, cat # 9271) or (ii) p38 MAP kinase activity using a kit from Cell Signaling Technology (cat # 9820), as described in the methods section.
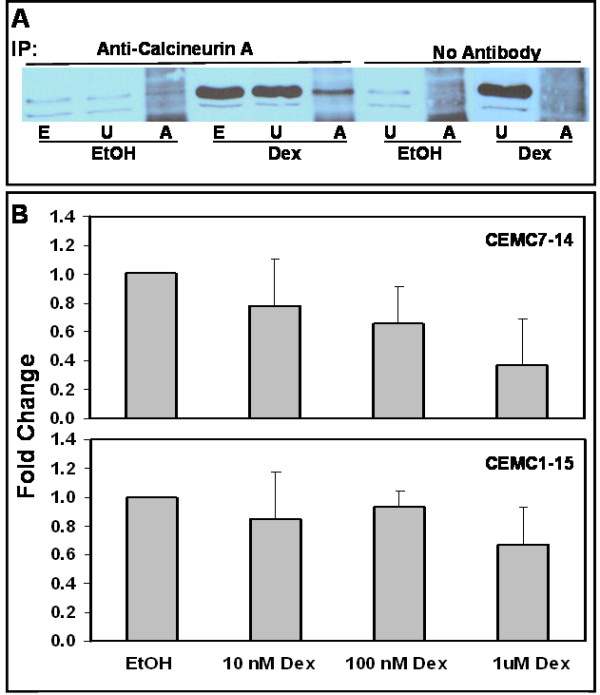
Figure 5
Calcineurin binds to RCAN1-1 in correlation with loss of phosphatase activity: Panel A: CEM-C7-14 cells were treated with ethanol vehicle (EtOH) or 100 nM Dex (Dex) for 24 h, cell lysates were prepared in RIPA buffer and subjected (500 μg protein) to immunoprecipitation with either anti-calcineurin A antibody or no antibody, as indicated. Unadsorbed lysates (U; 50 μg protein) or proteins bound to Protein A-Agarose (A; entire pellet) were run alongside total cell lysates (E; 50 μg protein). Western blotting was performed using RCAN1 antibody (Abgent # AP6315c). Panel B: CEM-C7-14 or CEM-C1-15 cells treated with 0-1 μM Dex were subjected to a calcineurin phosphatase activity assay using a kit (Biomol). Cells were lysed in the lysis buffer provided, and were cleared of any free phosphate by passing through Micro Bio-Spin P-30 Tris chromatography columns (Bio-Rad). Phosphate free lysates were incubated with a known calcineurin substrate phosphopeptide, RII, and the free phosphate released was measured using a Malachite Green based assay. Okadaic acid was used to inhibit PP1 and PP2A and Okadaic acid and EGTA was used to block PP1, PP2A and PP3C (calcineurin) activity. To calculate PP3C activity, okadaic acid inhibited activity was subtracted from total phosphatase activity. Alternatively, okadaic acid and EGTA inhibited activity was subtracted from okadaic acid inhibited activity. Phosphate released in nmoles was corrected for protein content, measured using the Bradford assay. Data are averages ± SD of two (CEM-C1-15) or three (CEM-C7-14) independent treatments, each normalized to the ethanol control.
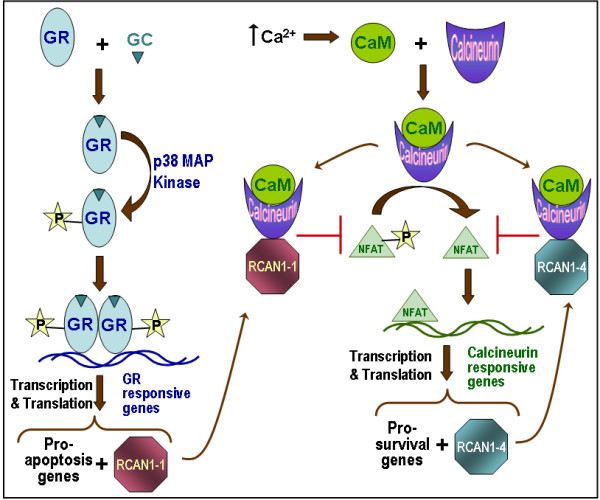
Figure 6
RCAN1 mediated regulation of cell proliferation and apoptosis: Schematic shows that GC-dependent GR activation and subsequent MAP kinase-dependent phosphorylation enables GR binding to GRE sequences on target genes. GR alters expression profiles of T-lymphoid cells resulting in a net increase in pro-apoptotic gene expression. One of the gene that GR induces is RCAN1-1. Increases in [Ca2+]i levels triggers the calcium signaling pathway, culminating in the activation of calcineurin phosphatase (PP3C), which dephosphorylates and activates NFAT, causing its nuclear translocation. NFAT induces transcription of pro-survival genes, and RCAN1-4, which serves as a negative feed-back regulatory loop, because it can directly bind to and inactivate calcineurin phosphatase. GR-dependent induction of RCAN1-1 also causes inhibition of calcineurin, and subsequent down-regulation of pro-survival genes, thus facilitating GR-dependent apoptosis of T lymphoid cells.