
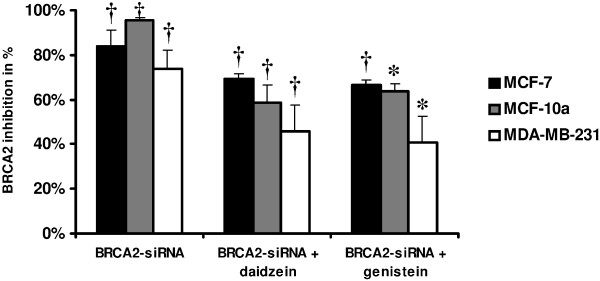
Figure 1
Specific knockdown of BRCA2 mRNA expression measured by RT-qPCR in MCF-7, MCF-10a and MDA-MB-231 breast cell lines after BRCA2-siRNA, BRCA2-siRNA + daidzein, and BRCA2-siRNA + genistein 72-h treatments in comparison to controls. The ΔΔCt method and normalization by comparison with controls were used. Values are means ± SD for n = 3 assays. Statistical analysis was carried out by Student t-test (*, P < 0.05; †, P < 0.01).
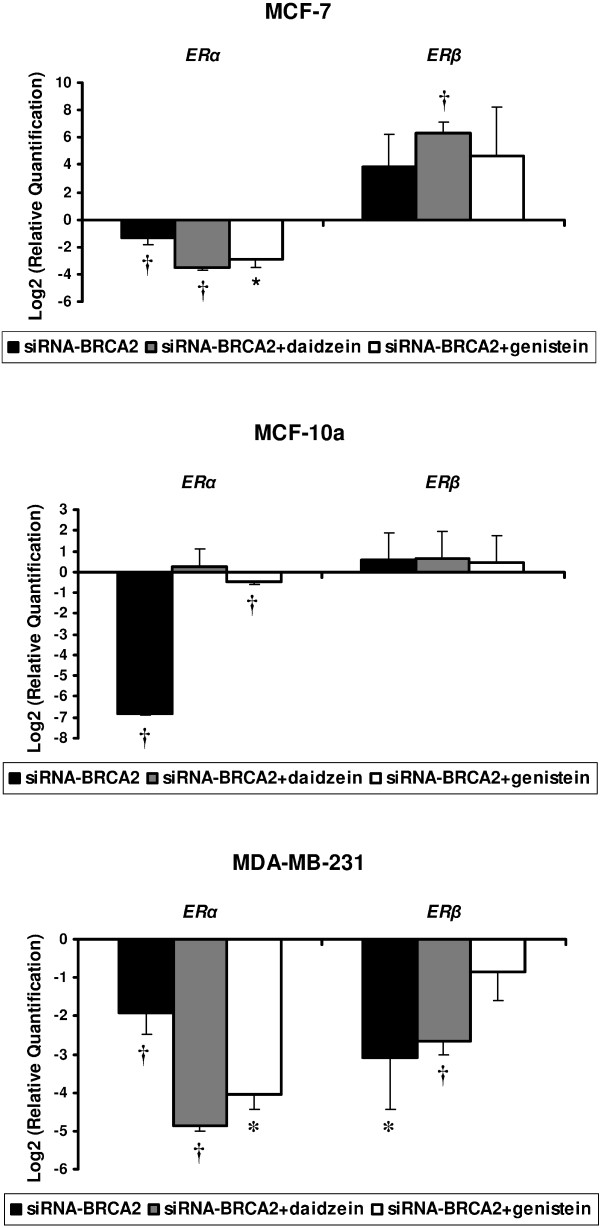
Figure 2
Modulation in mRNA levels performed by TLDA for estrogen receptor genes (ERα and ERβ) with differential expression between BRCA2-siRNA treatment and BRCA2-siRNA with isoflavone exposure, compared to control cells corresponding to value 0, in MCF-7, MCF-10a and MDA-MB-231 cell lines. Values are means ± SD for n = 3 assays. Statistical analysis were carried out by Student t-test (†, P < 0.01; *, P < 0.05).
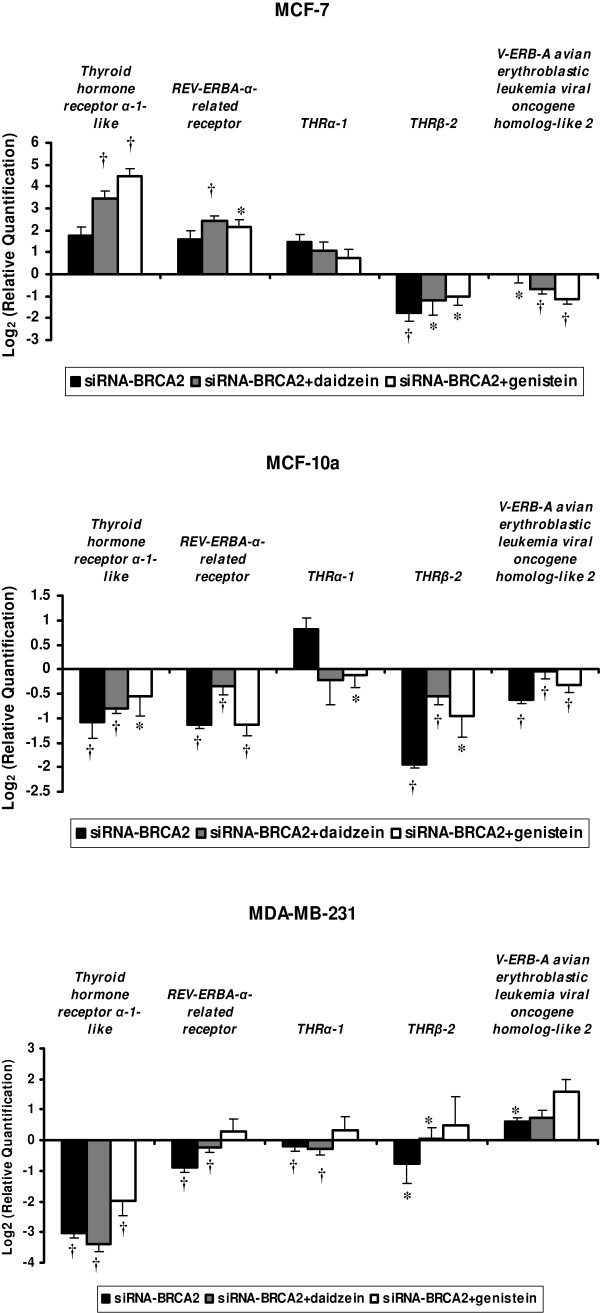
Figure 3
Modulations in mRNA levels performed by TLDA for thyroid hormone receptor-related genes (Thyroid hormone receptor α-1-like, REV-ERBA-α-related receptor, THR α-1, THR β-2, V-ERB-A avian erythroblastic leukemia viral oncogene homolog-like 2) occurring after BRCA2-siRNA treatment and BRCA2-siRNA with isoflavone exposures, compared to control cells corresponding to value 0, in MCF-7, MCF-10a, and MDA-MB-231 cell lines. Values are means ± SD for n = 3 assays. Statistical analysis were carried out by Student t-test (†, P < 0.01; *, P < 0.05).
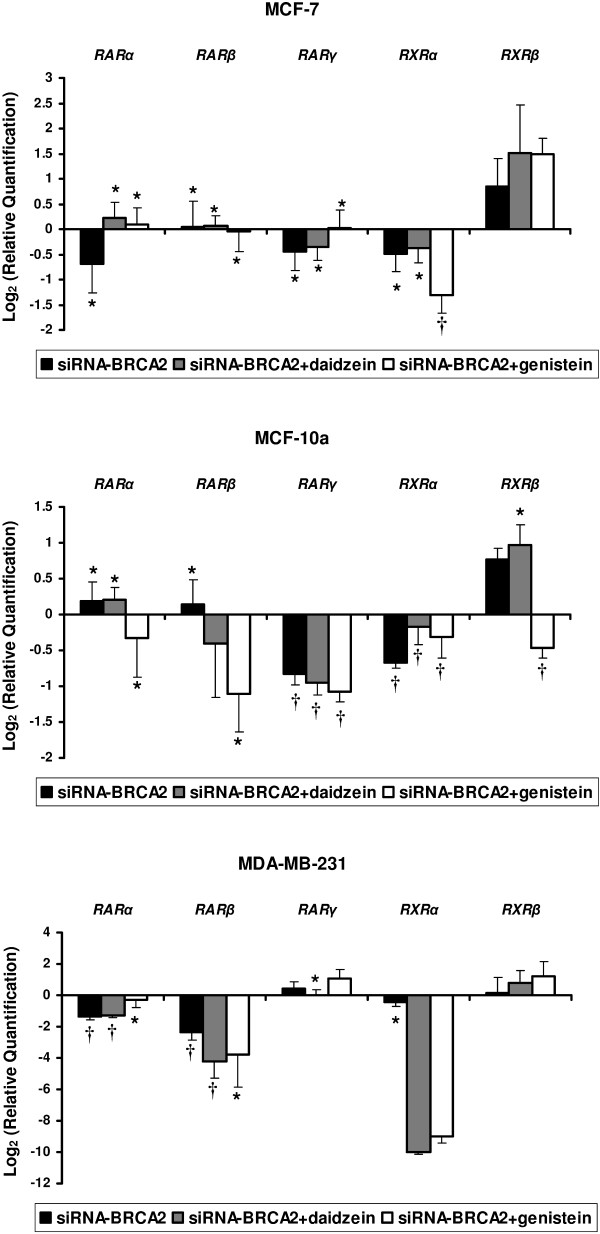
Figure 4
Modulations in mRNA levels performed by TLDA for retinoic acid receptor-related genes (RARα, RARβ, RARγ, RXRα, and RXRβ) occurring after BRCA2-siRNA treatment and BRCA2-siRNA with isoflavone exposure when compared to control cells corresponding to value 0, in MCF-7, MCF-10a, and MDA-MB-231 cell lines. Values are means ± SD for n = 3 assays. Statistical analysis were carried out by Student t-test (†, P < 0.01; *, P < 0.05).
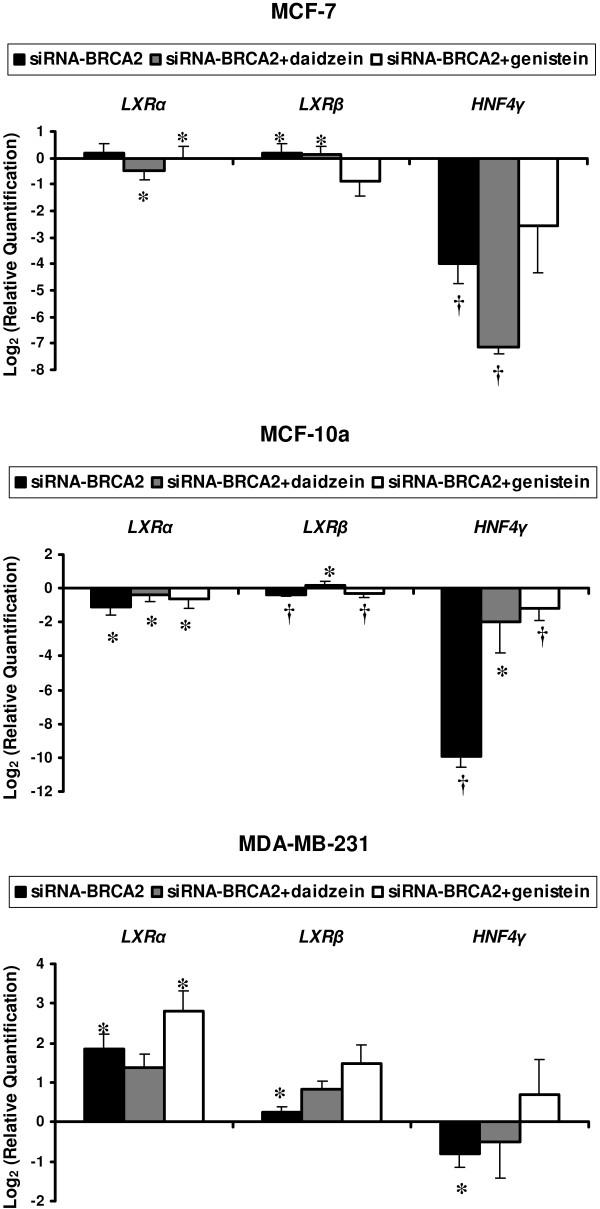
Figure 5
Modulation in mRNA levels performed by TLDA for liver receptor genes (LXRα, LXRβ and HNF4γ) with differential expression between BRCA2-siRNA treatment and BRCA2-siRNA with isoflavone exposure when compared to control cells corresponding to value 0, in MCF-7, MCF-10a, and MDA-MB-231 cell lines. Values are means ± SD for n = 3 assays. Statistical analysis were carried out by Student t-test (†, P < 0.01; *, P < 0.05).
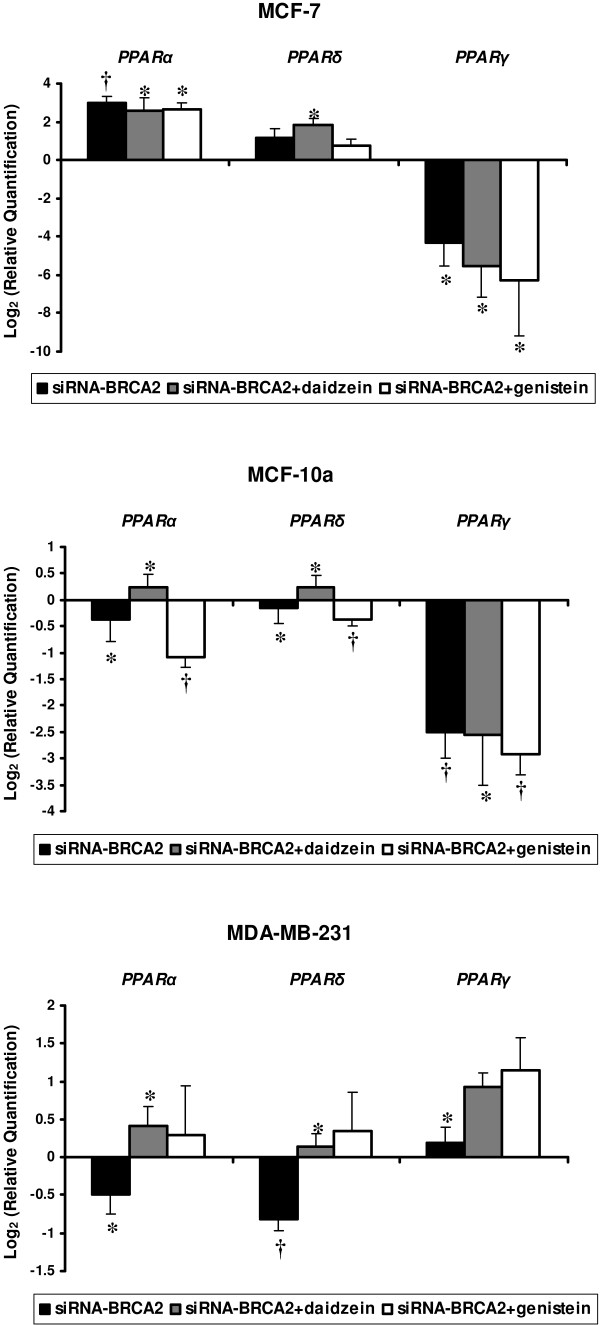
Figure 6
Modulations in mRNA levels performed by TLDA for peroxisome-related receptor genes (PPARα, PPARδ and PPARγ) with differential expression between BRCA2-siRNA treatment and BRCA2-siRNA with isoflavone exposure when compared to control cells corresponding to value 0, in MCF-7, MCF-10a, and MDA-MB-231 cell lines. Values are means ± SD for n = 3 assays. Statistical analysis were carried out by Student t-test (†, P < 0.01; *, P < 0.05).
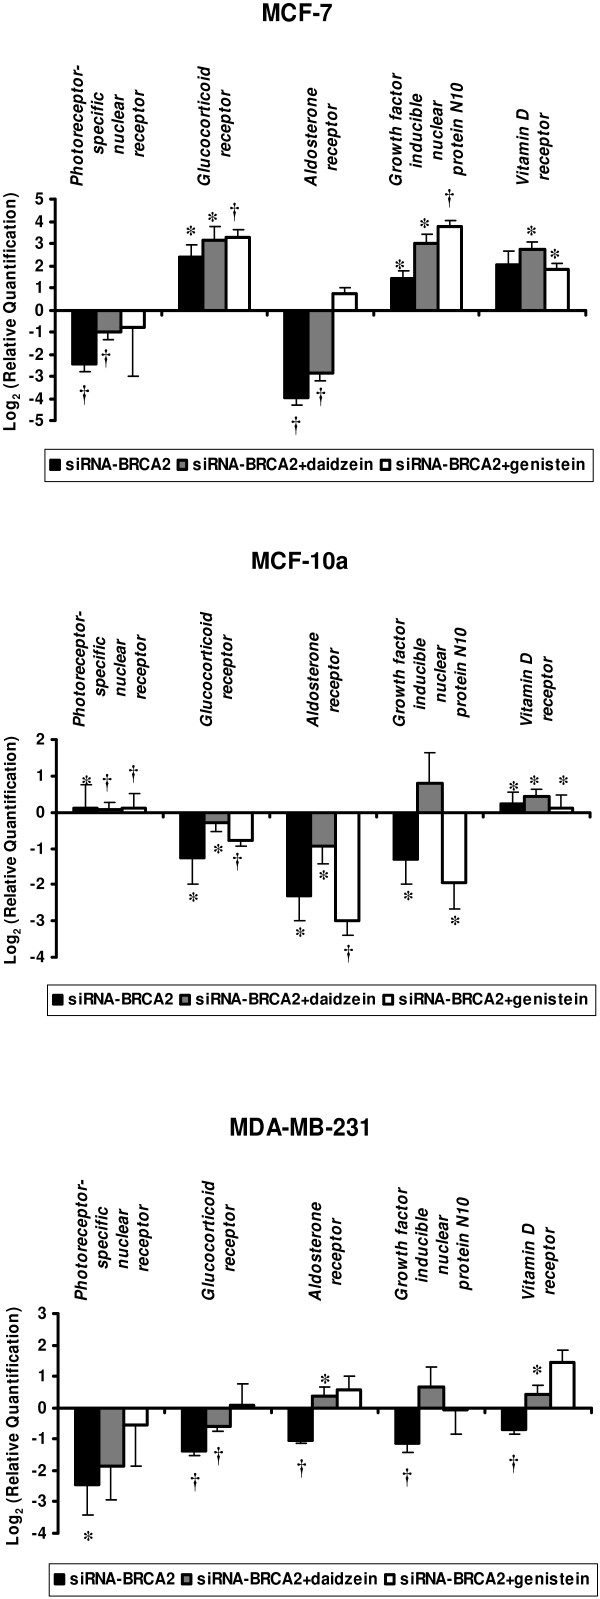
Figure 7
Modulations in mRNA levels performed by TLDA for hormone receptor genes (Photoreceptor-specific nuclear receptor, Glucocorticoid receptor, Aldosterone receptor, Growth factor inducible nuclear protein N10 and Vitamin D receptor) with differential expression between BRCA2-siRNA treatment and BRCA2-siRNA with isoflavone exposure when compared to control cells corresponding to value 0, in MCF-7, MCF-10a, and MDA-MB-231 cell lines. Values are means ± SD for n = 3 assays. Statistical analysis were carried out by Student t-test (†, P < 0.01; *, P < 0.05).