
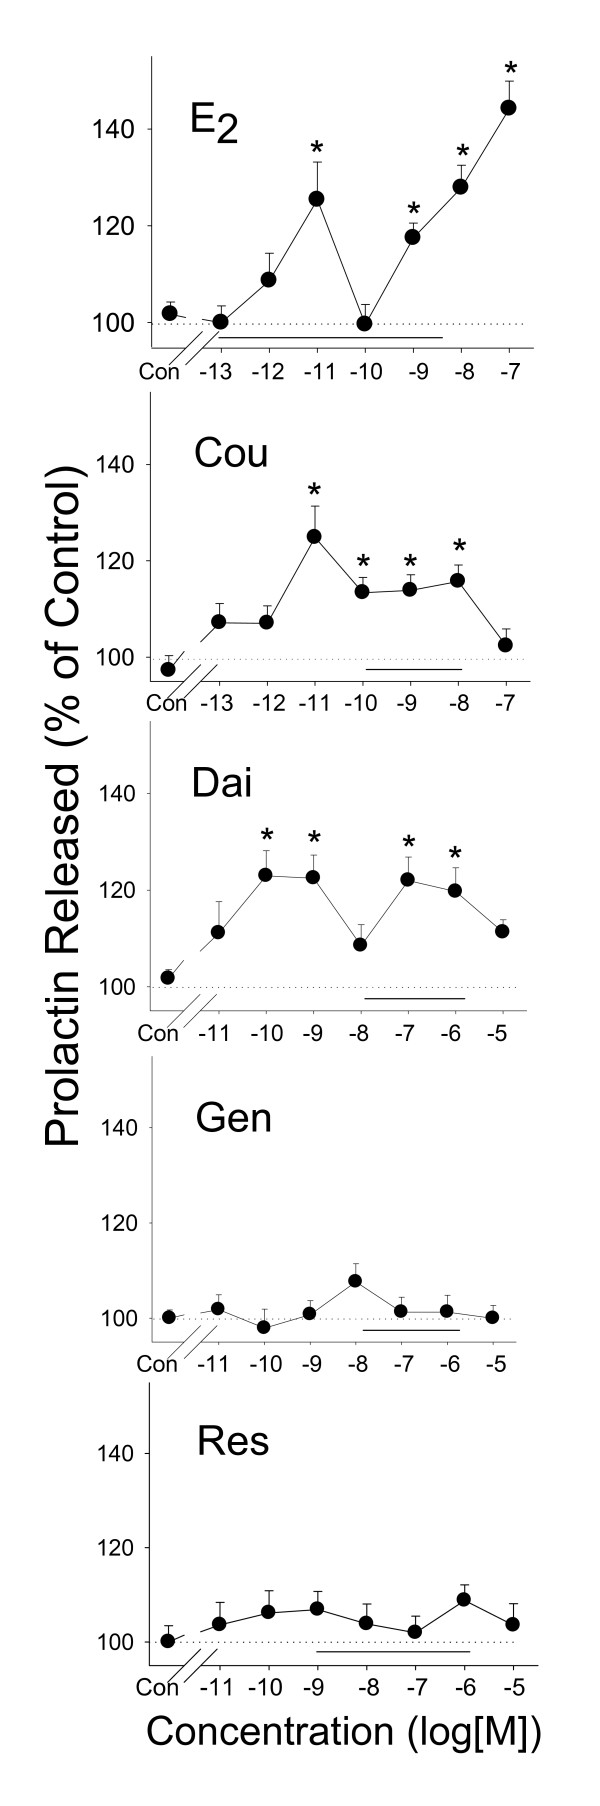
Figure 1
PRL release induced by phytoestrogens. Measurements of PRL (by RIA) released into the media after 2 minutes of treatment with different concentrations of estrogens: estradiol (E2), coumesterol (Cou), daidzein (Dai), genistein (Gen), and trans-resveratrol (Res). The solid horizontal line indicates the range of serum and/or urine concentrations of each phytoestrogen found in humans. * = p < 0.05 compared to vehicle treated-cells (Con).
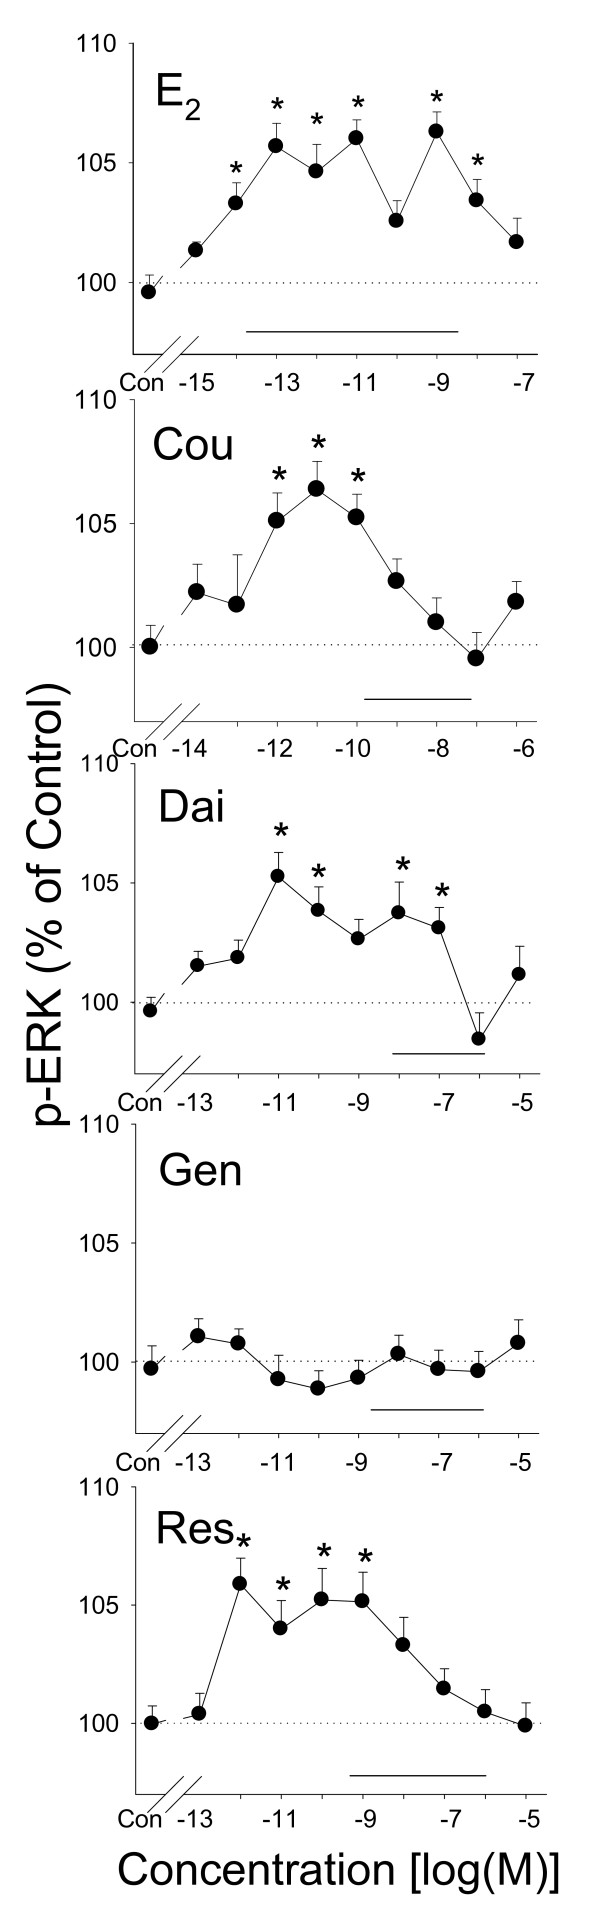
Figure 2
ERK phosphorylation induced by phytoestrogens. Quantitative plate assay measurements of phosphorylated ERKs 1 and 2 after 5 minutes of treatment with different concentrations of estrogens: estradiol (E2), coumesterol (Cou), daidzein (Dai), genistein (Gen), and trans-resveratrol (Res). The solid horizontal line indicates the range of serum and/or urine concentrations of each phytoestrogen found in humans. * = p < 0.05 compared to vehicle treated-cells (Con).
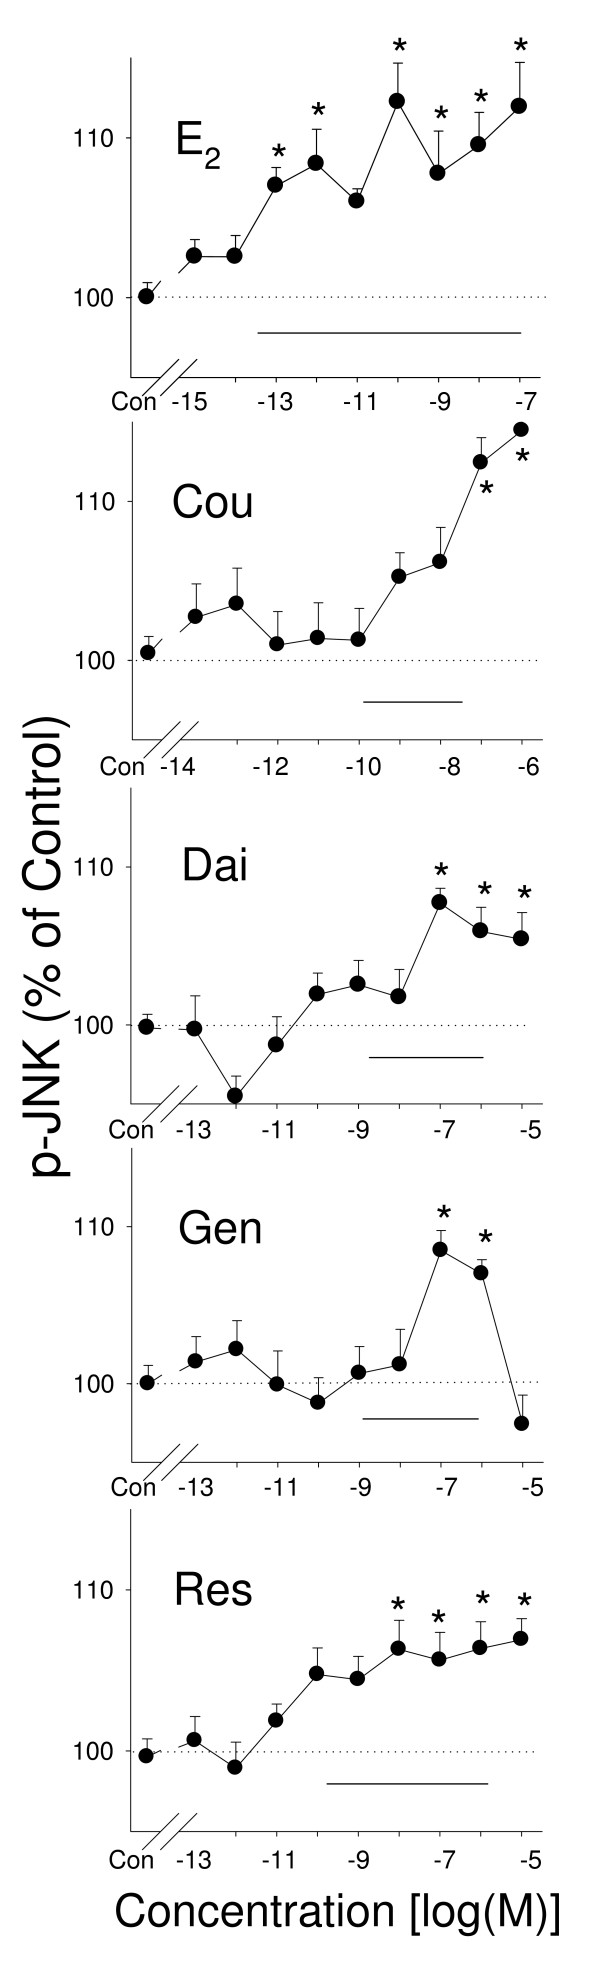
Figure 3
JNK phosphorylation induced by phytoestrogens. Quantitative plate assays of phosphorylated JNKs 1, 2 and 3 after 15 minutes of treatment with different concentrations of estrogens: estradiol (E2), coumesterol (Cou), daidzein (Dai), genistein (Gen), and trans-resveratrol (Res). The solid horizontal line indicates the range of serum and/or urine concentrations of each phytoestrogen found in humans. * = p < 0.05 compared to vehicle treated-cells (Con).
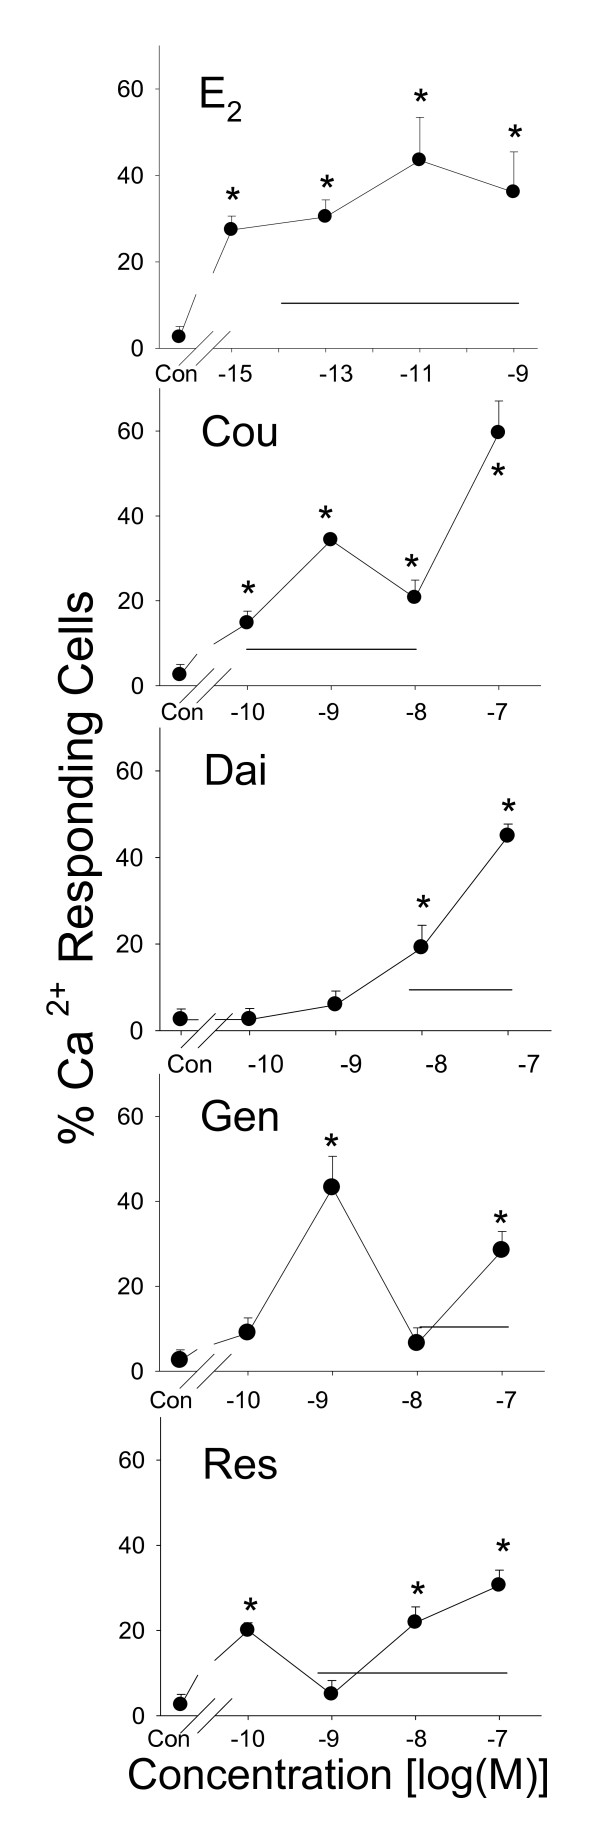
Figure 4
Percentage of cells showing Ca2+ influx triggered by phytoestrogens. Fura-2 analyses of the percentage of cells showing a Ca2+ influx response to treatment with different concentrations of estrogens: estradiol (E2), coumesterol (Cou), daidzein (Dai), genistein (Gen), and trans-resveratrol (Res). The solid horizontal line indicates the range of serum and/or urine concentrations of each phytoestrogen found in humans. * = p < 0.05 compared to vehicle-treated cells (Con).
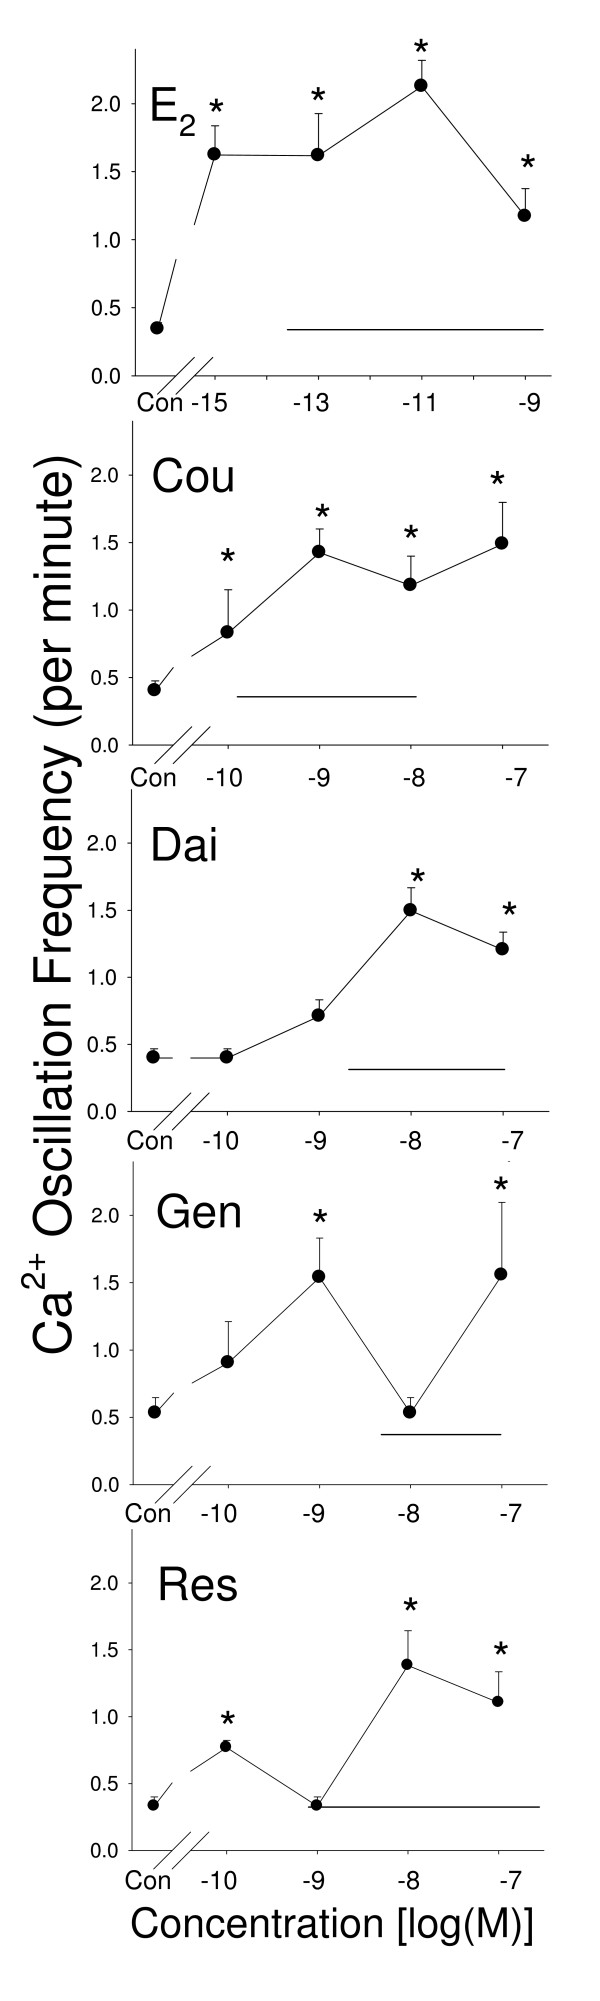
Figure 5
Effects of phytoestrogens on Ca2+ oscillation. Fura-2 measurements of Ca2+ oscillation frequency in cells treated with different concentrations of estrogens: estradiol (E2), coumesterol (Cou), daidzein (Dai), genistein (Gen), and trans-resveratrol (Res). The solid horizontal line indicates the range of serum and/or urine concentrations of each phytoestrogen found in humans. * = p < 0.05 compared to vehicle-treated cells (Con).
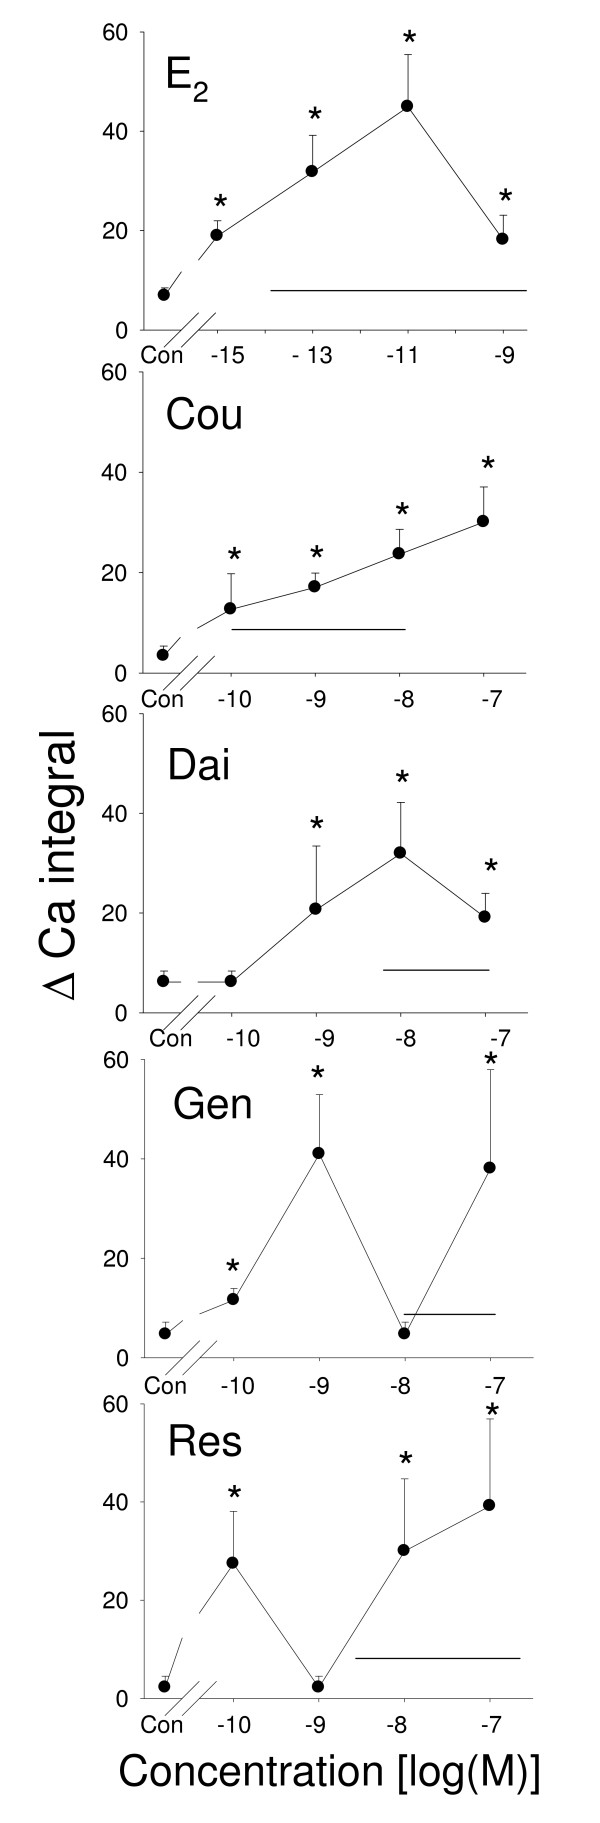
Figure 6
Effects of phytoestrogens on Ca2+ entry volume. Fura-2 analyses of the total Ca2+ influx (total area under the Ca2+ curves) in cells treated with different concentrations of estrogens: estradiol (E2), coumesterol (Cou), daidzein (Dai), genistein (Gen), and trans-resveratrol (Res). The solid horizontal line indicates the range of serum and/or urine concentrations of each phytoestrogen found in humans. * = p < 0.05 compared to vehicle-treated cells (Con).
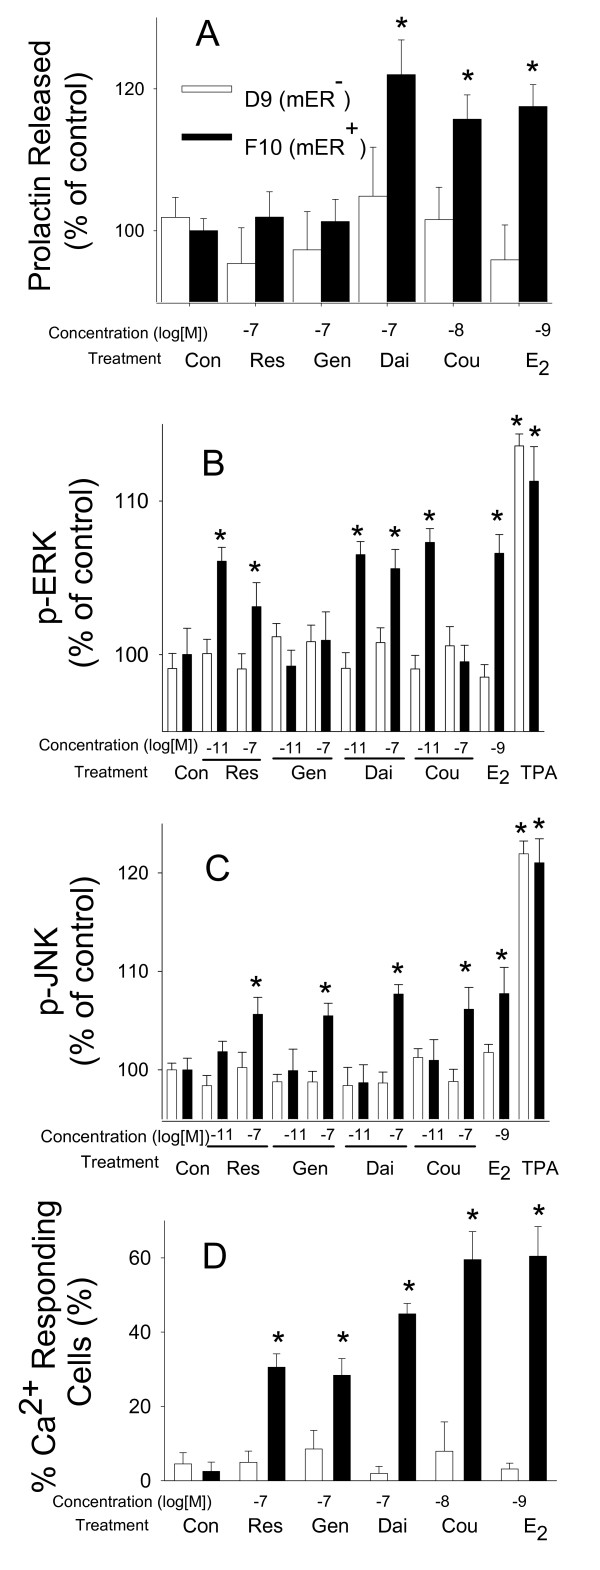
Figure 7
Involvement of mERα in nongenomic effects by phytoestrogens. Comparison of mERα-depleted subclone D9 (open bars) with mERα-enriched subclone F10 cells (solid bars) treated with different estrogens: estradiol (E2), coumesterol (Cou), daidzein (Dai), genistein (Gen), and trans-resveratrol (Res). (A) PRL released, (B) ERK activation, (C) JNK activation, and (D) % of cells showing Ca2+ influx. * = p < 0.05 compared to vehicle-treated cells (Con).