
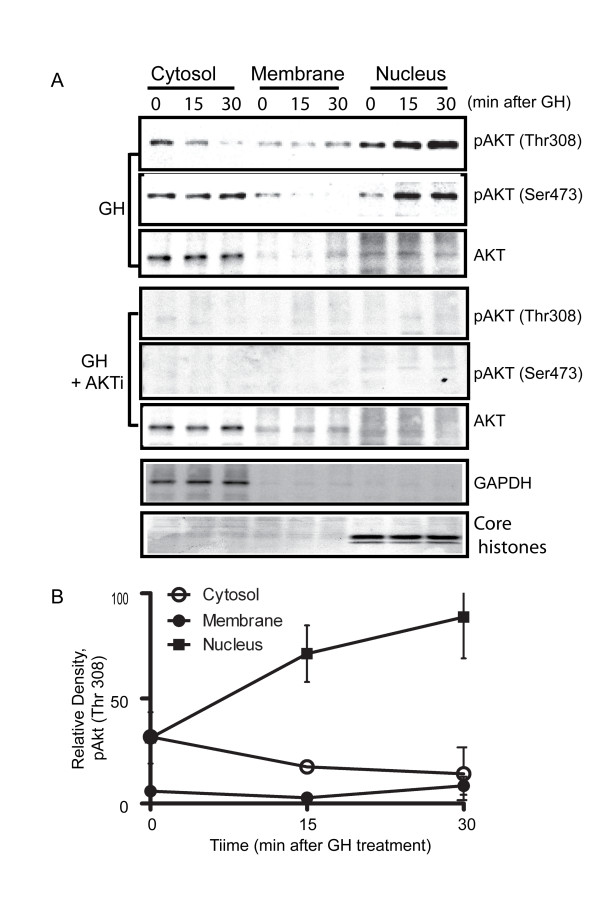
Figure 1
Panel A: Cells with or without pre-treatment of AKT inhibitor (AKTi) were challenged with GH at 200 ng/ml for 0, 15 and 30 min respectively. Cellular proteins were extracted from MDBK cells using the ProteoExtract® subcellular extraction kit (Calbiochem) following the manufacturer's instructions. Western blotting experiments were conducted and analyzed as specified in Material and Methods. Panel B shows the quantitation of AKT phosphorylation (p-Thr308) after GH treatment.
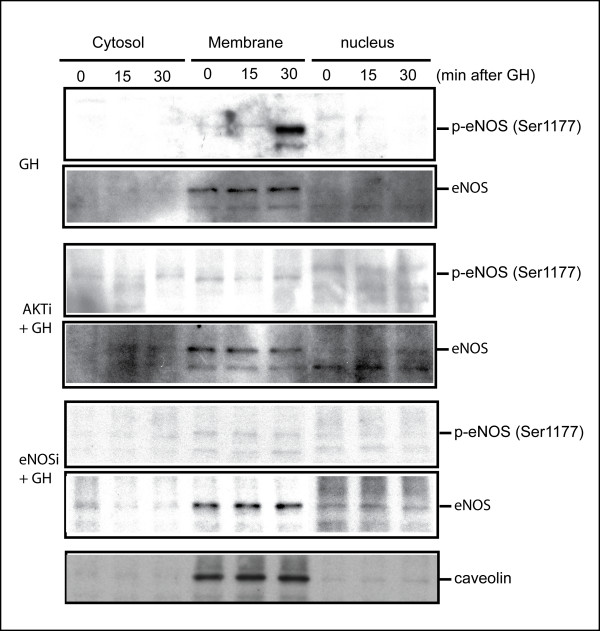
Figure 2
AKT inhibitor eliminates the phosphorylation of eNOS (Ser1177). MDBK cells with or without pre-treatment of AKT inhibitor for 30 min were challenged with GH at 200 ng/ml for 0. 15 and 30 min respectively. At the indicated time points, proteins were extracted from MDBK cells using the ProteoExtract® subcellular extraction kit (Calbiochem) and Western blot analyses were performed. Caveolin was used as a membrane protein marker. AKTi: AKT inhibitor. AKTi + GH: Cells pretreated with AKT inhibitor for 30 min before GH administration.
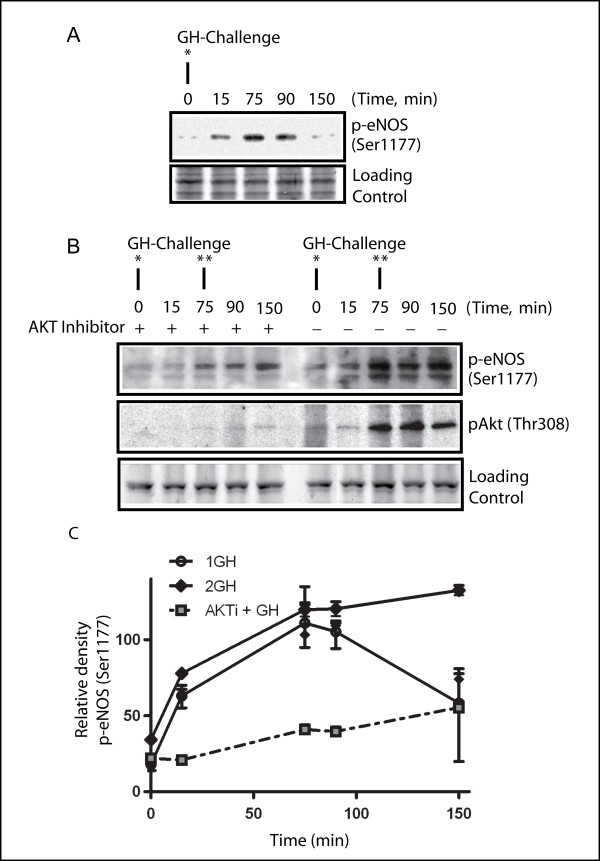
Figure 3
The changes in the phosphorylation of eNOS after one or two GH challenges. GH was administrated first at 0 min and again time at 75 min to MDBK cell cultures with or without AKT inhibitor pre-treatment. Whole cell extracts were prepared at the time point 0, 15, 75, 90 and 150 min after first GH challenge. Western blots using the antibodies against phospho-eNOS and phospho-AKT were performed. Panel A: The eNOS phosphorylation after one GH challenge. Panel B: The eNOS phosphorylation with two GH challenges, with or without AKT inhibitor pre-treatment for 30 min. Western blot with phospho-AKT (Thr308) was used to monitor the effectiveness of the AKT inhibitor. Loading control: Identical gel stained with SimplyBlue™ (Invitrogen). Panel C shows the quantitation of eNOS phosphorylation (Ser1177) after GH treatment. 1 GH: the quantitation for one GH challenge; 2 GH: quantitation for two GH challenge; AKTi + GH: AKT inhibitor pretreated for 30 min before GH challenge; *: First GH challenge, **: second GH challenge.
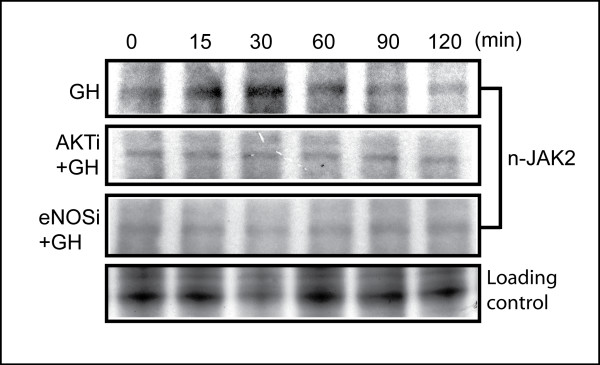
Figure 4
Both AKT and eNOS inhibitors eliminate the nitration of JAK2. GH was administrated to cell cultures with or without either AKT or eNOS inhibitor pre-treatment for 30 min. Whole cell extracts were analyzed with Western blot using an antibody (Anti-nitro-1007-Y1008Y-JAK2). AKTi: AKT inhibitor, eNOSi: eNOS inhibitor. Loading control: Identical gel stained with SimplyBlue™ (Invitrogen).
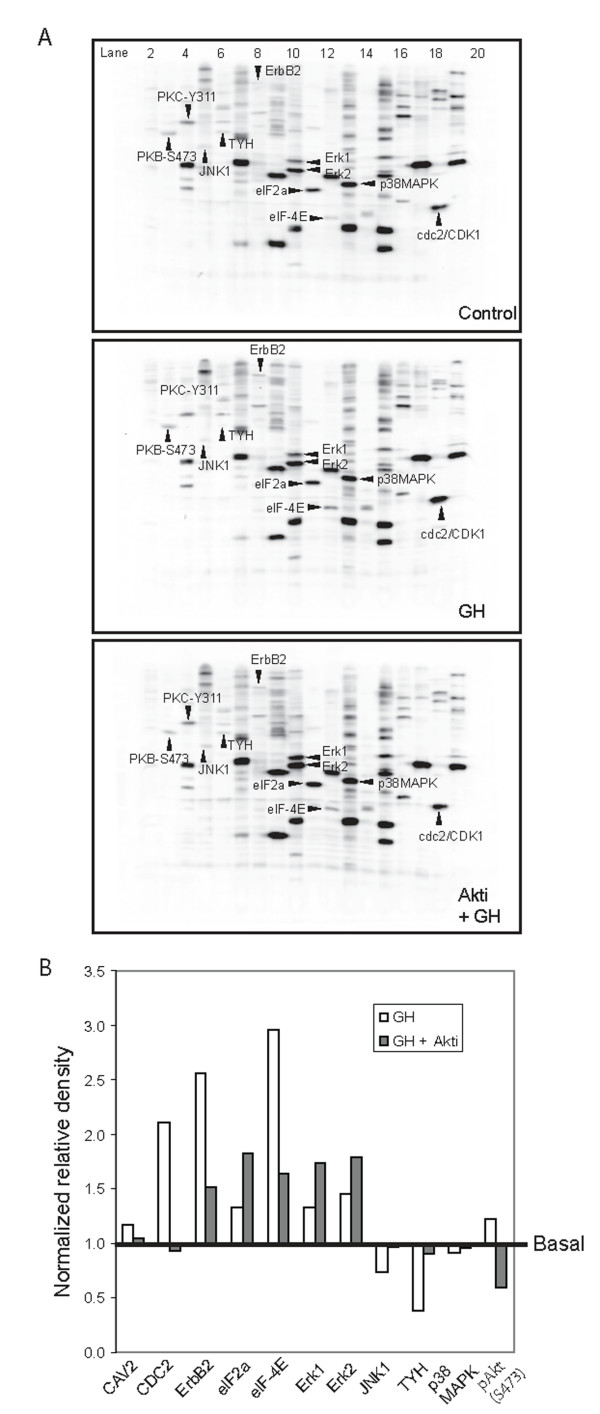
Figure 5
Panel A: KPSS-6.0 phosphoantibody multi-immunoblot array; MDBK cells were treated with or without the AKT inhibitor for 30 minutes before GH administration. The whole cell lysates were prepared after 30 min of GH challenge and analyzed using the KPSS-6.0 phosphoantibody multi-immunoblot array by Kinexus http://www.kinexus.ca/KPSS.htm. The phosphor-protein targets of interest are indicated by arrows and abbreviations. The upper panel gives the array analysis of normal cells without GH (control); the middle panel shows the array analysis of GH treated cells; the lower panel gives the array analysis of the AKT inhibitor pretreated cells before GH administration. Panel B: Normalized quantitation of the results of KPSS-6.0 phosphoantibody multi-immunoblot array. The quantitation is the trace quantity of the band corrected to a scan time of 60 seconds. The normalized quantitation is the quantitation normalized to correct for differences in protein amounts.
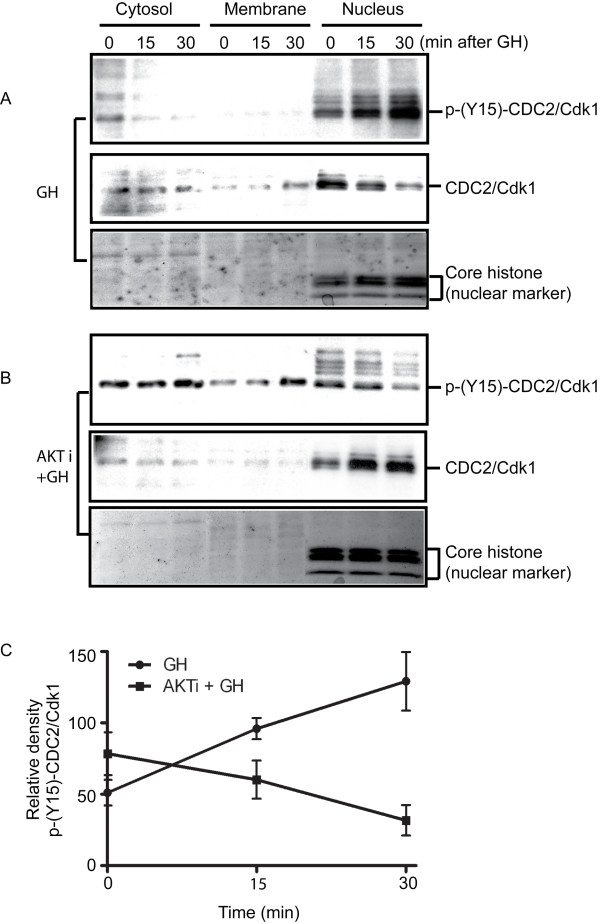
Figure 6
Phosphorylation states of CDC2 in a time course of GH treatment in the cell culture with or without AKT inhibitor (AKTi) pre-treatment. After treatment with GH at the indicated time points, proteins were extracted from MDBK cells using the ProteoExtract® subcellular extraction kit (Calbiochem). Two identical gels were transferred to nitrocellulose membrane and Western blot analyses were performed for total CDC2/Cdk1 and phosphor-CDC2/Cdk1. Panel A: Temporal changes of phospho-CDC2/Cdk1 (p-(Y15)-CDC2/Cdk1 and total CDC2/Cdk1 after administration of GH. Panel B: Temporal changes of phosphor-CDC2/Cdk1 (p-(Y15)-CDC2/Ckd1) and total CDC2/Cdk1 in AKT inhibitor (AKTi)-pretreated MDBK cells after administration of GH. Panel C: Quantitation of phosphor-CDC2/Cdk1 (p-(Y15)-CDC2/Cdk1) from panels A and B. n = 2 replicated experiments.
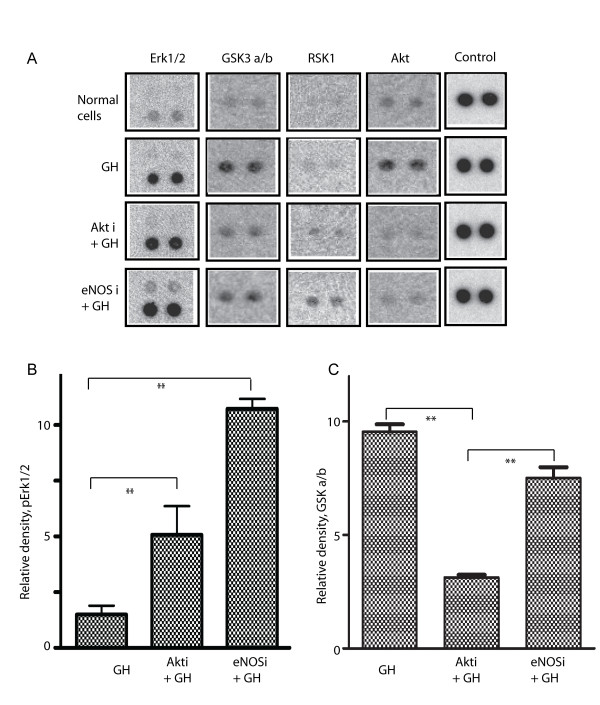
Figure 7
Proteome Profiler Array™-Human Phospho-MAPK analysis; whole cell extracts from normal cells, and GH challenged (30 minutes) cells, with or without pre-treatment with either AKT or eNOS inhibitors, were analyzed with Proteome Profiler Array™-Human Phospho-MAPK. Panel A: Data for one representative array. Panel B: Quantitation of phospho-Erk1/2. Panel C: Quantitation of phospho-GSK a/b. n = 2 replicated experiments. *: P < 0.05; **: P < 0.02.
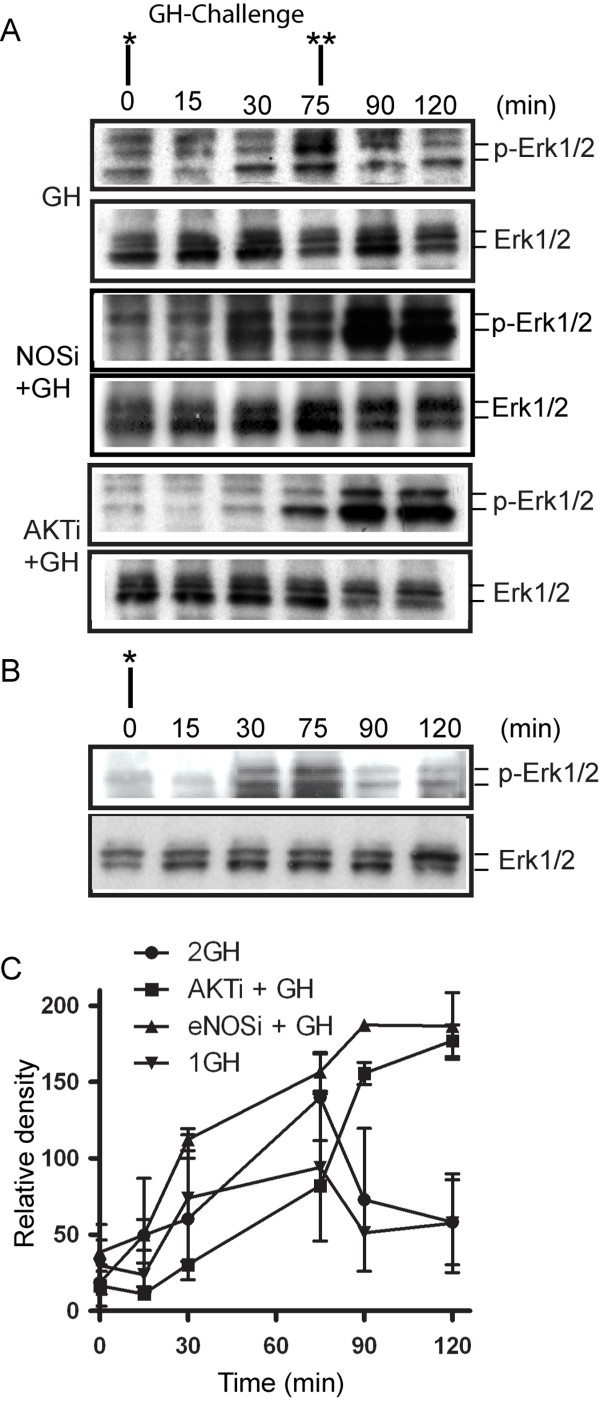
Figure 8
Both AKT and eNOS inhibitors prolong and augment Erk1/2 phosphorylation. GH was administrated first at 0 min and a second time at 75 min to cell cultures with or without AKT inhibitor pre-treatment. Whole cell extracts were prepared. A) Western blots using an antibody against phospho-Erk1/2 and Erk1/2 show that the phosphorylation of Erk1/2 starts 15 min after the first GH administration and 2 levels off after 75 min even with secondary GH administration. B) For comparison, cell extracts from cells with single GH stimulation were prepared and Western blots were performed for Erk1/2 and phosphorylated Erk1/2. C) Quantitation of the Western blots data. *: First GH challenge, **: second GH challenge. AKTi: Akt inhibitor, eNOSi: eNOS inhibitor.