
Figure 1
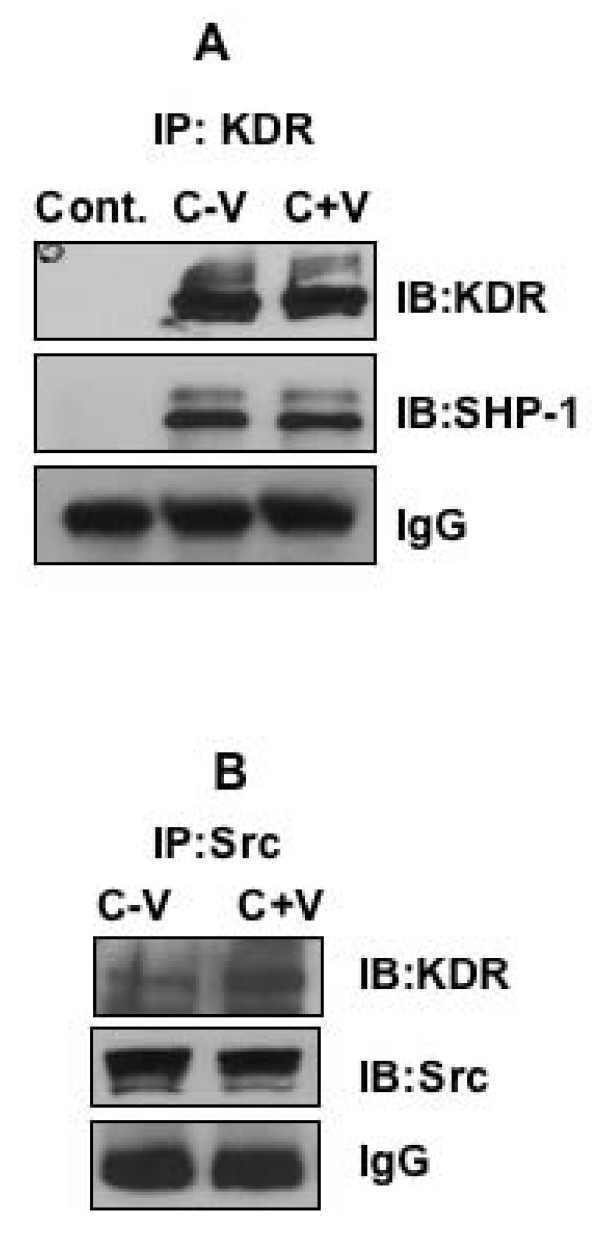
KDR, c-Src and SHP-1 co-precipitate and are part of one complex. (A) Serum starved HUVEC was treated with or without VEGF 10 ng/ml for 5 min and immunoprecipitated with antibody against KDR and immunoblotted with SHP-1 antibody. The first lane represents negative control (rabbit IgG). (B) Serum starved HUVEC was treated with or without VEGF 10 ng/ml for 5 min and immunoprecipitated with antibody against c-Src and immunoblotted with KDR and Src antibody.
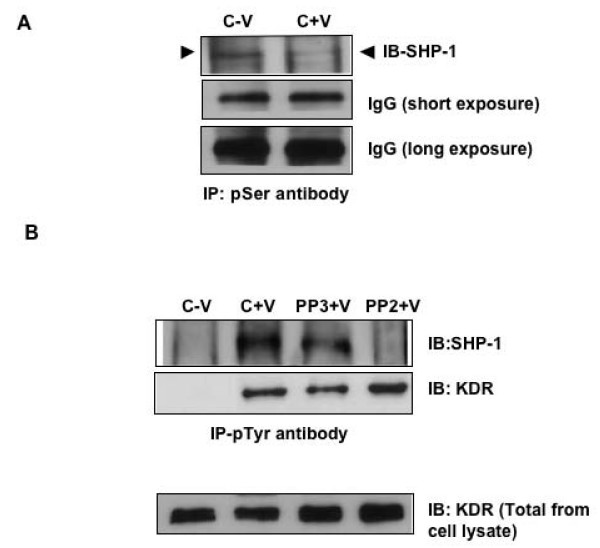
Figure 2
Serine and tyrosine phosphorylation of SHP-1. (A) Serum starved HUVEC was treated with or without VEGF 10 ng/ml for 5 min and immunoprecipitated with antibody against phospho-Ser and immunoblotted with HRP conjugated SHP-1 antibody. (B) Serum starved HUVEC was pretreated with PP2 or PP3, 5 uM for 1 h followed by treatment with VEGF 10 ng/ml for 5 min and immunoprecipitated with antibody against phospho-Tyr and immunoblotted with SHP-1 and KDR antibody. Cell lysates from the same sample were also run to show total KDR levels.
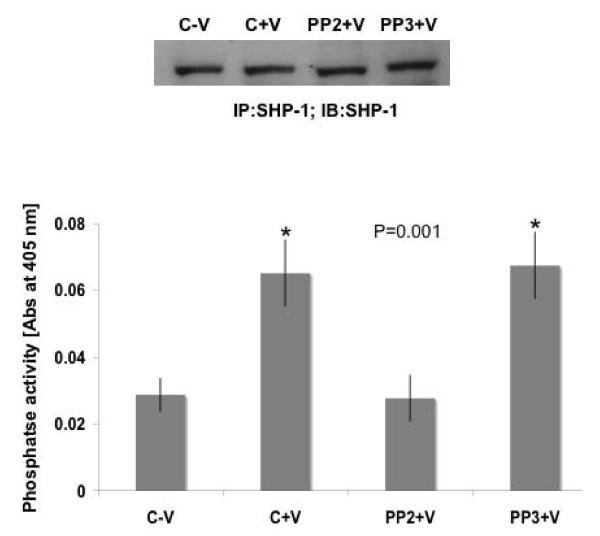
Figure 3
SHP-1 phosphatase assay. Phosphatase assay was performed using pNNP. Serum starved HUVEC was pretreated with PP2 or PP3, 5 uM for 1 h followed by treatment with VEGF 10 ng/ml for 5 min and immunoprecipitated with antibody against SHP-1 using, "catch and release column," from Upstate. One part was run on a gel and the other part was used for the phosphatase assay. Data represent average of three independent determinations normalized with respect to negative control (P = 0.001).
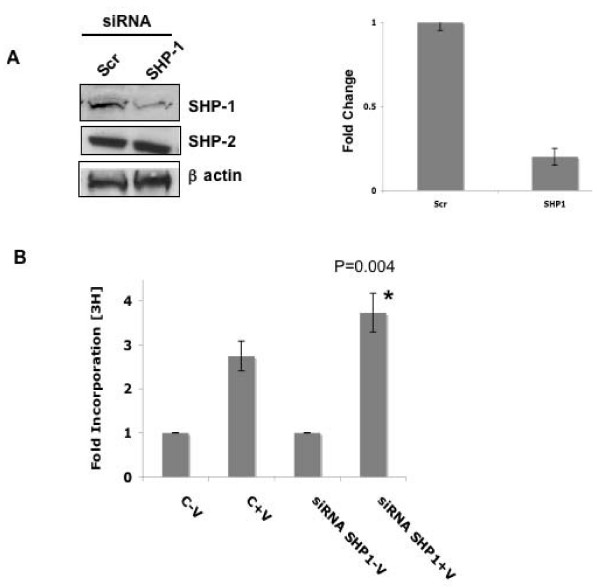
Figure 4
Knockdown of SHP-1 using siRNA and its effect on DNA synthesis. (A) HUVEC were transfected with scrambled control or SHP-1 siRNA using oligofectamine and protein levels checked after 48 h. β actin served as a loading control. SHP-2 levels were not affected. NIH Image quantitation data normalized with respect to b actin is shown. (B) HUVEC were transfected with scrambled control or SHP-1 siRNA using oligofectamine. After 48 h, the cells were plated on 24 well plates and [3H]thymidine incorporation assay carried out as described in Materials and Methods. Data represent average of five independent determinations each in triplicate (P = 0.004).
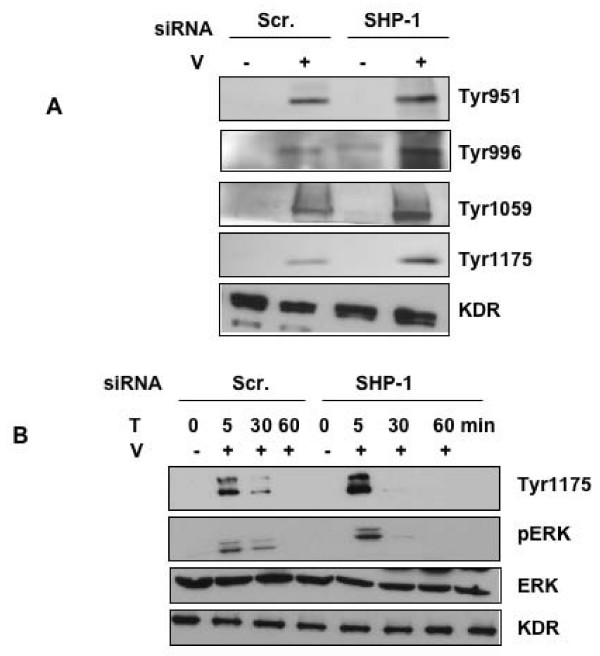
Figure 5
Effect of SHP-1 knockdown on phosphorylation of KDR and ERK. (A) HUVEC were transfected with scrambled control or SHP-1 siRNA using oligofectamine. After 48 h the cells were serum starved and treated with or without VEGF 10 ng/ml and immunoblotted with antibodies against p-Tyr of KDR. Total KDR served as a loading control. (B) HUVEC were transfected with scrambled control or SHP-1 siRNA using oligofectamine. After 48 h the cells were serum starved and treated with or without VEGF 10 ng/ml and immunoblotted with antibodies against p-ERK. Total ERK served as a loading control.
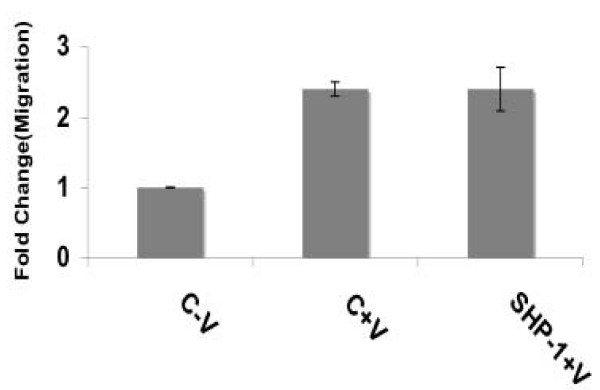
Figure 6
Effect of SHP-1 knockdown on migration. HUVEC were transfected with scrambled control or SHP-1 siRNA using oligofectamine. After 48 h, the cells were plated on 6 well plates and wound healing migration carried out as described in Materials and Methods. Data represent average of three independent determinations each in triplicate.
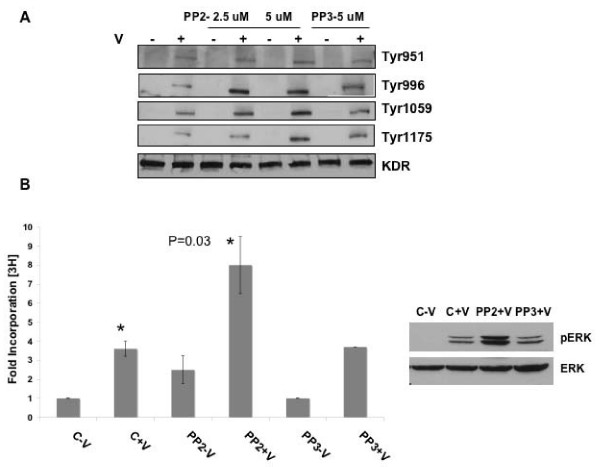
Figure 7
Effect of inhibition of c-Src on phospho-Tyr of KDR and DNA synthesis. (A) HUVEC was pretreated with PP2 or PP3 at 2.5 or 5 uM for 1 h and then with or without VEGF 10 ng/ml and immunoblotted with antibodies against p-Tyr of KDR. Total KDR served as loading control. (B) HUVEC were plated in 24 well plates, pretreated with PP2 or PP3 at 5 uM for 1 h and then with or without VEGF 10 ng/ml and [3H]thymidine incorporation carried out as described in Materials and Methods. Another set of the same treatment was subjected to a western blot for pERK and total ERK. Data represent average of three independent determinations each in triplicate (P = 0.03).
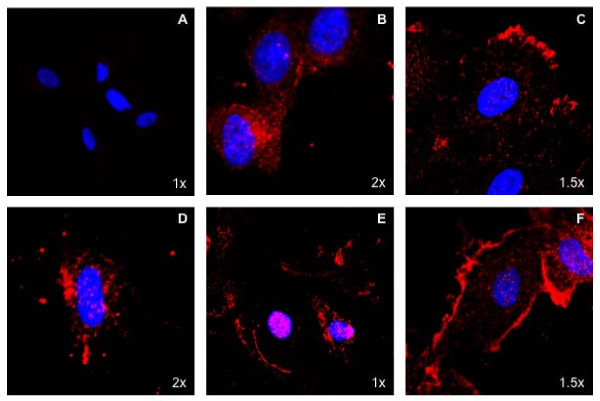
Figure 8
Localization of p-Tyr 996 of KDR. (A) HUVEC was treated with VEGF 10 ng/ml for 5 min and then stained with boiled p-Tyr 996 KDR antibody, this served as a negative control. (B) Untreated HUVEC was stained with p-Tyr 996 KDR antibody in red. (C) HUVEC treated with VEGF 10 ng/ml for 5 min was stained with p-Tyr 996 KDR antibody in red. (D) HUVEC was treated with bFGF 20 ng/ml and then stained with p-Tyr 996 KDR antibody in red. (E) HUVEC was pretreated with PP2 at 5 mM for 1 h and then stained with p-Tyr 996 KDR antibody in red. (F) HUVEC was pretreated with PP2 at 5 mM for 1 h and then with VEGF 10 ng/ml for 5 min and stained with p-Tyr 996 KDR antibody in red. The nuclei of the cells are stained with DAPI and appear blue. Magnification of images is noted in the lower right corner.
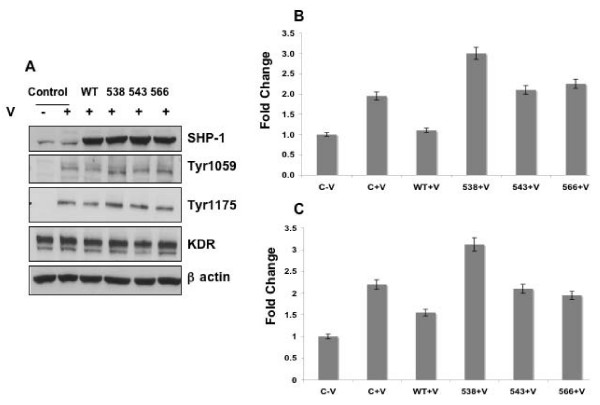
Figure 9
Effect of SHP-1 mutations on de-phosphorylation of tyrosine residues on KDR. (A) HUVEC was transfected with the following plasmids control pCDNA (C) or SHP-1 wildtype (WT) or SHP-1 Y538 or SHP-1 Y543 or SHP-1 Y566 mutants using nucleofector based electroporation. After 48 hrs. the cells were starved overnight in EBM medium without serum. Subsequently the cells were stimulated with VEGF for 5 min. Cell lysates were collected and expression of SHP-1 was confirmed. The same lysates were immunoblotted with antibodies against p-Tyr 1059 and p-Tyr 1175 of KDR. Total KDr and β-actin levels were also determined. NIH Image quantitation data of (B) fold change in Tyr 1059 and (C) fold change in Tyr 1175 of KDR normalized with respect to total KDR. A representative image is shown the experiment was repeated three times.