
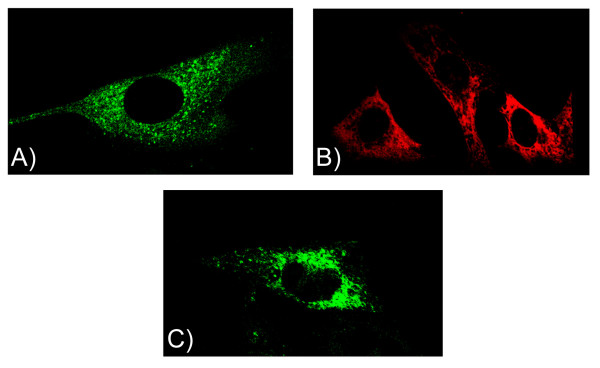
Figure 1
The Cellular Localization of the α1D-AR in Human Aortic Smooth Muscle Cells. Panel A; Human aortic smooth muscle cells were infected with an α1D-AR/GFP expressing virus. Panel B; Immunofluorescence localization of the α1D-AR in human aortic smooth muscle cells. Panel C; Rat 1 Fibroblasts were infected with an α1D-AR/GFP expressing virus. Adenoviral infection and immunostaining were carried out as described in Methods. Localization patterns were visualized with laser scanning confocal microscopy.
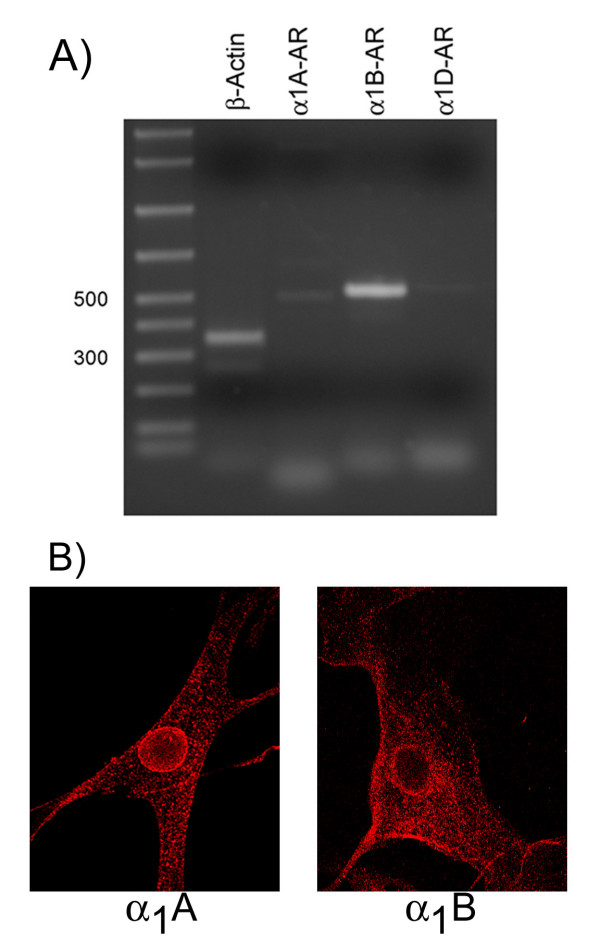
Figure 2
Panel A; RT-PCR Measurement of α1-AR mRNA in Human Aortic Smooth Muscle cells. Panel B; Immunolocalization of the α1-ARs in human aortic smooth muscle cells. Reverse transcription and PCR analysis and immunocytochemistry were performed as described in Methods.
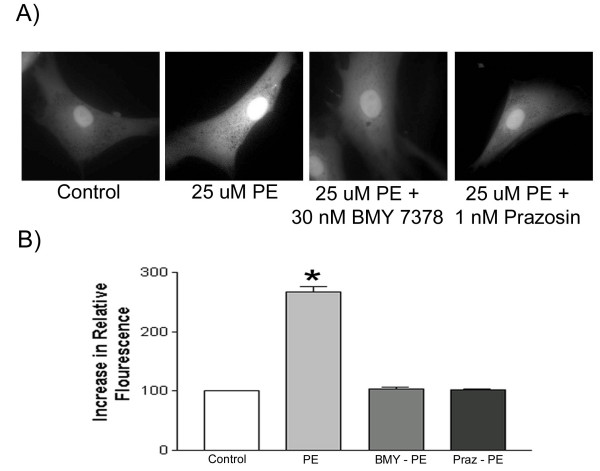
Figure 3
Effect of Phenylephrine on Intracellular Calcium Levels in Human Aortic Smooth Muscle Cells. Human aortic smooth muscle cells were loaded with Calcium Green 1 AM for 1 hr. The ability of 25 uM phenylephrine to increase intracellular calcium was studied alone and following treatment with either 1 nM prazosin or 30 nM BMY 7378. Experiments were carried out as described in Methods. The results of a typical imaging study are presented along with a graphical summary of the statistical analysis of four independent experiments. Data were analyzed by a one-way ANOVA followed by post hoc testing. * Indicates a statistically significant difference from the untreated control.
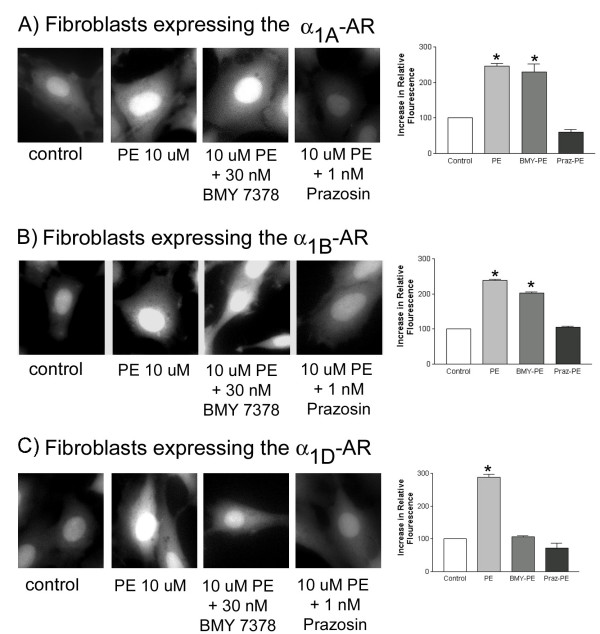
Figure 4
Effect of Phenylephrine on Intracellular Calcium Levels in Stably Transfected Rat 1 Fibroblasts. Rat 1 Fibroblasts, stably transfected with each of the α1-ARs, were loaded with Calcium Green 1 AM for 1 hr. The ability of 10 uM phenylephrine to increase intracellular calcium was studied alone and following treatment with either 1 nM prazosin or 30 nM BMY 7378. Experiments were carried out as described in Methods. The results of a typical imaging study are presented along with a graphical summary of the statistical analysis of four independent experiments. Data were analyzed by a one-way ANOVA followed by post hoc testing. * Indicates a statistically significant difference from the untreated control.
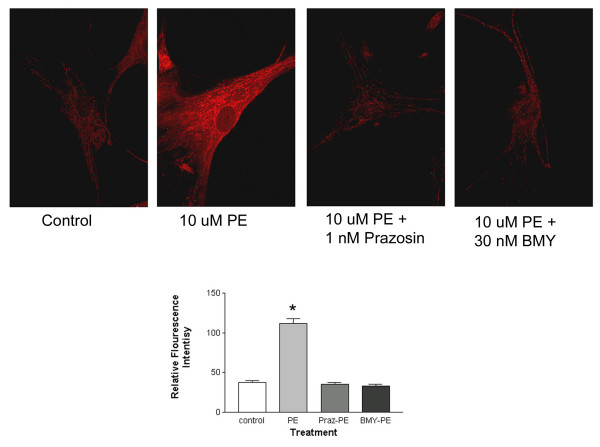
Figure 5
Effect of Phenylephrine on the Levels of Reactive Oxygen Species Levels in Human Aortic Smooth Muscle Cells. Human aortic smooth muscle cells were loaded with Mitotracker ROS for 20 min. The ability of 10 uM phenylephrine to increase the levels of reactive oxygen species was studied alone and following treatment with either 1 nM prazosin or 30 nM BMY 7378. Experiments were carried out as described in Methods. The results of a typical imaging study are presented along with a graphical summary of the statistical analysis of four independent experiments. Data were analyzed by a one-way ANOVA followed by post hoc testing. * Indicates a statistically significant difference from the untreated control.
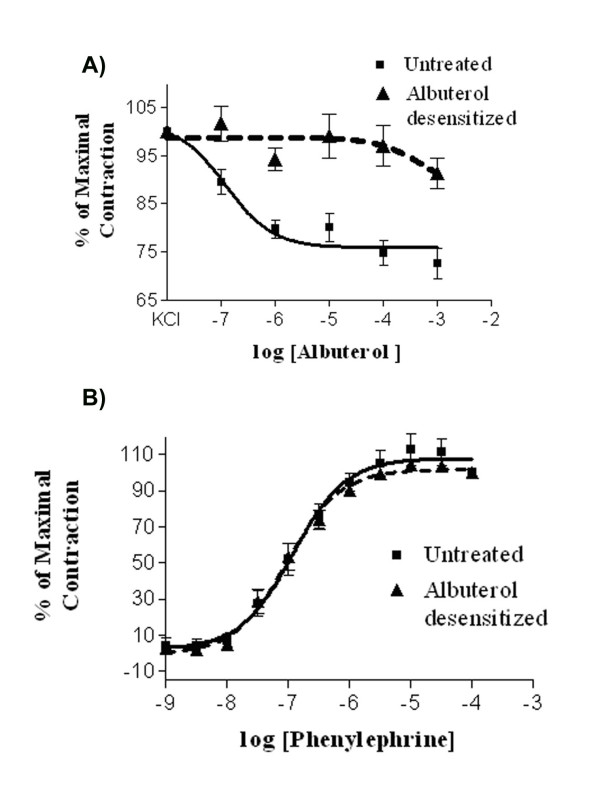
Figure 6
Effect of the Albuterol Pretreatment of Phenylephrine-Induced Contraction of the Rat Aorta. Panel A; Log-dose response curves of the ability of albuterol to relax the rat aorta. The aorta was contracted with KCl and the albuterol responses were assessed in control blood vessels and in those vessels desensitized by incubation with 1 uM albuterol for 12 hr. Data are the mean +/- the SEM of 10 (control) or 13 (desensitized) experiments. Panel B; Log-dose response curves for the ability of phenylephrine to induce contraction of the aorta following desensitization with albuterol. Data are the mean +/- the SEM of 6 independent experiments.