
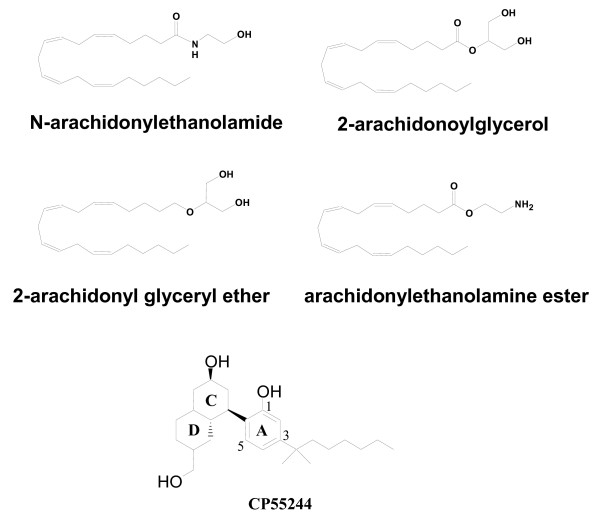
Figure 1
Structures of Endocannabinoids and CP55244. The structures of anandamide (N-arachidonylethanolamide), 2-arachidonoylglycerol (2-AG), nolandin ether (2-arachidonyl glyeryl ether, 2-AGE), and virodhamine (arachidonylethanolamine ester) are shown. The non-classical cannabinoid, CP55244 is depicted with the accepted numbering and ring nomenclature.
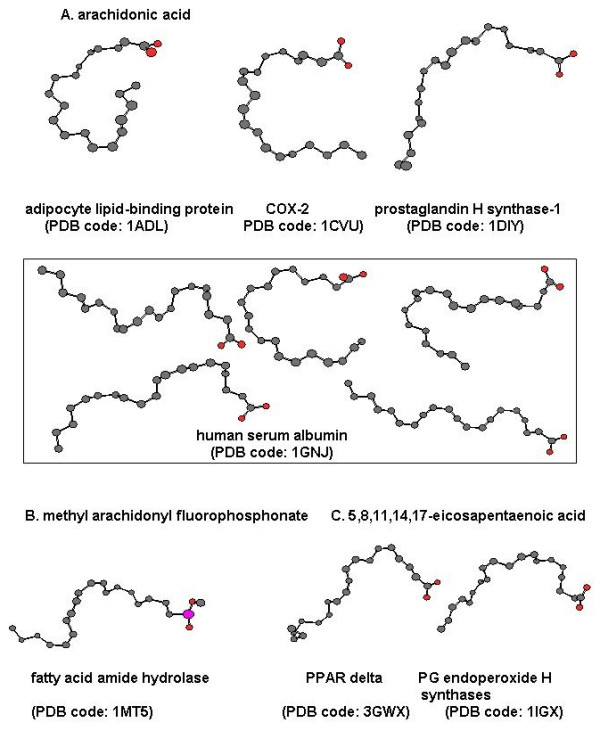
Figure 2
Various conformations of arachidonyl derivatives in complex with proteins as found within the crystal structures of enzymes and binding proteins. The National Library of Medicine Protein Structure Data Base was searched for structures of arachidonic acid and its metabolites and analogs determined from X-ray crystal structures of known enzymes and binding proteins. (A) Arachidonic acid in complex with adipocyte lipid binding protein (1ADL), cyclooxygenase active site of COX-2 (ICVU), prostaglandin H2 synthase-1 (1DIY), and human serum albumin (1GNJ); (B) Methyl arachidonyl fluorophosphonate in complex with fatty acid amide hydrolase (1MT5); (C) 5,8,11,14,17-Eicosapentaenoic acid in complex with peroxisome proliferator activated receptor delta (3GWX) and prostaglandin endoperoxide H synthase-1 (1IGX).
Table 1
Structures and affinity and relative efficacy data for the conformationally restricted anandamide analogs
| Compound | Binding affinity, K i (nM) | GTPγS binding | Adenylyl cyclase |
| CP55244 | 0.11 | Strong stimulation | Strong inhibition |
| Anandamide | 17 | Strong stimulation | Strong inhibition |
| 38 | Strong stimulation | Strong inhibition | |
| 59 | Moderate stimulation | Weak stimulation | |
| 305 | Moderate stimulation | Weak stimulation | |
| 335 | Strong stimulation | Moderate Inhibition | |
| 371 | Moderate stimulation | Weak stimulation | |
| 4960 | No change | Strong inhibition |
Anandamide analogs were selected from a series of compounds developed and tested as reported previously [13]. Binding affinity was determined by the ability to compete for [3H]-CP55940 binding in rat brain membranes, G-protein activation was determined by the ability to stimulate [35S]-GTPγS binding to G-proteins in rat brain membranes, and effector activity was determined by the ability to regulate adenylyl cyclase activity (inhibit through Gi or stimulate through Gs) in purified membranes from N18TG2 cells.
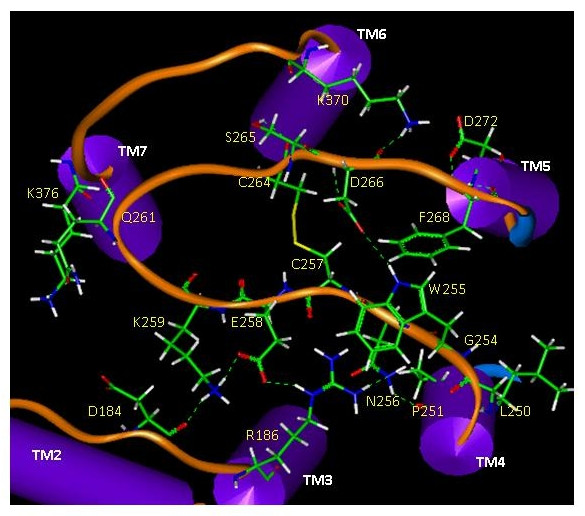
Figure 3
Extracellular loop placement on the human CB1 receptor model illustrating key interacting residues among E1, E2, and E3.
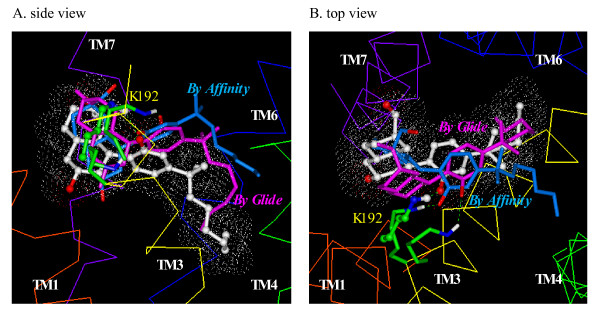
Figure 4
Side (A) and top (B) views of the overlay of the docking modes of CP55244 determined using Glide/Prime (in lavender), Affinity/SA (in cyan) and the previously published CP55244 docking mode (in white). The CB1 receptor helical backbone is represented in Cα trace format. TM1 through TM7 are colored in red, orange, yellow, green, cyan, blue and purple, and the extracellular loops are colored in magenta.
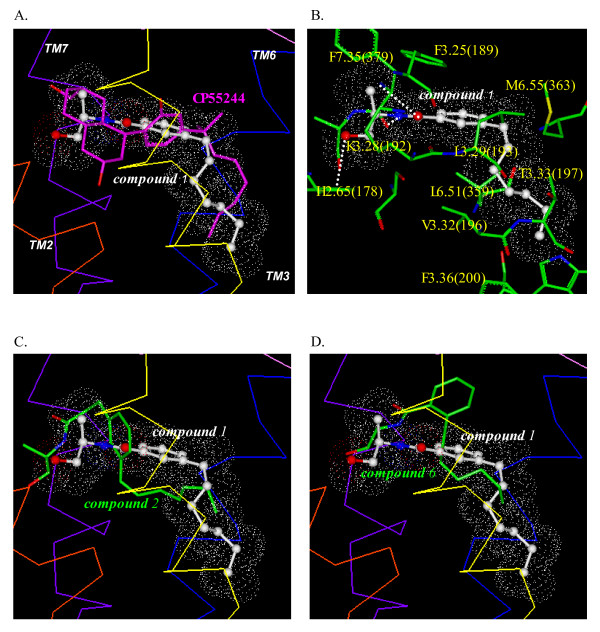
Figure 5
Glide/Prime models of CP55244 compound 1, 2 and 6. (A) Overlay of the Glide/Prime models of CP55244 and compound 1. (B) Key amino acid residues of the CB1 receptor for binding with the Glide/Prime model of compound 1. H-bonding between compound 1 and the binding pocket residues are represented with white dots. (C) Overlay of the Glide/Prime model of compound 2 with compound 1. (D) Overlay of the Glide/Prime model of compound 6 with compound 1.
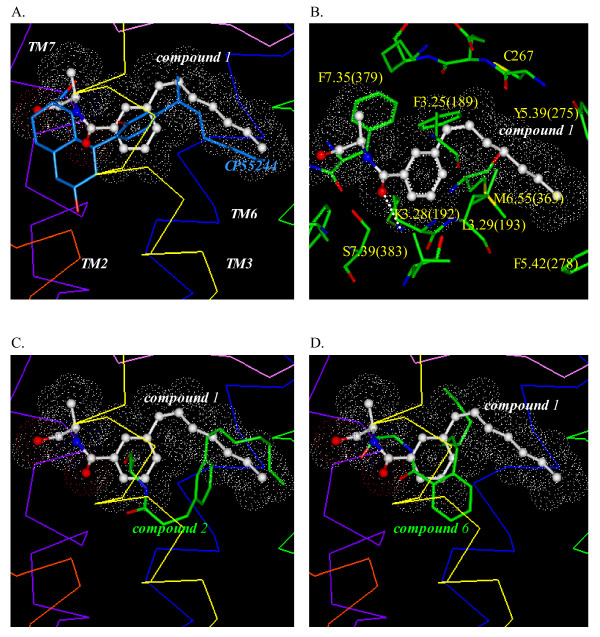
Figure 6
Affinity/SA models of CP55244 and compound 1, 2 and 6. (A) Overlay of the Affinity/SA models of CP55244 and compound 1. (B) Key amino acid residues of the CB1 receptor for binding with the Affinity/SA model of compound 1. H-bonding between compound 1 and the binding pocket residues is represented with white dots. (C) Overlay of the Affinity/SA model of compound 2 with compound 1. (D) Overlay of the Affinity/SA model of compound 6 with compound 1.
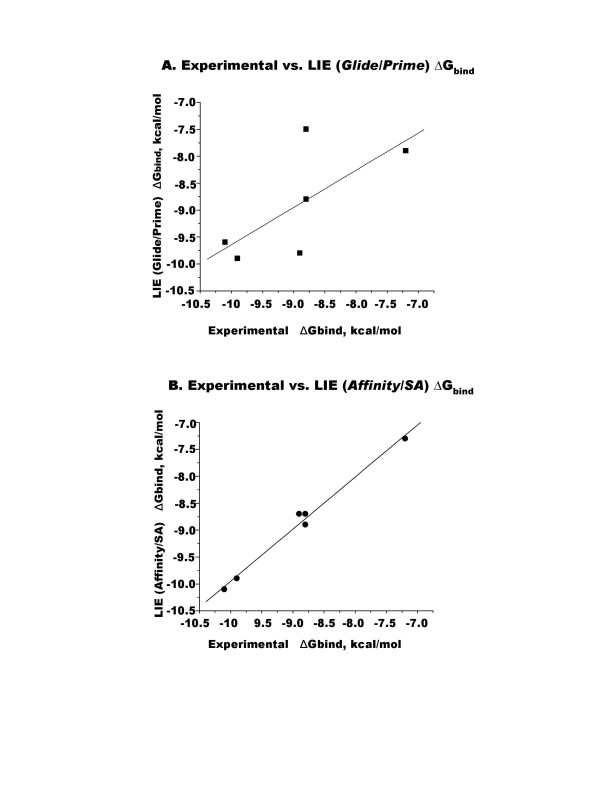
Figure 7
Binding energy correlation between experimental ΔGbind and LIE (Glide/Prime) ΔGbind (A) or LIE (Affinity/SA) ΔGbind (B).
Table 2
Binding free energy comparison between the experimental and LIE (Glide/Prime) or LIE (Affinity/SA) values for compounds 1 through 6
| ΔGbind(kcal/mol) | |||
| Compound | LIE (Glide/Prime) | LIE (Affinity/SA) | Experimental |
| 1 | -9.6 | -10.1 | -10.1 |
| 2 | -9.9 | -9.9 | -9.9 |
| 3 | -9.8 | -8.7 | -8.9 |
| 4 | -8.8 | -8.7 | -8.8 |
| 5 | -7.5 | -8.9 | -8.8 |
| 6 | -7.9 | -7.3 | -7.2 |
The Glide/Prime LIE fit was determined using the following equation with a RMSD of 0.6 kcal/mol: ΔGbind = 0.381<ΔUvdw> + 0.028<ΔUelec> + 1.271ΔSASA. The Affinity/SA LIE fit was determined using the following equation with a RMSD of 0.1 kcal/mol: ΔGbind = 0.348<ΔUvdw> + 0.032<ΔUelec> + 1.084ΔSASA. The Experimental ΔGbind values were calculated from the experimental Ki values (see Table 1) assumed to be equivalent to KD, using ΔGbind = RT ln Ki for T = 298 K.
Table 3
Ligand-receptor non-bonding and H-bonding interactions identified for CP55244 by Affinity and compared with compounds 1, 2, and 6.
| compound | nonbonding interaction energy (kcal/mol) | ||||||||||
| Key Binding Site Residues within 3.5 Å of CP55244 hydrophobic pocket | Potential H-bond forming residues | ||||||||||
| F3.25 (189) | L3.29 (193) | T3.33 (197) | P4.60 (251) | Y5.39 (275) | F5.42 (278) | M6.55 (363) | K3.28 (192) | S7.39 (383) | E (258) | ||
| CP55244 | Coulombic van der Waals Total | -0.06 -1.20 -1.26 | 0.06 -2.21 -2.15 | 0.02 -0.64 -0.62 | 0.00 -0.37 -0.37 | 0.00 -1.20 -1.20 | 0.00 -0.79 -0.79 | 0.00 -0.44 -0.44 | -0.88 -0.54 -1.41 | ||
| compound 1 | |||||||||||
| Pose1 | Coulombic van der Waals Total | 0.00 -1.33 -1.33 | 0.00 -1.64 -1.64 | 0.00 -0.74 -0.74 | 0.00 -0.49 -0.49 | -0.02 -0.75 -0.77 | -1.19 -0.13 -1.32 | ||||
| Pose2 | Coulombic van der Waals Total | 0.01 -1.58 -1.57 | 0.00 -1.79 -1.79 | -0.01 -0.35 -0.36 | 0.00 -0.46 -0.46 | -0.01 -0.45 -0.46 | -0.02 -0.74 -0.76 | -1.14 -0.59 -1.73 | |||
| Pose3 | Coulombic van der Waals Total | -0.01 -2.11 -2.12 | 0.20 -0.75 -0.55 | 0.01 -0.45 -0.44 | 0.09 -1.09 -1.00 | 0.00 -0.51 -0.51 | 0.01 -0.78 -0.77 | -1.33 -0.74 -2.07 | -0.53 -0.83 -1.36 | ||
| Pose4 | Coulombic van der Waals Total | -0.02 -1.55 -1.57 | 0.00 -0.19 -0.19 | 0.01 -0.57 -0.56 | 0.01 -0.48 -0.47 | 0.02 -0.87 -0.85 | -1.21 -0.60 -1.81 | ||||
| Pose5 | Coulombic van der Waals Total | -0.01 -1.32 -1.33 | -0.02 -1.85 -1.87 | 0.00 -0.83 -0.83 | 0.00 -0.29 -0.29 | 0.38 -0.90 -0.52 | 0.00 -0.43 -0.43 | -0.02 -1.01 -1.03 | -2.39 0.09 -2.30 | -0.20 -1.15 -1.35 | |
| compound 2 | |||||||||||
| Pose1 | Coulombic van der Waals Total | -0.02 -1.48 -1.50 | 0.00 0.02 0.02 | 0.00 -0.37 -0.37 | -0.01 -0.84 -0.85 | -1.39 -0.88 -2.26 | -0.71 0.06 -0.65 | ||||
| Pose2 | Coulombic van der Waals Total | 0.01 -0.91 -0.90 | -0.01 -0.06 -0.07 | -0.03 -1.01 -1.04 | -0.98 -0.66 -1.64 | -0.63 -0.61 -1.24 | |||||
| Pose3 | Coulombic van der Waals Total | -0.04 -1.67 -1.71 | -0.03 -0.75 -0.78 | 0.00 -0.67 -0.67 | -0.02 -1.22 -1.24 | -1.33 -0.48 -1.81 | |||||
| Pose4 | Coulombic van der Waals Total | 0.07 -2.85 -2.79 | 0.00 -0.29 -0.29 | 0.01 -0.91 -0.90 | |||||||
| Pose5 | Coulombic van der Waals Total | 0.05 -0.77 -0.72 | 0.02 -1.58 -1.56 | -0.01 -1.21 -1.22 | -1.16 -0.51 -1.67 | -0.65 -0.25 -0.90 | |||||
| compound 6 | |||||||||||
| Pose1 | Coulombic van der Waals Total | -0.01 -0.88 -0.89 | -0.02 -1.52 -1.54 | 0.00 -0.09 -0.09 | -0.01 -0.91 -0.92 | -2.29 -0.51 -2.80 | |||||
| Pose2 | Coulombic van der Waals Total | 0.01 -1.12 -1.11 | -0.04 -1.76 -1.80 | -0.01 -0.45 -0.46 | 0.00 -0.89 -0.89 | -2.22 -1.06 -3.28 | |||||
| Pose3 | Coulombic van der Waals Total | 0.04 -0.89 -0.85 | 0.00 -1.31 -1.31 | 0.00 -1.04 -1.04 | -1.23 -0.55 -1.78 | -0.39 -1.41 -1.80 | |||||
| Pose4 | Coulombic van der Waals Total | 0.02 -0.76 -0.74 | 0.00 -1.39 -1.39 | -0.01 -0.77 -0.78 | -1.16 -0.47 -1.63 | -0.52 -1.23 -1.75 | |||||
| Pose5 | Coulombic van der Waals Total | 0.06 -0.93 -0.87 | 0.00 -1.36 -1.36 | 0.00 -0.94 -0.94 | -1.06 -0.57 -1.64 | -0.46 -0.92 -1.38 | |||||
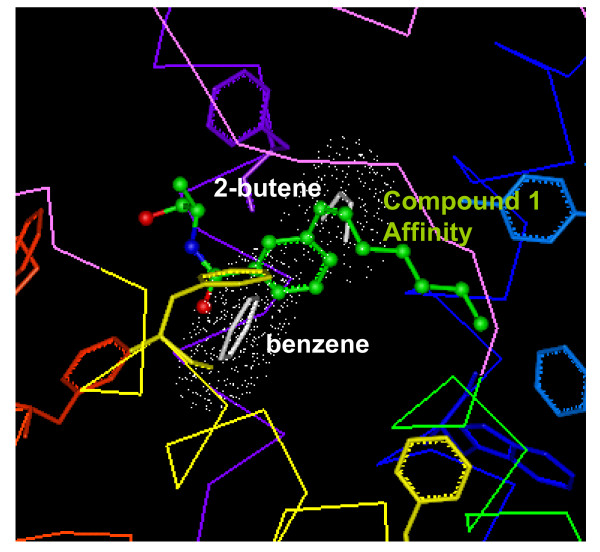
Figure 8
Comparison of the best position of the benzene and cis-2-butene moieties from MCSS with the Affinity/SA model of compound 1. Aromatic residues at or around the ligand binding pocket are represented including F3.25(189) and F7.35(379) identified as potentially important residues for aromatic stacking with compound 1.
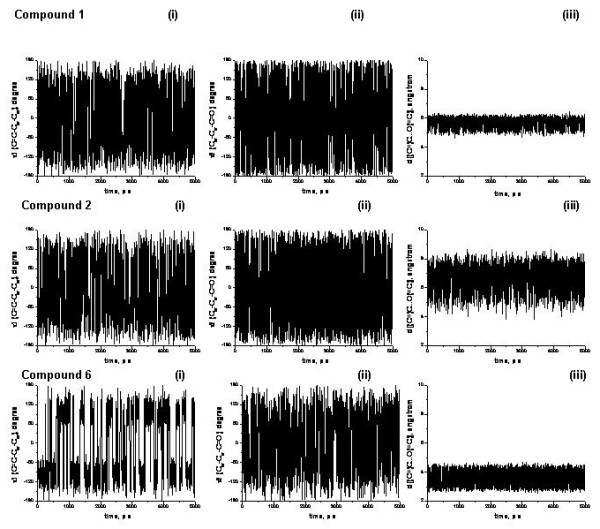
Figure 9
Ligand flexibility estimated from MD simulations for compounds 1, 2 and 6. The torsion angles around the aromatic ring, defined as τ 1(C = C-Car-Car) and τ 2(Car-Car-C = O), and the distance between the first carbon atom of the 1-heptenyl tail and the amide oxygen atom, defined as d [(C =)C...O(= C)] during a 5 ns MD simulation of compounds 1, 2, and 6. To resemble the highly hydrophobic environment within the binding pocket, the dielectric constant ε of 4.0 was used for the electrostatic interaction energy.