
Figure 1
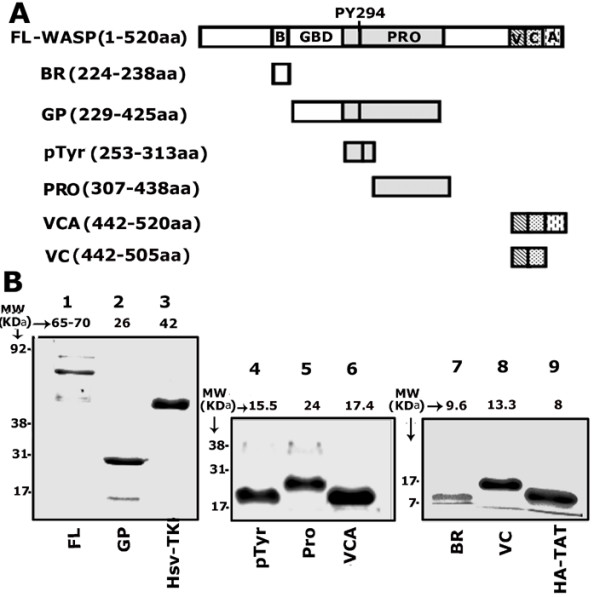
A. Schematic diagram demonstrating various WASP constructs generated in HA-TAT expression vector. The domain organization of WASP is shown in full length WASP (WASP-FL). These domains (BR, basic region; GBD, GTPase binding domain; GP, GTPase binding domain and proline rich domain; Pro, proline-rich region; Verpolin-like, central, and acidic domain [VCA]; Verpolin-like, and central domain [VC]) are cloned separately into the HA-TAT expression vector. The number within the parentheses indicates the first and last amino acid of the corresponding WASP peptide. B. SDS-PAGE analysis demonstrates the purified TAT-fused WASP and control (Hsv-TK and HA-TAT) proteins. TAT-fused proteins were subjected to 8% (lanes 1–3) and 15% (lanes 4–9) SDS-PAGE and stained with Coomassie blue. The numbers on the left of each panel represent the standard molecular weight (MW) markers (kDa). The numbers on the top of each lane indicate the apparent molecular mass (kDa) of the purified protein.
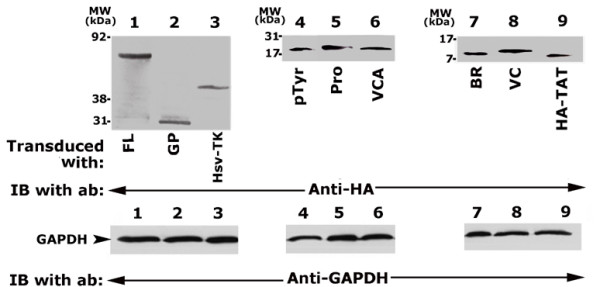
Figure 2
Immunoblotting analysis of the levels of transduced proteins in osteoclasts with HA-antibody. Osteoclasts were transduced with the WASP peptides as shown below the figures. Osteoclast lysates (~200 μg) were immunoblotted with an antibody to HA to determine the levels of transduced proteins (Top panel). The immunoblot shown in the top panel was stripped and blotted with a GAPDH antibody for normalization (bottom panel). The results shown are representative of three independent experiments.
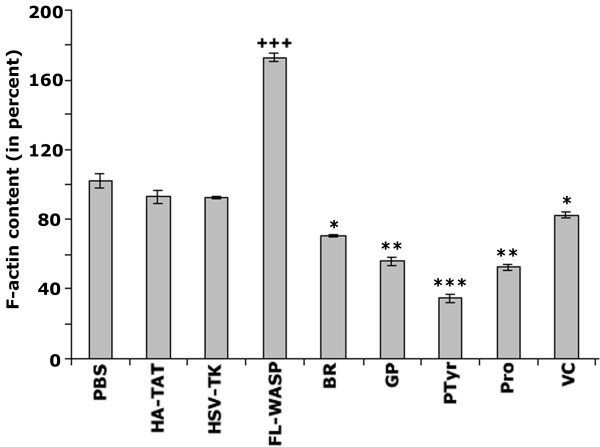
Figure 3
Measurement of F-actin content by rhodamine phalloidin binding in osteoclasts. Cells were grown in 24 well-tissue culture plates, and three to four wells were used for each treatment indicated in the figure. The results presented are mean ± SE for three experiments. *** p < 0.0001 versus PBS-treated as well as HA-TAT, Hsv-TK, and FL-WASP transduced osteoclasts; +++ p < 0.001, ** p < 0.01, *p < 0.05 versus PBS-treated as well as HA-TAT and Hsv-TK transduced osteoclasts.
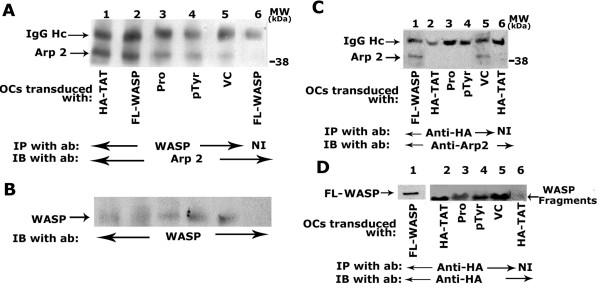
Figure 4
Analysis of the interaction of Arp2 with the endogenous WASP and transduced peptides. Osteoclasts were transduced with the WASP peptides as shown below the figures. Lysates were immunoprecipitated with a WASP (A and B) or HA (C and D) antibody. A and B: WASP immunoprecipitates were first immunoblotted with an antibody to Arp2 (A) and subsequently stripped and blotted with an antibody to WASP (B). C and D: HA-immunoprecipitates were divided into two halves; one half was immunoblotted with an Arp 2 antibody (C) and the other half was subjected to 8% (D, lane 1) and 15% (D, lanes 2–5) SDS-PAGE. Immunoblotting was performed with a HA-antibody (D) to detect the levels of transduced proteins immunoprecipitated in each lane. Immunoprecipitation with a nonimmune serum is shown in lane 6 (A-D). The results represent one of three experiments performed from three separate osteoclast preparations.
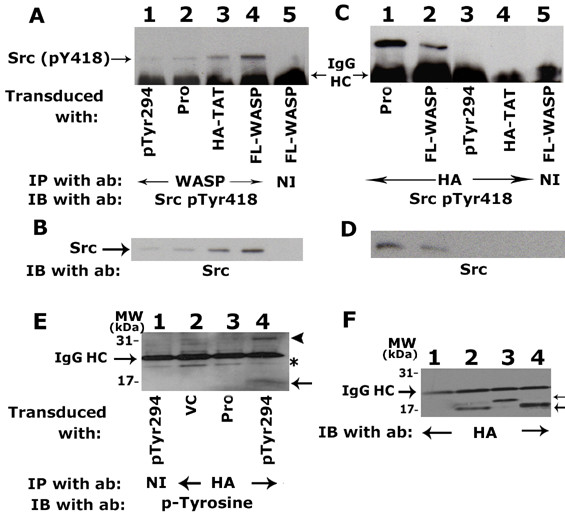
Figure 5
Analysis of the interaction of c-Src with the endogenous WASP and transduced peptides. A-D: Osteoclasts were transduced with the WASP peptides as shown below the figures. Lysates were immunoprecipitated with a WASP (A and B) or HA (C and D) antibody. Immunoprecipitates were first immunoblotted with an antibody to Src pTy418 (A and C). Subsequently, blots were stripped and blotted with an antibody to c-Src (B and D) to detect the levels of c-Src coprecipitated with WASP or HA immunoprecipitates. Immunoprecipitation with a non-immune serum (NI) is shown in lane 5 (A-D). E and F: HA-immunoprecipitates were subjected to 15% SDS-PAGE. Immunoblotting was performed with a phosphotyrosine (p-Tyrosine; panel E) to detect the phosphorylation levels of transduced proteins. Subsequently, blot was stripped and blotted with a HA- antibody (F) to determine the levels of transduced proteins immunoprecipitated in each lane. An asterisk in Fig. 5E indicates coprecipitation of a non-specific protein with HA and non-immune (NI) immunoprecipitates (lanes 1–4). Immunoprecipitation with a non-immune serum (NI) is shown in lane 1 (E and F). The results represent one of three experiments performed from three separate osteoclast preparations.
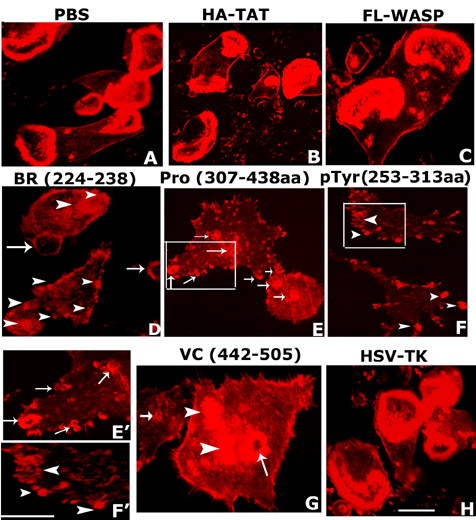
Figure 6
The effects of transduction of various TAT-fused WASP peptides on sealing ring formation. Osteoclasts were transduced with indicated TAT-fused peptides or treated with PBS as a control. Confocal microscopy images of osteoclasts stained for actin are shown. Sealing ring was observed in osteoclasts treated with PBS (A) or transduced with HA-TAT (B), FL-WASP (C), and HSV-TK. Sealing ring formation is reduced in osteoclasts transduced with WASP peptides consisting of BR (D), Proline-rich region (E), pTyr amino acid (F), and VC domain (G). The areas that are magnified in E' and F' are shown with a white box in Figs E and F. Arrows and arrowheads indicate small ring-like structures and actin aggregates or patches, respectively (D, E, F, E', F', and G'). Scale Bar: 50 μm. The results shown are representative of three independent osteoclast preparations and experiments.
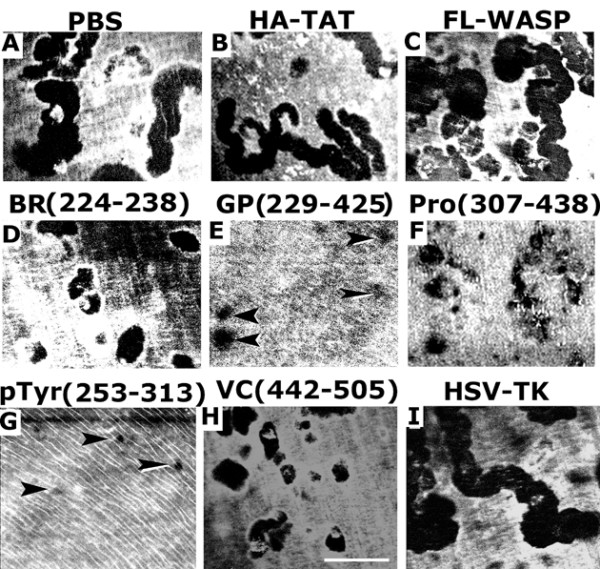
Figure 7
The effects of TAT-fused WASP peptides transduction on osteoclast bone resorption. Confocal images of the resorption pits are shown. Osteoclasts were transduced with indicated TAT-fused peptides (B-I) or treated with PBS (A) for 48 h. Pits were scanned under confocal microscopy. Resorption pits were seen as dark spots. These results represent one of three separate experiments performed with the same results. Scale bar-25 μM
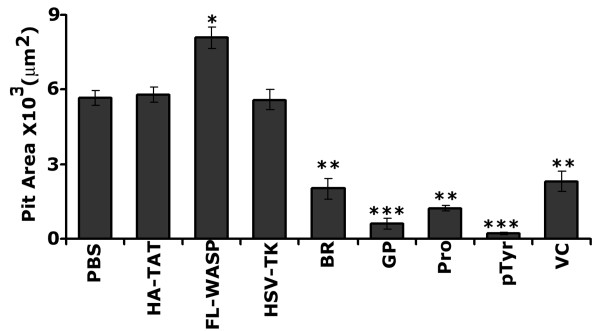
Figure 8
Quantification of resorption pit generated in vitro by osteoclasts after various treatments. About 20–25 pits/slice from each experiment were scanned to determine pit area. Group data of pit area from confocal microscopy of pits on multiple dentine slices from three osteoclast preparations are shown. ***p < 0.0001 vs. PBS-treated as well as HA-TAT, Hsv-TK, and FL-WASP transduced osteoclasts; **p < 0.001; * p < 0.05 vs. PBS-treated as well as HA-TAT, Hsv-TK transduced osteoclasts.