
Figure 1
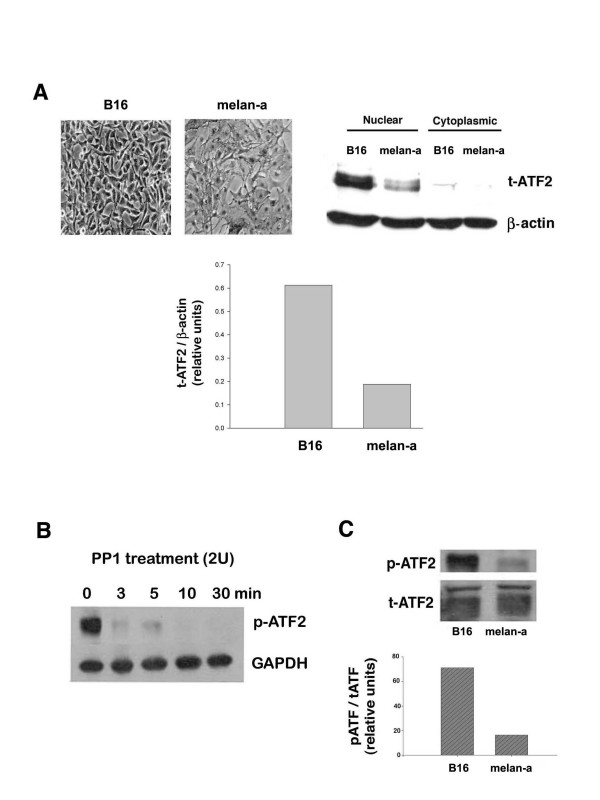
ATF-2 expression and phosphorylation in B16 malignant melanoma vs. non-malignant melan-a mouse melanocytes. A. Subcellular distribution and relative amount of ATF-2 in B16 mouse melanoma compared with nonmalignant melan-a cells. B16 cells and Melan-a cells were harvested at 80% confluence, and cytoplasmic and nuclear protein were isolated using Pierce NE-PER™ nuclear and cytoplasmic extraction reagents described in Materials and Methods. Cytoplasmic and nuclear proteins (10 μg) from both cell lines were analyzed by western blotting using polyclonal ATF-2 antibody. The autoradiogram (top right panel) was scanned using a Molecular Dynamics densitometer, and after correcting for the amount of β-actin, the relative amount of total ATF-2 in each sample was determined (bottom). The data shown are from a representative experiment, which was replicated three additional times with similar results. The top left panel illustrates the morphology of the two different cell lines prior to harvest (phase contrast, 20X). B. Phosphatase digestion of ATF-2. Nuclear extracts prepared from B16 cells were treated with 2 units of PP1 at 37°C. The reaction was stopped by the addition of SDS-sample buffer at the indicated incubation times. The samples were boiled, then blotted and detected using phospho-ATF-2 antibody. GAPDH was used as an internal control. The data are representative of three individual experiments with similar results. C. Relative amount of phospho- ATF-2 in B16 cells vs. melan-a cells. Cellular extracts (20 μg) from B16 cells and cellular extracts (40 μg) from melan-a cells (minimal amount of protein that allowed signal detection of phosphorylated ATF-2) were analyzed by western blotting using anti-ATF-2 polyclonal antibody and anti-phospho-ATF-2 polyclonal antibody, as described in Materials and Methods. The autoradiogram (top) was scanned using a Molecular Dynamics densitometer, and after correcting for the amount of total ATF-2 protein, the relative amount of phospho-ATF-2 protein in both cell lines was determined (bottom). The data shown are from a representative experiment, which was replicated three additional times with similar results.
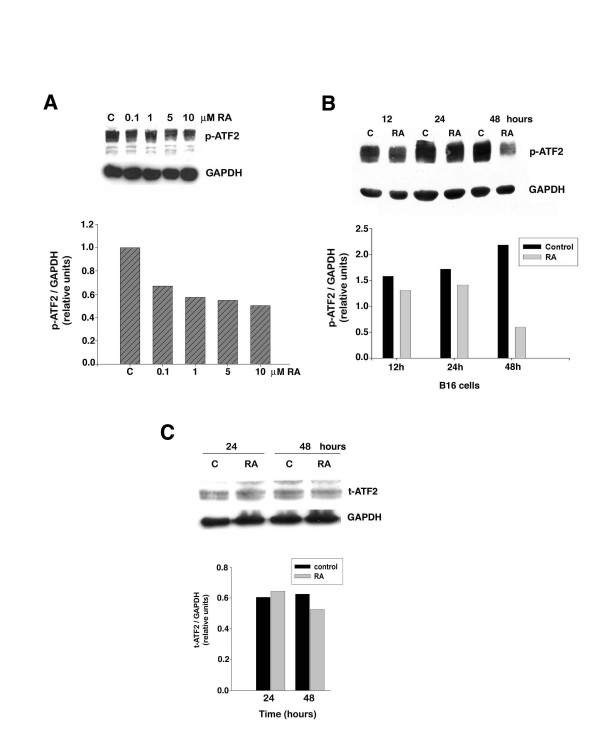
Figure 2
RA inhibits ATF-2 phosphorylation in B16 mouse melanoma cells. B16 cells were treated with either vehicle (DMSO) (C-control) or RA. At the end of the indicated incubation times, cells were harvested and protein (40 μg) from each group was analyzed by western blotting using polyclonal anti-phospho-ATF-2 or total ATF-2 antibodies as described in Materials and Methods. The relative amount of phospho- or total ATF-2 protein in each sample was determined by densitometry using GAPDH as an internal control. The data shown are from a representative experiment, which was replicated three additional times with similar results. A. Cells were treated with the indicated concentrations of RA and harvested after a 48-hour incubation. B. Cells were treated for the indicated time periods with 10 μM RA. C. The effect of different treatment times with 10 μM RA on total ATF-2 protein level.
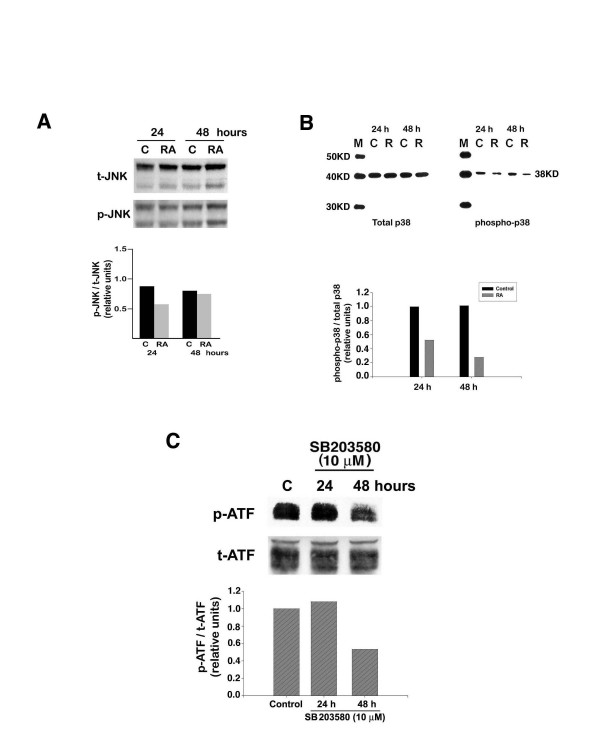
Figure 3
Regulation of ATF-2 phosphorylation by p38 MAPK and inhibition by RA. B16 cells were treated with 10 μM RA for the indicated times. Cells were then harvested, extracted, and protein from each sample examined for total and phospho-specific JNK (A) or total and phospho-specific p38 (B) by western blotting as described in Materials and Methods. The results shown are representative of three individual experiments, which gave similar results. To determine the effect of inhibition of p38 enzyme activity on ATF-2 phosphorylation, we treated cells with or without 10 μM SB203580. At the indicated times, cells were harvested, extracted, and protein from each sample was examined for phospho-specific ATF-2 using western blotting as described in Materials and Methods. The result (C) shown is representative of three individual experiments, which yielded similar results.
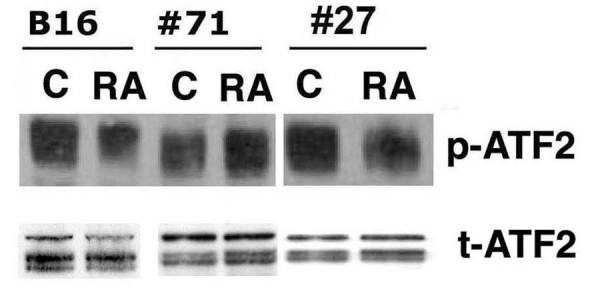
Figure 4
Lack of RA-induced AP-1 activity antagonizes the ability of RA to inhibit ATF-2 phosphorylation. Wild-type B16 cells, an A-Fos expressing clone (#71), and a non-expressing A-Fos clone (#27) were treated with or without 10 μM RA for 24 hours and 48 hours. Cells were harvested and protein (40 μg) from each group was analyzed by western blotting using total or anti-phospho-ATF-2 antibody as described in Materials and Methods. The data shown are from a representative experiment, which was replicated three additional times with similar results.
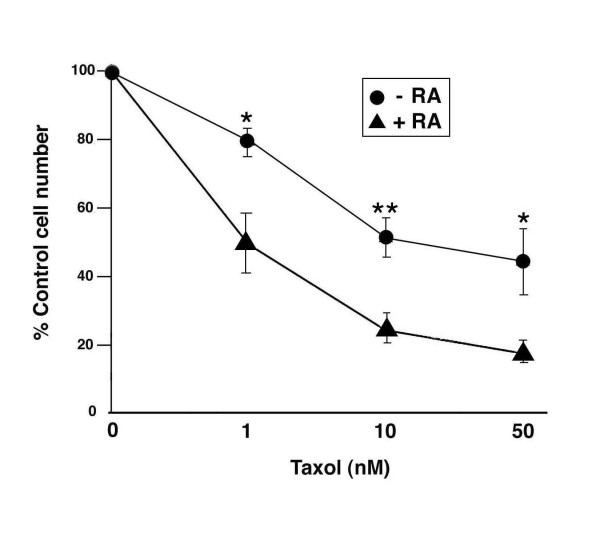
Figure 5
RA increases the sensitivity of B16 cells to taxol-mediated inhibition of cell growth. B16 cells were seeded at 2.4 × 10⁴/35 mm culture dish. Following a 24-hour attachment period, cells were treated with either vehicle (DMSO) or 10 μM RA for 48 hours. After this preincubation period, the cells were refed with growth medium containing different concentrations of taxol and incubated for 16 hours. At the end of this second incubation, the cell number in each group was determined through the use of crystal violet assay, and corrected by the initial cell number seeded. The data are presented as the mean ± SEM (error bars) of triplicate dishes and are presented as percent of control (DMSO or RA pre-treated) cell number. * p < 0.05; ** p < 0.01.