
Figure 1
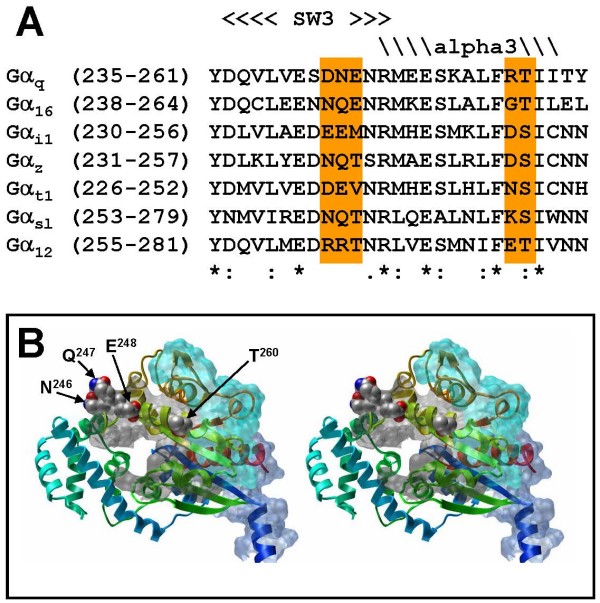
Sequence alignment and molecular model of Gα16.(A) The sequences corresponding to the switch III region and α3 helix of various Gα's were aligned. The consensus sequences are indicated as asterisks, colons and dots for strictly conserved, closely related and barely related residues among the candidates. The regions corresponding to the two clusters of putative PLC-interacting residues of Gαq are highlighted in orange. (B) A stereogram of the constructed molecular model of Gα16 is shown. Portions of the molecular surface were colored as blue, grey and cyan for the regions interacting with receptor, effector, or both, respectively, based on the studies of different G proteins. The side chains of the residues studied here are shown in spheres as indicated (except for Gly259 which is devoid of any side chain).
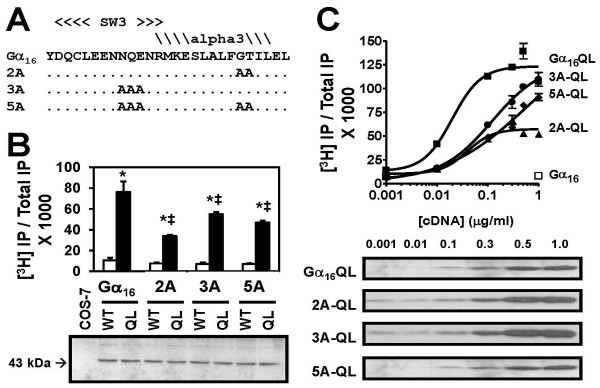
Figure 2
Effects of 2A, 3A and 5A mutations on Gα16-mediated PLCβ activation. (A) Positions of the alanine mutations on the corresponding Gα16 mutants were shown as an alignment with the Gα16 sequence. Identical residues were simplified with dots. (B) Top: COS-7 cells were transiently transfected with 0.25 μg/ml cDNAs encoding the wild type or QL mutants of Gα16, 2A, 3A and 5A. Transfectants were labeled with [3H]myo-inositol and assayed for IP accumulation. * IP accumulation stimulated by constitutively active mutants was significantly higher than that obtained with their wild type counterparts; ‡ Constitutive activity was significantly lower than that obtained with Gα16QL; Tukey-Kramer's test, p < 0.05. Bottom: Transfected COS-7 cells were harvested and membrane proteins were extracted for immunodetection. A Gα16-specific custom antiserum was used for recognition of Gα16 and its mutants. Fluorographs were visualized with the ECL chemiluminescence detection kit. Untransfected COS-7 cells served as the negative control. Two separate sets of transfected cells yielded similar results. (C) COS-7 cells were transfected with increasing amounts of cDNA encoding Gα16QL, 2A-QL, 3A-QL or 5A-QL. Empty vector pcDNA3 was added to balance the amount of cDNA used in the transfection for each sample. Gα16-transfected cells served as the negative control (hollow square). Top: IP production increased dose-dependently with increasing expression levels of the constitutively active form of alanine mutants and Gα16. Bottom: Expression level of constitutively active counterparts of Gα16 and its mutants were determined by Western blotting.
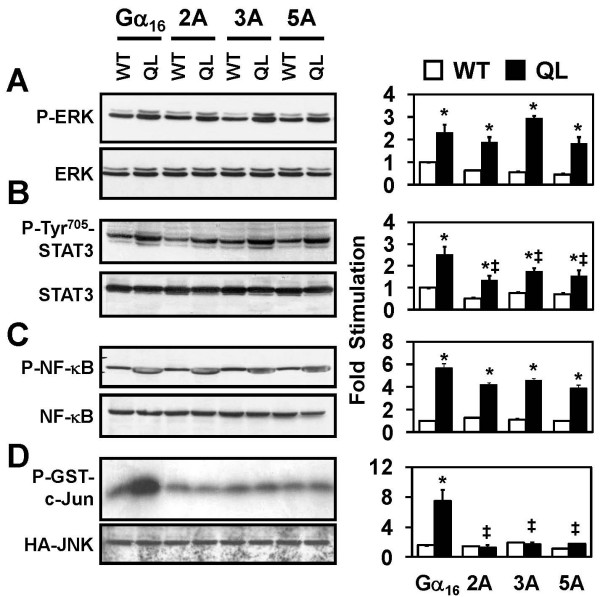
Figure 3
Role of Gα 16 mutants in STAT3, ERK1/2, NF-κB and c-Jun phosphorylation. HEK293 cells were transfected with pcDNA3, wild type or QL mutants of Gα16, 2A, 3A or 5A. The transfectants were deprived of serum overnight, and cell lysates were prepared for SDS-PAGE separation. Phosphorylated form or native ERK1/2 (A), STAT3 (B), and NF-κB (C) were detected by Western blotting as indicated. (D) For measuring Gα16-triggered JNK activity, COS-7 cells were transiently transfected with each of the constructs mentioned together with a plasmid encoding HA-tagged JNK. Serum starvation was performed as mentioned and JNK assay was performed as described in Methods. Expression of tagged JNK was determined by anti-HA antibody. The activation of JNK was monitored by detecting the phosphorylation of GST-fused-cJun. The fold induction of the phosphorylation of various effectors were quantified and plotted on the right hand side for comparisons. * QL counterparts of the mutants stimulate phosphorylation of the detected proteins significantly over cells expressing wild type complements (Tukey-Kramer's test, p < 0.05). ‡ QL counterparts of 2A-, 3A- and 5A-stimulated phosphorylation were significantly lower than that of Gα16QL (Tukey-Kramer's test, p < 0.05).
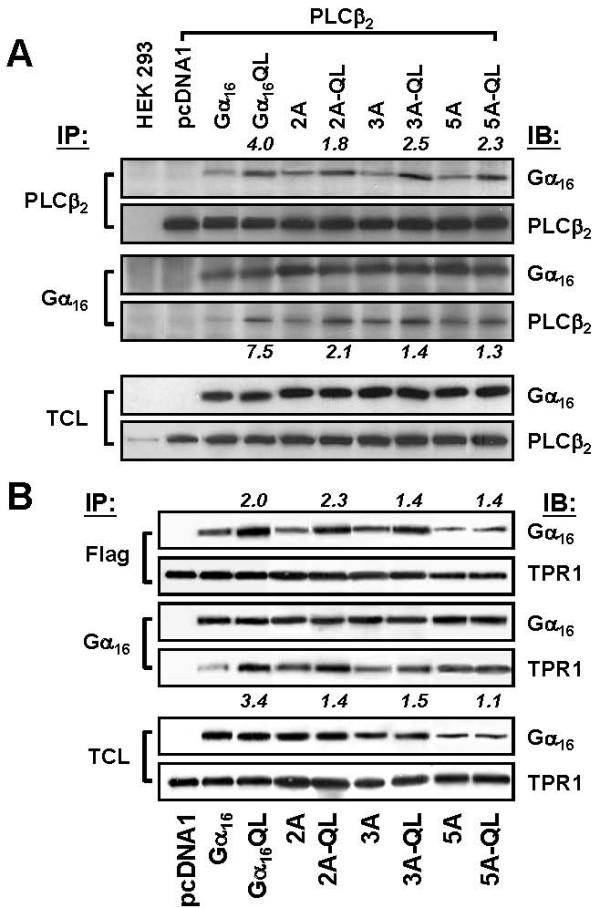
Figure 4
The alanine mutants co-immunoprecipitate with TPR1 and PLCβ2. (A) HEK293 cells were co-transfected with PLCβ2 and the Gα constructs as indicated at the bottom of the blots. Total cell lysates (TCL) from each condition were subjected to immunoprecipitation using either anti-PLCβ2 or anti-Gα16 antiserum followed by protein G-agarose. Well-washed immunoprecipitates were subjected to SDS-PAGE and the proteins of interest were detected using specific antibodies as indicated. TCL were separately run on blots for detecting the corresponding protein expressions. Two separate sets of transfected cells yielded similar results. (B) Similar procedures were applied for detecting the interaction between Flag-tagged TPR1 and the Gα constructs as indicated. TCL were subjected to immunoprecipitation using either anti-Flag agarose gel or anti-Gα16 antiserum followed by protein G-agarose. Two separate sets of transfected cells yielded similar results. Band intensities were quantified and figures on the lanes of QL mutants are the fold increase compared with the band on the lane of their corresponding wild-type counterparts.
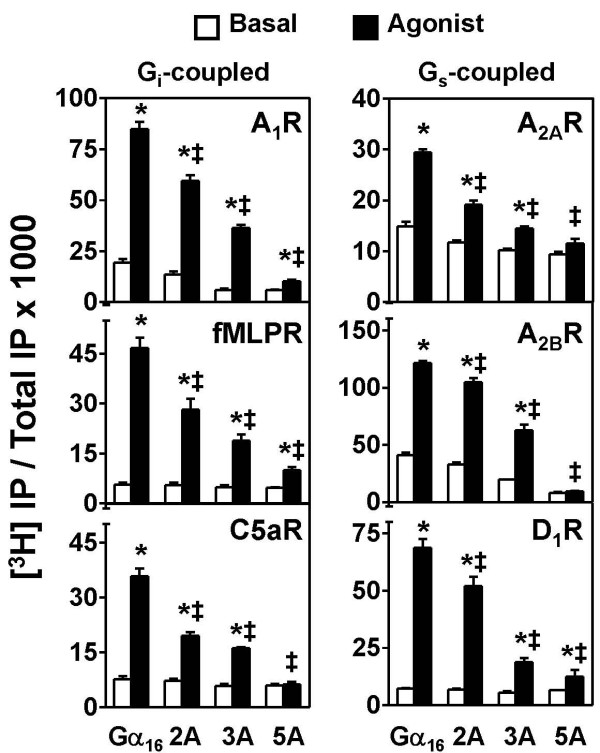
Figure 5
Coupling of alanine mutants of Gα 16 to different categories of G protein-coupled receptors. Individual GPCRs were coexpressed with Gα16, 2A, 3A or 5A in COS-7 cells. Transfected cells were labeled with [3H]myo-inositol and treated with PTX overnight. Cells were then treated with the appropriate receptor agonists (1 μM CHA for A1R, 100 nM C5a for C5aR, 100 nM fMLP for fMLPR, 10 μM adenosine for both A2AR and A2BR, 10 μM dopamine for D1R) for an hour before extraction of accumulated labeled IP. *Agonist significantly stimulated IP production as compared to their corresponding untreated counterparts; Tukey-Kramer's test, p < 0.05. ‡ Agonist-induced responses in mutant-expressing cells were significantly lower than that obtained with Gα16; Tukey-Kramer's test, p < 0.05.
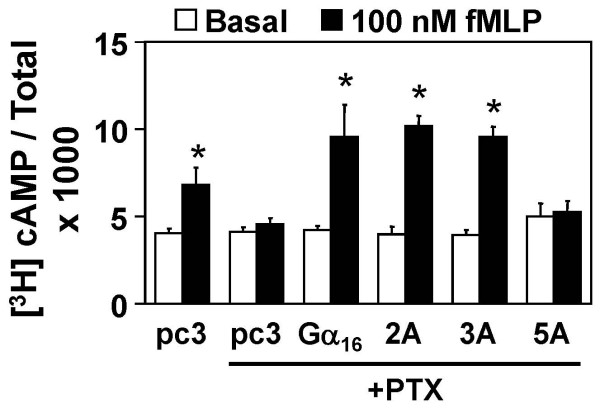
Figure 6
Receptor-induced activation of type II adenylyl cyclase (AC2) mediated by Gα 16 and its mutants. HEK293 cells were cotransfected with cDNAs encoding the AC2 (3 μg/ml), GαsQL (0.015 μg/ml) and fMLPR (3 μg/ml) together with Gα16, 2A, 3A or 5A. Cells were labeled with [3H]adenine and treated with or without PTX (100 ng/ml) overnight. cAMP accumulation was assayed in response to the treatment with 100 nM fMLP for 1 h. * cAMP accumulation was significantly increased as compared with their corresponding basal value; Tukey-Kramer's test, p < 0.05.