
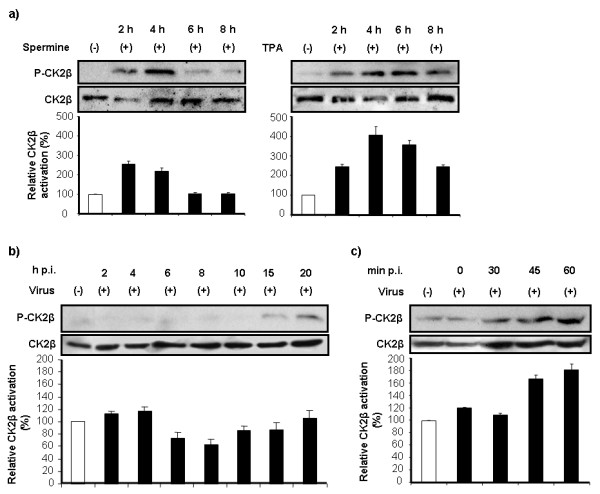
Figure 1
Timing of CK2β activation. (a) A549 cells were treated with either spermine (300 μM) or TPA (200 ng/ml) and further incubated for the times as indicated. (b) A549 cells were incubated with virus-containing medium (MOI = 5) at 37°C for 1 h, medium was replaced, and cells were further incubated at 37°C for the times as indicated. (c) A549 cells were incubated with virus-containing medium (MOI = 5) at 4°C for 20 min and then at 37°C for the times as indicated. CK2β activation was assessed at the indicated time points by Western blot with polyclonal rabbit anti-phosphorylated CK2β (P-CK2β). Bands in three independent experiments were quantified, and relative CK2β activation (black bars) was calculated and normalized to the loading control (anti-CK2β mAb). White bars represent uninoculated cells.
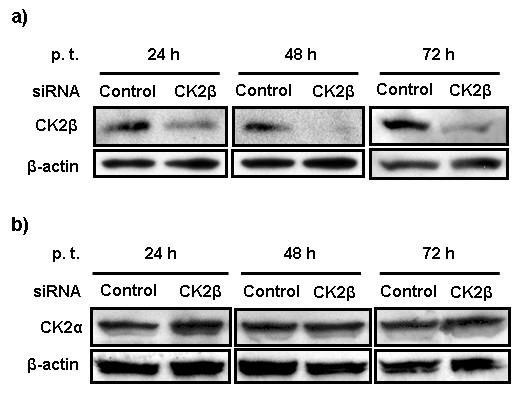
Figure 2
Expression of CK2β protein. A549 cells were transfected with either control or CK2β siRNA. (a) Total amount of CK2β protein detected at 24 h, 48 h, and 72 h post-transfection (p.t.) by Western blot analysis with a mAb specific for the β-subunit of CK2. Loading was controlled with a mAb against β-actin. (b) Total CK2α protein detected 24 h, 48 h, and 72 h after transfection with CK2β siRNA.
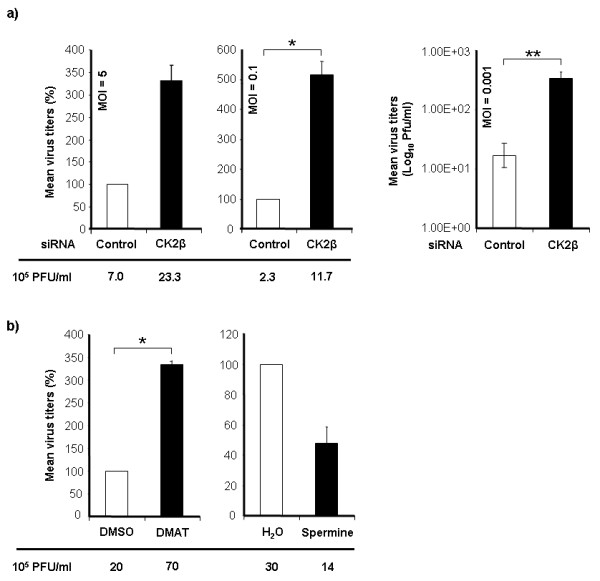
Figure 3
siRNA-mediated silencing of CK2β increases virus titers. (a) A549 cells were transfected with either control (white bars) or CK2β (black bars) siRNA for 48 h, then infected at an MOI of 5, 0.1, or 0.001 and incubated for 24 h. Virus in cell supernatants was titrated in MDCK cells. (b) A549 cells were inoculated with virus (MOI = 5) and were either left untreated (white bars) or treated with the CK2 inhibitor DMAT or the activator spermine (black bars). Virus in cell supernatants was titrated at 24 h p.i.. Mean virus titers ± SE from 3 independent experiments are given as a percentage of the control mean and as PFU/ml. * P < 0.05 and **P < 0.005 between the indicated groups.
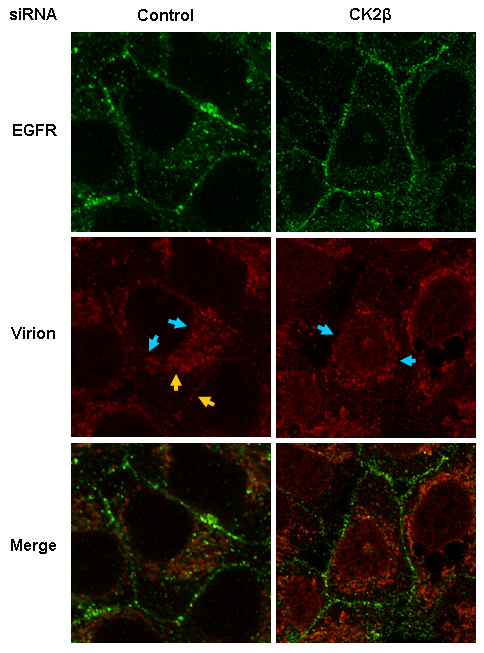
Figure 4
siRNA-mediated CK2β silencing accelerates virus entry. A549 cells were transfected with either control or CK2β siRNA for 48 h. They were then inoculated at an MOI of 50, chilled at 4°C for 30 min, and incubated at 37°C for 30 min. Influenza A virions (red) were detected with a goat anti-IVA (H1N1) polyclonal antibody, and an epidermal growth factor receptor (EGFR)-specific mAb (green) was used as a cell membrane marker. Images were taken with a confocal laser scanning microscope at 100× magnification. Blue arrows indicate virus accumulation at the nuclear membrane; yellow arrows indicate virus accumulation in the cytoplasm and at the cell membrane.
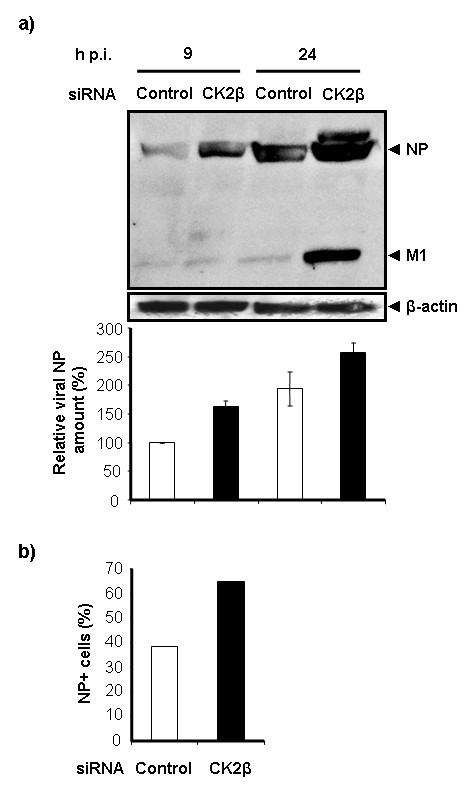
Figure 5
siRNA-mediated silencing of CK2β leads to higher viral protein content. (a) A549 cells were transfected with either control (white bars) or CK2β (black bars) siRNA. After 48 h, cells were inoculated at an MOI of 1 and incubated for 9 h or 24 h before Western blot analysis. Viral proteins were detected with a goat anti-IVA (H1N1) polyclonal antibody. Loading was controlled with a mAb against β-actin. Bands of viral protein were quantified as a percentage of control values normalized to the loading control. Shown are the mean ± SE from 3 independent experiments. (b) Cells were treated as above. The percentage of NP-expressing cells was measured at 24 h p.i. by flow cytometry (FACS) using an anti-NP mAb. The experiments were performed in duplicate.
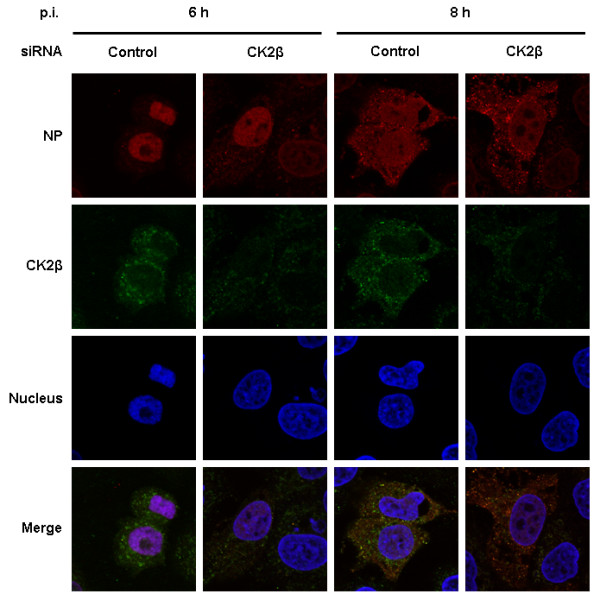
Figure 6
siRNA-mediated CK2β silencing does not affect nuclear RNP export. A549 cells were transfected with either control or CK2β siRNA for 48 h, inoculated with virus at an MOI of 1, and incubated for an additional 6 h or 8 h. The RNP complexes and CK2β protein were stained with a goat anti-NP antibody (red) and an anti-CK2β mouse monoclonal antibody (green), respectively. The nucleus was counterstained with TO-PRO-3 (blue). Intracellular RNP localization was analyzed at the indicated time points by confocal laser scanning microscopy (100× magnification).
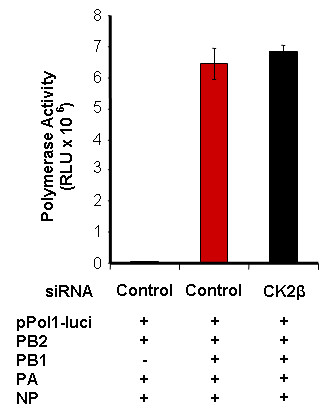
Figure 7
siRNA-mediated CK2β gene silencing does not influence viral polymerase activity. Polymerase activity was assayed in a minigenome system, using a viral UTR-driven luciferase reporter gene. A549 cells were transfected with either control or CK2β siRNA for 48 h, then co-transfected with plasmids containing the PB2, PB1, PA, and NP genes plus a luciferase reporter plasmid. Cells not transfected with the PB1 plasmid were used as negative controls. After 24 h, polymerase (luciferase) activity was assayed in cell extracts. Results represent the mean ± SE of 3 independent experiments.