
Table 1
Production of Ig classes and IgG subclasses in WT mice or mice deficient in Gα12 and/or Gα13
| Thymus-dependent Ig production | Thymus-independent Ig production | |||||||||
| WT | Gα12 +/- | Gα12 -/- | Gα13 +/- | Gα12/Gα13+/- | WT | Gα12 +/- | Gα12 -/- | Gα13 +/- | Gα12/Gα13 +/- | |
| IgG | ++ | ++ | + | + | + | ++++ | +++ | + | ++ | + |
| IgG1 | +++ | +++ | + | ++ | + | + | + | + | + | + |
| IgG2a | ++ | + | + | + | + | + | + | + | + | + |
| IgG2b | ++ | ++ | + | + | + | ++++ | +++ | + | ++ | + |
| IgG3 | t | t | t | t | t | + | + | + | + | ++ |
| IgM | + | + | + | ++ | + | + | + | + | + | + |
| IgA | t | t | t | t | t | t | t | t | t | t |
| IgE | t | t | t | t | t | Not detected | ||||
The relative Ig production was defined as followings: -, OD450 < 0.15; +, OD450 0.15–0.4; ++, OD450 0.4–0.75; +++, OD450 0.75–1.0; and ++++, OD450 > 1.0. The absorbance at 450 nm (OD450) was measured using ELISA assays. Number of animals in each treatment group = 10
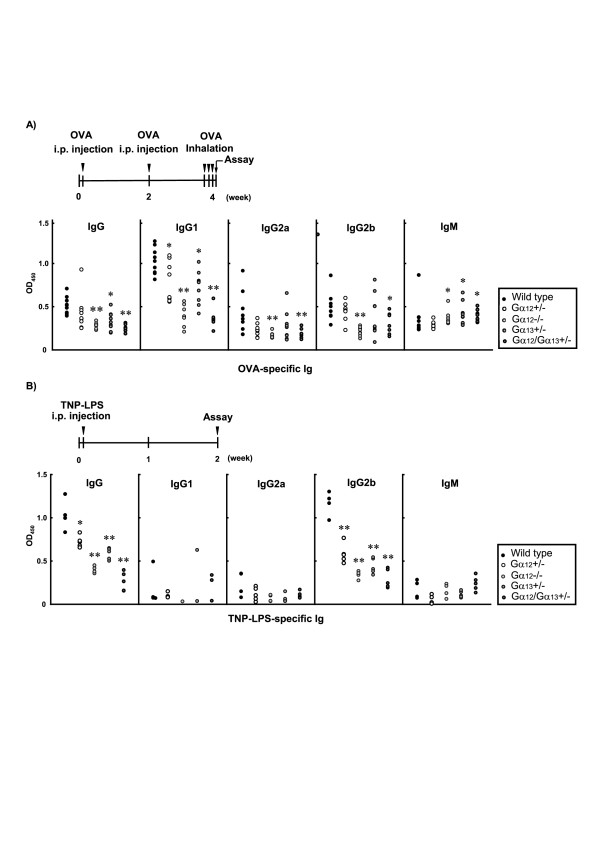
Figure 1
Antigen-specific Ig production in mice immunized with antigens. A) OVA-specific Ig production in mice immunized with OVA. Wild type (WT) or Gα12/Gα13 knockout (KO) mice were i.p injected with OVA on day 1 and day 14, respectively, and challenged by nebulizing 1% OVA solution for 3 consecutive days (days 26–28). Secondary immune responses for OVA-specific total IgG or IgM class, or OVA-specific IgG subclasses in sera were assessed on day 29. B) Ig production in mice injected with a single dose of TNP-LPS. Wild type (WT) or Gα12/Gα13 knockout (KO) mice were injected with TNP-LPS (25 μg/mouse) on day 1. After 2 weeks, TNP-LPS-specific total IgG or IgM class, or TNP-LPS-specific IgG subclasses were assayed in the sera. Preimmune sera obtained on day 0 were used as controls. Number of animals in each treatment group = 10. Data represent means ± S.E.M. (significant compared to the respective Ig in WT mice *p < 0.05, **p < 0.01). OVA, ovalbumin; TNP, trinitrophenyl; LPS, lipopolysaccharide.