
Table 1
Metrics extracted from protein phosphorylation state time courses.
| Metric class | Metrics generated |
| Temporal measurements | 1 min |
| 3 min | |
| 10 min | |
| 30 min | |
| Instantaneous derivatives | 1 min |
| 3 min | |
| 10 min | |
| 30 min | |
| Summary metrics | area under the curve (AUC) |
| Maximum signal | |
| Mean signal |
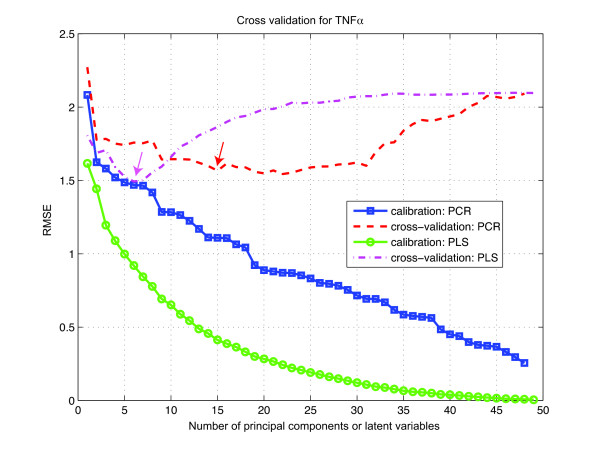
Figure 1
Root-mean-square errors of calibration and cross-validation of TNFα response with both PCR and PLS analysis. Time-dependent signaling metrics were used. Arrows indicate minimum errors and hence the number of components used for the regression models.
Table 2
Prediction accuracy as measured by squared Pearson correlation coefficient R2
| G-CSF | IL-1α | IL-6 | IL-10 | MIP-1α | RANTES | TNFα | |
| PLS (time-derived metrics) | 0.93 (5) | 0.49 (1) | 0.63 (5) | 0.62 (4) | 0.49 (6) | 0.65 (2) | 0.75 (6) |
| PCR (time-derived metrics) | 0.92 (2) | 0.51 (2) | 0.64 (21) | 0.62 (16) | 0.48 (10) | 0.64 (2) | 0.72 (15) |
| PLS (time-averaged data) | 0.88 (5) | 0.83 (6) | 0.58 (6) | 0.64 (5) | 0.62 (5) | 0.73 (5) | 0.83 (5) |
| PCR (time-averaged data) | 0.89 (10) | 0.85 (10) | 0.58 (13) | 0.68 (10) | 0.59 (9) | 0.77 (9) | 0.84 (13) |
Number of principal components (for PCR) or latent variables (for PLS) are listed in parentheses.
Table 3
Top 10% and 20% most significant time-dependent signaling metrics as identified via PLS
| Cytokine | Top 10% metrics | Top 20% metrics (not including those in top 10%) |
| G-CSF | JNK lg: AUC, maximum | JNK lg: mean, @ 30 min, derivative @ 10 min, @ 10 min |
| JNK sh: AUC | JNK sh: derivative @ 10 min, maximum, mean, @ 30 min, @ 10 min | |
| P38: @ 30 min, @ 10 min | ||
| ERK1: derivative @ 10 min | ||
| ERK2: derivative @ 10 min | ||
| RSK: derivative @ 10 min, @ 30 min | ||
| NF-κB p65: @ 10 min, AUC, @ 30 min, maximum | ||
| PKCM: derivative @ 30 min | ||
| IL-1α | JNK lg: maximum | JNK lg: AUC, @ 30 min, mean, derivative @ 10 min, @ 10 min |
| JNK sh: AUC | JNK sh: maximum, mean, derivative @ 10 min, @ 30 min, @ 10 min | |
| ERK1: derivative @ 10 min | ||
| ERK2: derivative @ 10 min | ||
| P38: @ 30 min | ||
| RSK: derivative @ 10 min | ||
| PKCM: derivative @ 30 min | ||
| NF-κB p65: @ 10 min, AUC, maximum, @ 30 min | ||
| IL-6 | STAT3: mean, AUC, derivative @ 3 min, @ 3 min, maximum, @ 1 min, derivative @ 1 min, @ 10 min | STAT3: @ 30 min |
| STAT1α: derivative @ 10 min | ||
| STAT1β: derivative @ 10 min | ||
| IL-10 | RSK: derivative @ 10 min | |
| ERK2: derivative @ 10 min | ||
| ERK1: derivative @ 10 min | ||
| JNK sh: derivative @ 10 min, @ 30 min, AUC, @ 10 min | JNKsh: maximum, mean | |
| JNK lg: @ 30 min, @ 10 min, derivative @ 10 min | JNK lg: AUC, maximum, mean | |
| P38: derivative @ 10 min | P38: @ 30 min | |
| NF-κB p65: AUC | NF-κB p65: maximum, @ 30 min, @ 10 min, mean | |
| GSK3A: derivative @ 10 min | ||
| MIP-1α | JNK lg: mean, maximum, AUC | |
| NF-κB p65: @ 30 min, derivative @ 30 min | NF-κB p65: @ 10 min | |
| JNK sh: maximum, AUC | JNK sh: mean, derivative @ 10 min | |
| STAT5: 1 min, derivative @ 1 min | ||
| ERK2: derivative @ 10 min | ||
| ERK1: derivative @ 10 min | ||
| PKCM: maximum, derivative @ 30 min | ||
| P38 @ 30 min, maximum, @ 10 min | ||
| STAT1α: derivative @ 30 min | ||
| RANTES | JNK lg: maximum, AUC, mean | JNK lg: derivative @ 10 min, @ 30 min, @ 10 min |
| JNK sh: maximum, AUC, derivative @ 10 min | JNK sh: mean, @ 10 min, @ 30 min | |
| ERK2: derivative @ 10 min | ||
| ERK1: derivative @ 10 min | ||
| RSK: derivative @ 10 min | ||
| PKCM: derivative @ 30 min, maximum | ||
| P38: derivative @ 10 min, @ 30 min | ||
| NF-κB p65: @ 10 min | ||
| TNFα | NF-κB p65: @ 30 min, @ 10 min | |
| JNK lg: mean, maximum, AUC | ||
| PKCM: derivative @ 30 min, @ 30 min, maximum | ||
| P38: @ 30 min, @ 10 min, AUC | ||
| JNK sh: maximum, AUC, mean | ||
| RSK: @ 30 min | ||
| ERK1: @ 30 min | ||
| Rps6: derivative @ 30 min | ||
| ERK2: @ 30 min |
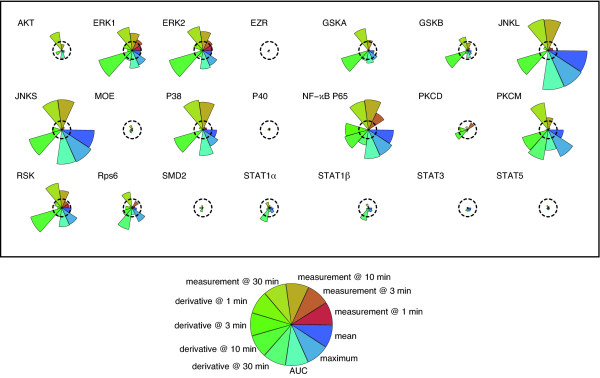
Figure 2
Squared weighted VIP profile for RANTES. Ten PLS models were generated through 10-fold cross validation and then a weighted VIP score was computed as described in Materials and Methods to select the important signaling metrics. A segment plot was produced for each protein, with the radial length of each segment indicating the magnitude of the squared weighted VIP score for individual metrics. VIP scores greater than 1 (dashed circle) are classified as significant metrics. For example, here we see that the mean, maximum and AUC for JNKL/S activity are the most informative metrics for RANTES, while proteins such as EZR do not have predictive value under the conditions studied. see that the mean, maximum and AUC for JNKL/S activity are the most informative metrics for RANTES, while proteins such as EZR do not have predictive value under the conditions studied.
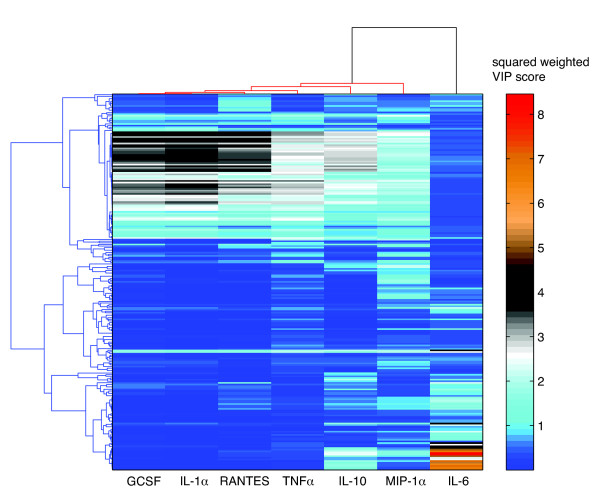
Figure 3
Clustering of squared weighted VIP profiles for all seven cytokines. Two-way average linkage clustering was performed using uncentered Pearson's correlation distances.
Table 4
Prediction results of PLS regression using all vital signaling metrics
| G-CSF | IL-1α | IL-6 | IL-10 | MIP-1α | RANTES | TNFα | |
| number of vital metrics | 74 | 70 | 49 | 85 | 97 | 76 | 78 |
| R 2 | 0.90 | 0.49 | 0.72 | 0.66 | 0.54 | 0.69 | 0.76 |
For each cytokine, a PLS regression model using from 49 to 97 most informative (vital) signaling metrics was as predictive as the complete model that used all 231 metrics.
Table 5
Prediction results of PLS regression using top vital signaling metrics.
| G-CSF | IL-1α | IL-6 | IL-10 | MIP-1α | RANTES | TNFα | |
| Numb. of metrics | 1 | 1 | 14 | 34 | 46 | 1 | 38 |
| R 2 | 88.0 ± 0.27% | 51.4 ± 0.55% | 64.2 ± 2.41% | 56.6 ± 2.61% | 49.4 ± 2.42% | 75.0 ± 0.60% | 66.3 ± 1.84% |
For each cytokine, a PLS regression model using from 1 to 46 of the most informative signaling metrics can achieve an average R2 greater than 85% of the maximum averaged R2. Values are means ± standard deviation. Numb. of metrics = Number of most informative metrics used in the regression.
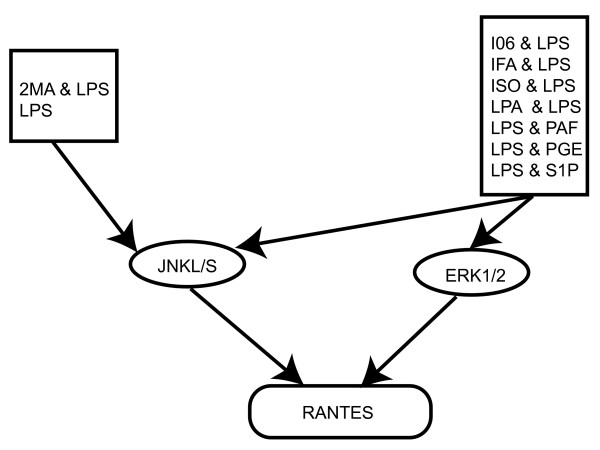
Figure 4
Signaling network topology for RANTES based on the top ten signaling metrics. The kinases JNK and ERK1/2 were found to play an important role in regulating RANTES from the PLS analysis. Legends shown in the top row were identified directly from the data (i.e. not a model output) as the top activators of either JNK or ERK1/2. Also see Table 3.
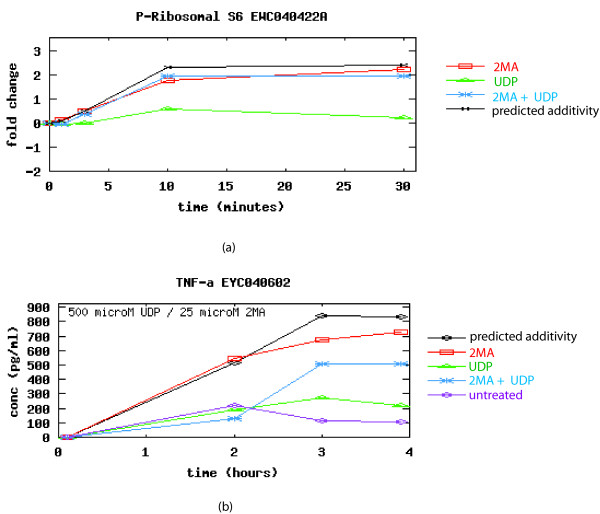
Figure 5
Protein phosphorylation and cytokine concentration time courses after applying 2MA, UDP, or both. (a) Protein phosphorylation of P-Ribosomal S6 was measured at 0, 1, 3, 10 and 30 minutes. (b) TNFα was measured at 0, 2, 3, and 4 hours. Longer time courses with greater sampling may be required to generate reliable results as many curves appeared to have been just initiated (source: [20] – see text for more details).
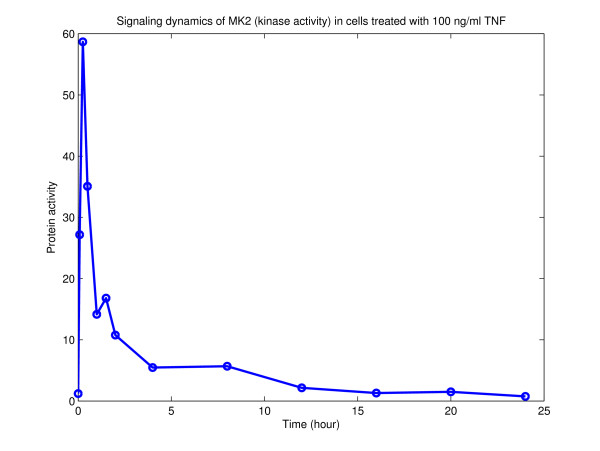
Figure 6
Measured activity of protein kinase MK2. Example of a 13 time point activity curve of the signaling dynamics of MK2 in HT-29 cells treated with 100 ng/ml TNF (Data from [4]).