
Figure 1
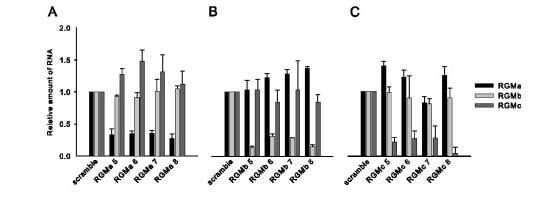
Relative RNA levels for each RGM after siRNA mediated knockdown. Real-time quantitative Taqman RT-PCR analysis was performed to test the effectiveness and specificity of RNA target knockdown in cells transfected with siRNA duplexes. A scramble control was tested in addition to four distinct siRNA duplexes that target RGMa (A), RGMb (B), or RGMc (C). Error bars represent the standard deviation (n = 4).
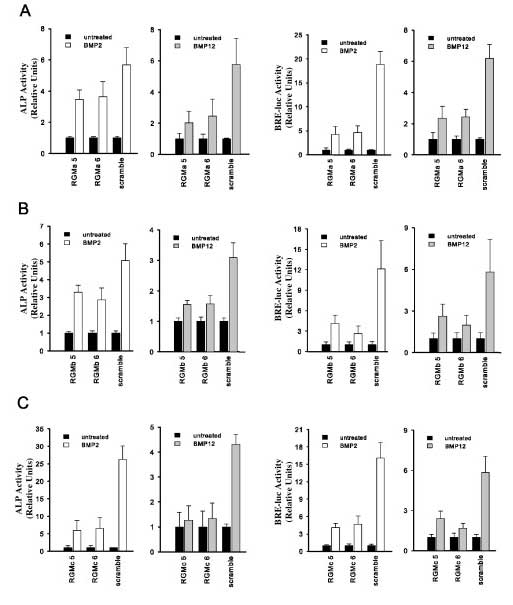
Figure 2
Cell-based BMP activity assays. Cells in which RGMa (A), RGMb (B), or RGMc (C) levels were knocked down were treated with either BMP2 or BMP12 and assayed for ALP activity or BRE-luc activity. In each case, data from two effective siRNA duplexes are shown compared to the scramble siRNA sequence. In all cases, activities resulting from BMP2 or BMP12 treatment are normalized to the activity of untreated cells. Error bars represent the standard deviation (n = 4). In all cases, the BMP-induced response from the RGM siRNA-treated cells was significantly lower than for the scramble siRNA-treated cells, as determined by a two-tailed Student's T-test (p-value threshold of 0.05).
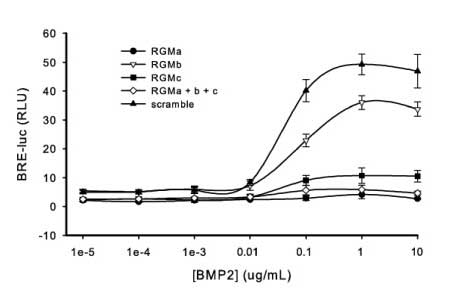
Figure 3
BMP2 induced BRE-luc activity over a dose range. RNA knockdown of the indicated target was performed over a range of BMP2 concentrations in C2C12 cells. Error bars represent the standard deviation (n = 4).
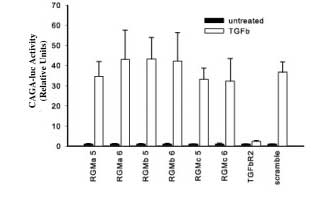
Figure 4
Cell-based TGFβ activity assay. Cells in which RGMa, RGMb, or RGMc levels were knocked down were treated with TGFβ and assayed for CAGA-luc activity. Knockdown of TGFβ RII was also performed as a positive control. Error bars represent the standard deviation (n = 4). The TGFβ-induced response from the RGM and scramble siRNA-treated cells showed no significant difference from each other, while the TGFβ R2 siRNA-treated cells showed significantly lower responsiveness, as determined by a two-tailed Student's T-test (p value threshold of 0.05).
Table 1
Kinetic analysis of BMP2 and BMP12 binding interactions with the RGM coreceptors
| BMP2 | K on (M -1 s -1 ) | K off (s -1 ) | K D (nM) |
| RGMa | 1.48 × 10⁵ | 3.64 × 10⁻⁴ | 2.46 |
| RGMb | 4.72 × 10⁴ | 2.56 × 10⁻⁴ | 5.43 |
| RGMc | 8.61 × 10⁴ | 3.63 × 10⁻⁴ | 4.22 |
| BMP12 | K on (M -1 s -1 ) | K off (s -1 ) | K D (nM) |
| RGMa | 1.27 × 10⁵ | 1.79 × 10⁻⁴ | 1.41 |
| RGMb | 5.69 × 10⁴ | 1.18 × 10⁻⁴ | 2.06 |
| RGMc | 7.56 × 10⁴ | 9.22 × 10⁻⁵ | 1.22 |
BIAevaluation software was used to analyze the binding kinetics of BMP2 or BMP12 binding to each RGM co-receptor. In all cases, kinetic parameters were obtained from global analysis of protein binding kinetics [see Additional file 1 for binding curves]
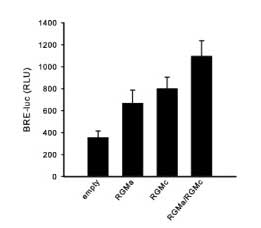
Figure 5
RGM overexpression in C2C12 cells. Cells were transiently transfected with the same total amount of either empty vector, RGMa, RGMc, or RGMa/RGMc, followed by BMP2 treatment, and then assayed for BRE-luc activity. Error bars represent the standard deviation (n = 4). Significantly higher BRE-luc activity was observed in cells co-transfected with RGMa/RGMc than in cells transfected in either RGMa or RGMc alone, as determined by a two-tailed Student's T-test (p value threshold of 0.05). Cells transfected without co-receptors (empty vector) showed significantly lower BRE-luc activity than all other treatments.