
Figure 1
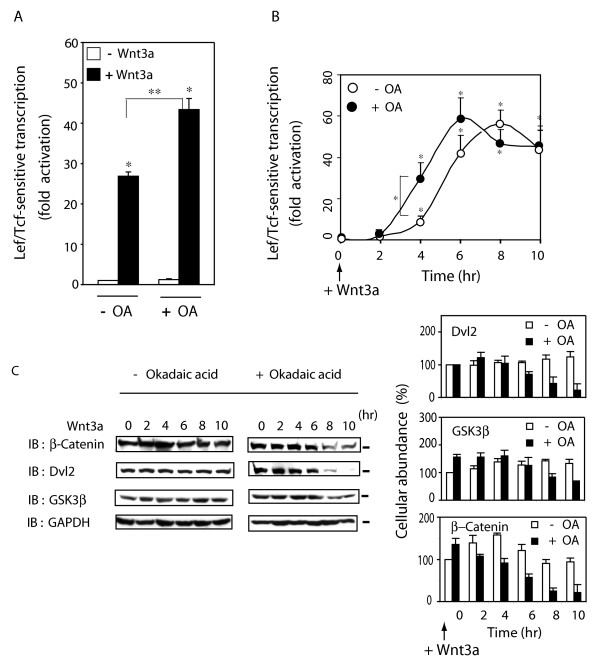
Suppression of PP2A potentiates the Wnt/β-catenin signaling. Panel A, OA enhanced the Lef/Tcf-sensitive transcription activity in response to Wnt3a. F9 cells expressing Rfz1 were treated with Wnt3a for 8 hr in the absence or presence of OA, added 60 min prior to stimulation with Wnt3a. Cells were lysed and the Lef/Tcf-sensitive gene transcription was assayed in samples of cell lysates using the M50 luciferase gene reporter. The results showed mean values ± S.E. that were obtained from five separate experiments. Statistical significance is noted (*, p < 0.001; **, p < 0.05). Panel B, OA enhanced the time-course of activation of Lef/Tcf-sensitive transcription in response to stimulation by Wnt3a. F9 cells expressing Rfz1 were treated without (open circle) or with (closed circle) OA and Wnt3a added for a 10 hr stimulation. Cells were harvested at indicated time points and disrupted. The Lef/Tcf-sensitive gene transcription was assayed. The results shown are mean values ± S.E. obtained from four separate experiments. Statistical significance is denoted (*, for p < 0.005). Panel C, effects of OA on the cellular abundance of Wnt/β-catenin signaling elements in response to long-term (0–10 hr) stimulation by Wnt3a. The cellular content of β-catenin, Dvl2, GSK3β, and GAPDH (as a control) were established in F9 cells expressing Rfz1 and stimulated with Wnt3a, in the absence or presence of OA, for 0–10 hr. The results shown are mean values ± S.E. obtained from four separate experiments. Representative blots are displayed.
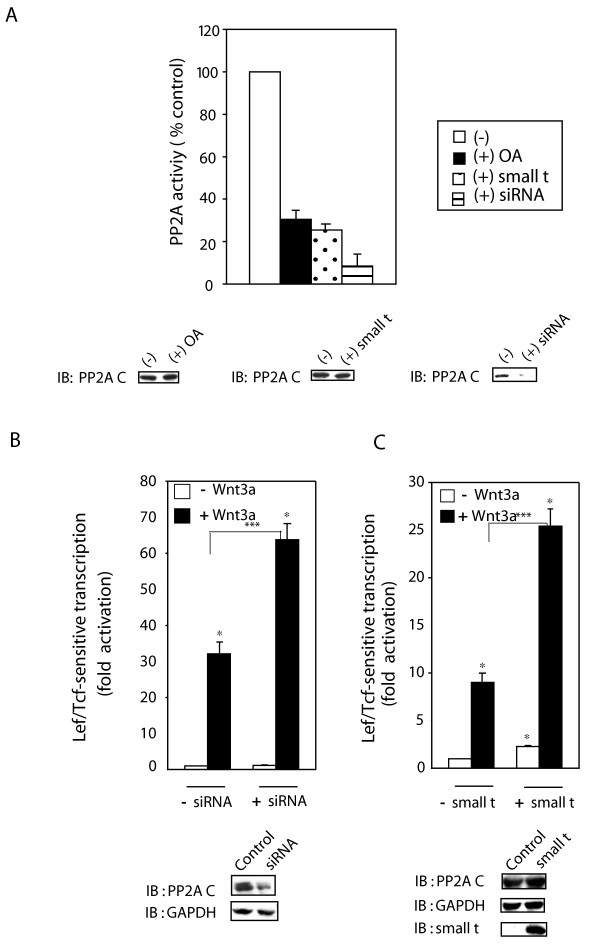
Figure 2
Suppression of PP2A activity by siRNA or small t antigen enhances Lef/Tcf-sensitive transcription. Panel A, Rfz1-expressing F9 cells were treated with OA for 1 hr or siRNA targeting PP2A C subunit for 48 hr, or co-expression of small t antigen for 48 hr. Cell lysates were applied to a small Sephadex-G50 column and PP2A activity assay was carried out using pNPP as a substrate. The results are shown as mean values ± S.E. from 8–10 independent experiments. Abundance of PP2A C subunit was determined by Western immunoblotting with anti-PP2A C subunit antibody. Panel B, cells were treated with siRNAs targeting the PP2A C-subunit for one day before co-transfection of the cells with Rfz1 and Super8xpTOPFlash plasmids. Cells were stimulated with or without Wnt 3a for 8 hr. The luciferase gene reporter was assayed and is displayed relative to the unstimulated cells (set to "1"). The results showed mean values ± S.E., obtained from five separate experiments. Statistical significance is indicated (*, p < 0.001; ***, p < 0.005). Cell extracts also were analyzed for abundance of PP2A C-subunit by immunoblotting. Immunoblots were stained with anti-GAPDH antibodies to establish loading equivalence.Panel C, activation of Lcf/Tcf-sensitive transcription was assayed in F9 cells co-transfected for one-day with Rfz1, Super8xTOPFlash (M50) and small t antigen then stimulated without and with purified Wnt3a for 8 hr. The luciferase gene reporter was assayed and the transcriptional response displayed relative to the unstimulated cells (set to "1"). Cell lysates were analyzed by immunoblotting, blots stained with anti-PP2A C-subunit, anti-GAPDH, or anti-small t antigen antibodies. The results shown are mean values ± S.E. from 5 independent experiments.
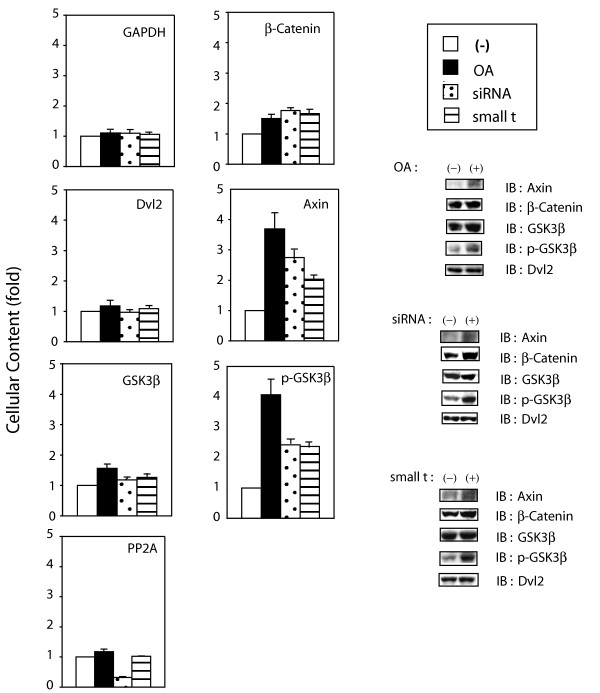
Figure 3
Suppression of PP2A activity alters cellular abundant of Wnt/β-catenin signaling elements. F9 cells expressing Rfz1 were either pretreated with OA for 1 hr or treated with siRNA targeting PP2A C- subunit for 48 hr, or transfected to express SV40 small t antigen for 48 hr. Cells were washed with PBS twice and lysed. Cell lysates were subjected to SDS-PAGE and analyzed by immunoblotting, blots stained with anti-Axin, anti-β-catenin, anti-Dvl2, anti-GSK3β, anti-p-Ser (9)-GSK3β, anti-PP2A C or anti-GAPDH antibody. The relative amounts of the proteins in each fraction were established by densitometry, as described in Methods. The relative abundance of each signaling molecule in the untreated cell, whole-cell extract was set to "1". The results are shown as mean values ± S.E. from 8–10 independent experiments. Right-handed panel displays the representative immunoblots, stained for Axin, β-catenin, GSK3β and p-Ser (9)-GSK3β.
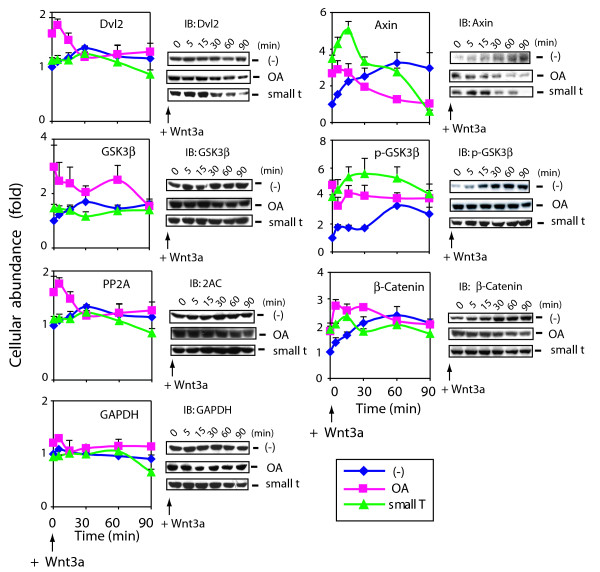
Figure 4
Effects of inhibition of PP2A on cellular abundance of Wnt/β-catenin signaling elements. Graphs display the relative cellular abundance of Wnt/β-catenin signaling elements in cells following stimulation with Wnt3a. F9 cells expressing Rfz1 were untreated or treated with Wnt3a in the presence or absence of OA for 0 to 90 min. For OA treatment, F9 cells expressing Rfz1 were treated with OA for 1 hr prior to Wnt3a stimulation. For small t antigen experiments, F9 cells were transiently co-transfected with Rfz1 and small t antigen, and then stimulated with Wnt3a for the indicated times. Cells were collected and lysed. Lysates (60–100 μg protein) were subjected to SDS-PAGE and analyzed by immunoblotting, blots stained with antibodies targeting the signaling molecules indicated. Bands were quantified by densitometry, as described in Experimental Procedure and values are displayed as "fold", with time = 0 set as "1". The results are shown as mean values ± S.E. from 6–8 independent experiments. Representative blots are displayed, as is the quantitative analysis of cellular content extracted from 6–8 separate experiments (graphs).
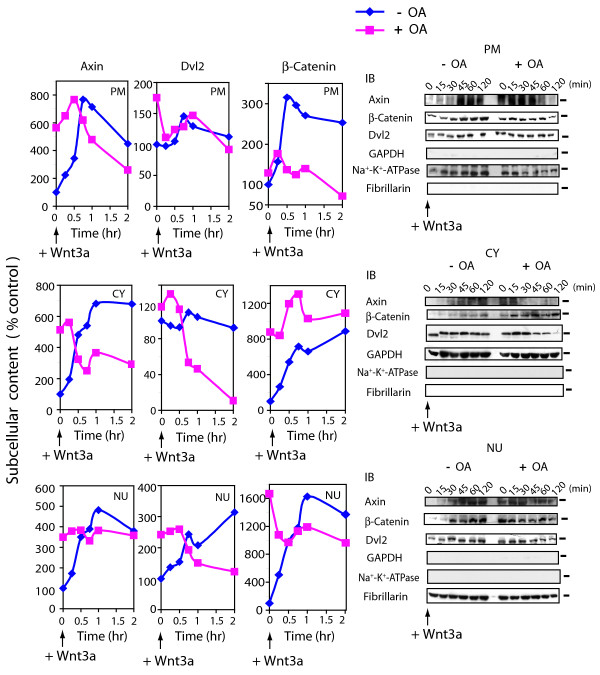
Figure 5
Abundance of Axin, Dvl2 and β-catenin in response to Wnt3a: effects of okadaic acid. F9 cells expressing Rfz1 were pretreated with or without 40 nM OA for 1 hr and then stimulated with Wnt3a in the presence or absence of OA for the indicated time periods. Cells were harvested and fractionated to subcellular fractions highly enriched in plasma membrane (PM), cytoplasm (CY), or nuclei (NU), as described in the Methods. Each fraction was separated by SDS-PAGE and the resolved protein transferred to blots stained with anti-Axin, anti-Dvl2 or anti-β-catenin antibodies. The enrichment of the subcellular fractions was established by staining immunoblots with antibodies to well known protein markers for PM, CY, and NU subcellular fractions. Left-handed panel displays the quantitative analysis of the blots for Wnt3a alone (blue line) or Wnt3a in the presence of OA (pink line). The data are displayed as the mean values "% of control" (i.e., t = 0 then set to 100%). Right-handed panel displays immunoblots. The results shown are derived from a single experiment, representative of two additional experiments.
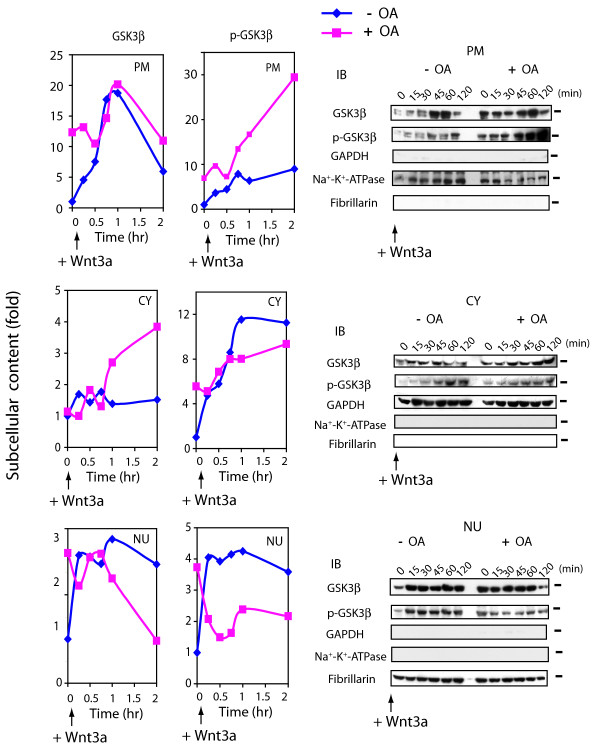
Figure 6
Suppression of PP2A provokes shuttling and phosphorylation of GSK3β. F9 cells expressed Rfz1 were treated without (-) or with (+) OA for 1 hr and then stimulated without (time + 0) or with Wnt3a for the indicated time periods. At indicated time points, cell cultures were harvested, disrupted, and subjected to subcellular fractionation to plasma membrane (PM), cytoplasm (CY) and nuclei (NU) fractions, as described in the Methods. Samples of each fraction were subjected to protein determination, SDS-PAGE, and the resolved proteins blotted and stained with antibodies specific for GSK3β and with antibodies specific for Ser9 phospho-GSK3β. Left-handed panel shows the quantitative analysis of the blots for Wnt3a alone (blue line) or Wnt3a in the presence of OA (pink line). The data are displayed as fold of control (time zero set to 1). Right-handed panel displays immunoblots stained with GSK3β and phospho-GSK3β (Ser 9) antibodies as well as antibodies specific for subcellular fractions, (i.e., marker proteins). The results shown are derived from a single experiment, representative of two additional experiments.
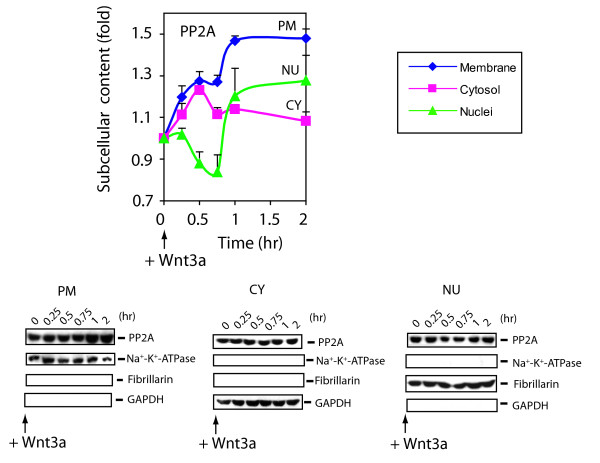
Figure 7
PP2A shuttles to the plasma membrane and nuclear subcellular fractions in response to Wnt3a. Cells expressing Rfz1 receptor were harvested at indicated time point after Wnt3a stimulation. Cells were fractionated to the plasma membrane (PM), cytoplasm (CY) and nuclei (NU), as described in the Methods. Subcelluar fractions obtained from control (time = 0) and Wnt3a-stimulated cells were analyzed by immunoblotting with anti-PP2A C-subunit antibody. PM (blue line), CY (pink line) and NU (green line) fractions are displayed. Stained protein bands were quantified and the values are presented as "fold of zero time point". Bottom three panels of immunoblots are stained with antibodies against the following subcellular fraction marker proteins: Na+-K+-ATPase (plasma membrane), GAPDH (cytoplasm) and fibrillarin (nuclei), respectively. The results are shown as mean values ± S.E. from 5 or more independent experiments. Representative blots are displayed, as is the quantitative analysis of cellular content extracted from a compilation of data from the separate experiments (graphs).
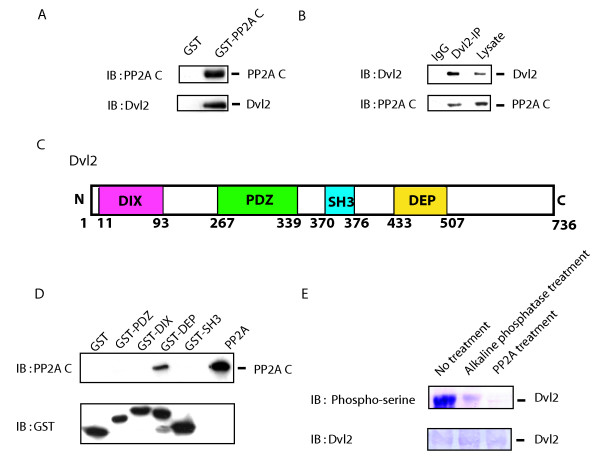
Figure 8
PP2A associates directly with Dvl2 and dephosphorylates Dvl2. Panel A, probing interaction of Dvl2 and PP2A in vivo. Whole-cell extracts (2 mg) prepared from F9 cells expressing Rfz1 were incubated with immobilized GST gel alone or with GST-PP2A C-subunit-immobilized gel. Bound proteins were released and resolved by SDS-PAGE. The resolved proteins were subjected to blotting and stained with either with anti-PP2A C subunit antibodies (top panel) or anti-Dvl2 antibodies (bottom panel). Panel B, pull-downs of Dvl2 from F9 cells reveal associated PP2A. F9 cells lysates were subjected to analysis by pull-downs of either Dvl2 or of mouse IgG (as a control). The immune precipitates were subjected to SDS-PAGE, immunoblotting, and staining with either anti-Dvl2 antibodies (top panel) or anti-PP2A C-subunit antibodies (bottom panel). Panel C, Dvl2 domains structure. Panel D, direct association of Dvl2 and PP2A in vitro. Purified mouse PP2A enzyme (PP2A, AC subunit dimers) was incubated with one of four domains of Dvl2 engineered as a fusion protein with GST and then immobilized: immobilized GST-PDZ, GST-DIX, GST-DEP, GST-SH3 and GST itself (as a control) at 4°C for 1 hr. The bound proteins were separated by SDS-PAGE, blotted, and stained with either anti-PP2A C-subunit antibodies or anti-GST antibodies. Panel E, PP2A dephosphorylates phospho-rDvl2. 6-Histidinyl-tagged phosphorylated Dvl2 was expressed in Sf9 cell and purified by Ni-NTA column chromatography as described in Methods. Purified phospho-rDvl2 protein was incubated with either purified calf alkaline phosphatase or with purified PP2A for 1.5 hr. The incubation was terminated by addition of SDS-PAGE sample buffer. The samples were subjected to SDS-PAGE, blotted, and stained with either anti-phospho-Ser antibodies (top of panel) or with anti-Dvl2 antibodies (bottom of panel). The immune complexes were made visible by use of an alkaline phosphatase-conjugated, second antibody and BCIP/NBT as substrates. The results shown are from a single experiment, duplicated with essentially similar results.
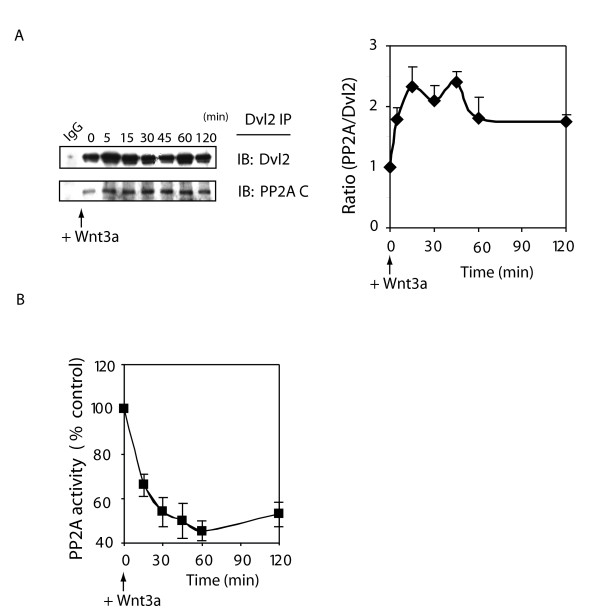
Figure 9
Dvl2 interacts with PP2A and PP2A activity is attenuated in response to Wnt3a. Panel A, Association of Dvl2 and PP2A was investigated in the cytosolic fraction. Cell lysates (1 mg) were immunoprecipitated with Anti-Dvl2 antibody. Bound proteins were resolved by SDS-PAGE, immunoblotting, and made visible by staining with either anti-Dvl2 or anti-PP2A C-subunit antibodies. Dvl2 and PP2AC association is displayed as "fold" (time = 0, set to "1"). Representative blots are displayed. The results are shown as mean values ± S.E. from 5 independent experiments. Panel B, F9 cells expressing Rfz1 were stimulated with purified Wnt3a for the indicated time. Cells were washed with PBS and lysed. Cell lysates were applied to a small Sephadex G-50 column to remove small molecular substances that interfere with the assay, and PP2A activity determined. Results were shown as the mean values ± S.E. from 8 independent experiments.