
Figure 1
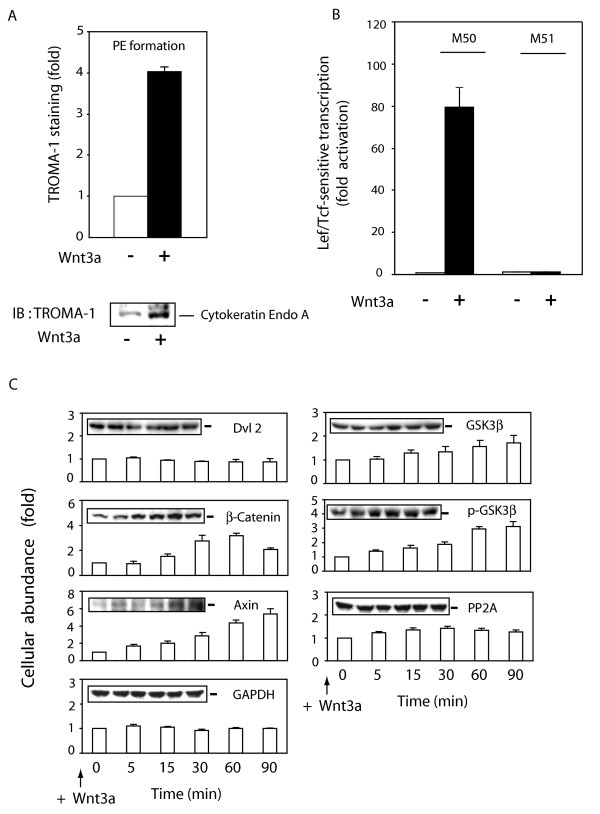
Wnt3a stimulates changes in cellular content of Wnt/β-catenin pathway signaling components. Panel A, formation of PE was assayed in F9 cells expressing Rfz1 and stimulated without or with purified Wnt3a for 3 days. PE formation was assayed by measuring of expression of PE-marker, cytokeratin endo A, using immunoblotting and staining with TROMA-1 antibody. The results shown are mean values ± S.E. from 3 independent experiments. A representative immunoblot is shown and the mean values of the quantification displayed in the graph. Panel B, activation of Lcf/Tcf-sensitive transcription was assayed in F9 cells co-transfected for one-day with Rfz1 and Super8xTOPFlash (M50) or Super8xFOPFlash (M51) and then stimulated without and with purified Wnt3a for 8 hr. The luciferase gene reporter was assayed and is displayed relative to the unstimulated cells (set to 1). The results shown are mean values ± S.E. from 5 independent experiments. Panel C, cellular abundance of Axin, Dvl2, GSK3β, p-GSK3β, PP2A C, and β-catenin was assayed in F9 cells expressing Rfz1 and stimulated with Wnt3a for 0 to 90 min. Cells were harvested and lysed in a lysis buffer [50 mM Tris-HCl, pH 7.5, 150 mM NaCl, 5 mM EDTA, 2 mM Na3VO4, 50 mM NaF, 1 % Triton X-100, 1 mM phenymethysulfonyfluoride (PMSF), 10 μg/ml leupeptin, and 10 μg/ml aprotinin]. Protein expression was established by SDS-PAGE, immunoblotting, and densitometric scans of the immune complexes. A representative blot is shown and the quantification of results is shown as mean values ± S.E. from 4 independent experiments.
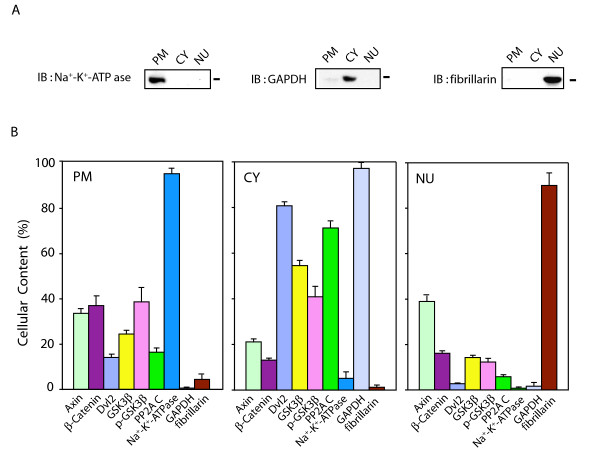
Figure 2
Cellular distribution of Wnt/β-catenin signaling elements. Large-scale cultures of mouse F9 cells expressing Rfz1 were harvested and the cells disrupted. Subcellular fractions were prepared from the cell masses and the fractions probed for enrichment in plasma membrane (PM), cytoplasm (CY), and nuclei (NU) as described in detail in the Methods. Samples of the whole-cell homogenate were subjected to subcellular fractionation and their complements of cellular proteins to SDS-PAGE. Panel A, the distribution of well-known marker proteins for subcellular fractions (i.e., Na+-K+-ATPase as a marker for plasma membrane, GAPDH as a marker for cytoplasm, and fibrillarin as a marker for nuclei) also was analyzed in each fraction to establish purity/enrichment of markers in these fractions. Panel B, resolved proteins were analyzed by immunoblotting, stained with one of the following antibodies: anti-Axin, anti-β-catenin, anti-Dvl2, anti-GSK 3β, anti-p-Ser (9)-GSK 3β, and anti-PP2A C-subunit. The relative amounts of the proteins distributed in each subcellular fraction was established densitometrically, based upon their distribution (%), the total protein content of the homogenate and fractions, and quantified analysis of blots from SDS-PAGE. The results are shown as mean values ± S.E. from 8-10 independent experiments.
Table 1
Protein distribution in subcellular fractions prepared from mouse F9 cells. Pre-confluent F9 cells were harvested from P150 cultures, homogenized, and subcellular fractions prepared for analysis of relative protein content, as outlined in the Methods. The sum of these 4 subcellular fractions was set as "100 %". The data displayed are the mean values ± S.E.M from separate preparations (n = 20).
| Fractions | Protein distribution % | Protein (mg) |
| Nuclei | 12.25 ± 0.450 | 01.81 |
| Mitochondria+Microsomes | 10.64 ± 0.347 | 01.57 |
| Plasma Membrane | 30.06 ± 1.078 | 04.45 |
| Cytoplasm | 47.05 ± 0.332 | 06.96 |
| Total | 100 | 14.79 |
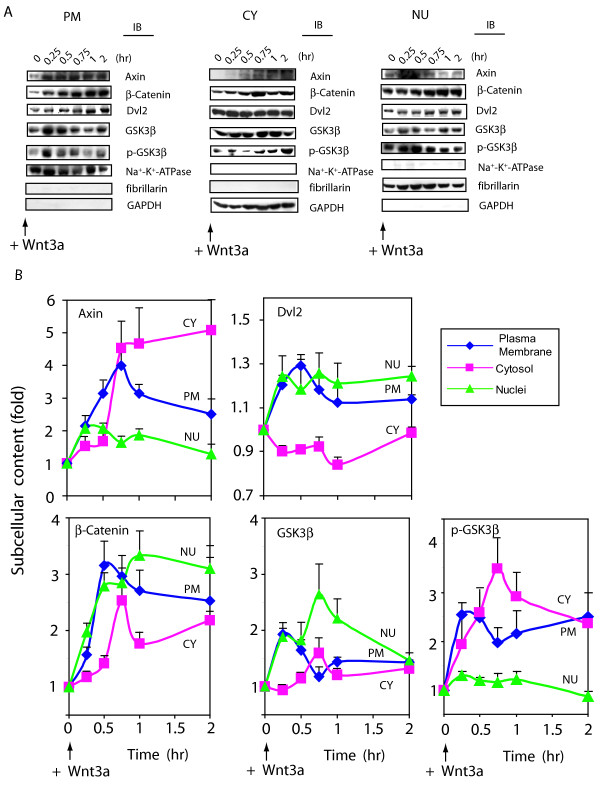
Figure 3
Wnt3a stimulates a rapid shuttling of Wnt/β-catenin signaling elements. Panel A, quantified immunoblot analysis of subcellular fractions obtained from control cells (time = 0) and cells stimulated with purified Wnt3a. F9 cells expressing Rfz1 receptor were stimulated with Wnt3a for the indicated times. Cell cultures were collected, disrupted, and fractionated to the plasma membrane, cytoplasm and nuclei fractions, as described in Methods. Each fraction (100 μg) was subjected to SDS-PAGE and analyzed by immunoblotting with specific antibodies targeting the signaling molecules indicated. The three panels displayed at the bottom of the immunoblot set show blots stained with antibodies to well known subcellular marker proteins: Na+-K+-ATPase (plasma membrane), GAPDH (cytoplasm) and fibrillarin (nuclei), respectively. The result shown is representative of 10 independent experiments. Panel B, summary of the quantified trafficking of signal elements in response to Wnt3a. Bands were quantified by densitometry as described in Methods and values are displayed as fold of zero time point. The content of key signaling molecules in the plasma membrane- (PM, blue line), cytoplasmic- (CY, pink line) and nuclear- (NU, green line) enriched subcellular fractions are displayed. The results are shown as mean values ± S.E. from 6–10 independent experiments.
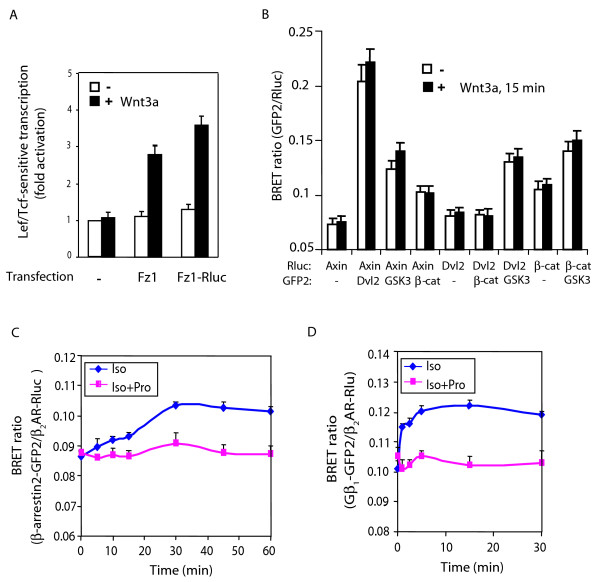
Figure 4
BRET2 analysis of protein-protein interactions in the Wnt/β-catenin signaling pathway. Panel A, Lef/Tcf-sensitive gene activation in HEK 293 cells in response to Wnt3a. HEK 293 cells were co-transfected with either Rfz1 and M50 or Rfz1-Rluc and M50. HEK 293 cells were stimulated with Wnt3a (20 ng/ml) for 8 hr. Lef/Tcf-sensitive transcription activity was determined. Panel B, HEK 293 cells stably expressing Rfz1 were transiently co-transfected with Axin-Rluc and/or Dvl2-GFP2, Dvl2-Rluc, GSK3-GFP2, β-cat-GFP2, β-cat-Rluc as indicated for 48 h and then treated with Wnt3a (20 ng/ml) for 15 min. BRET ratios were measured by addition of DeepBlue C (5 μM) in cells co-expressing Rluc and GFP2 fusion proteins. Results are expressed as the mean ± S.E. of at least three independent experiments. Panel C,the β-adrenergic agonist isoproterenol (Iso) stimulates the interaction between GPCR and β-arrestin2. HEK293 cells were transiently transfected with β2AR-Rluc and β-arrestin2-GFP2 for 48 h, and then treated with Iso (10 μM) or Iso plus the β-adrenergic antagonist propranolol (Pro, 10 μM) for 0 to 60 min. Panel D, Iso stimulates the interaction between GPCR and the heterotrimeric G protein subunit Gβ1. HEK293 cells were transiently transfected with β2AR-Rluc, Gβ1-GFP2, Gαs, and Gγ2 for 48 h, and then treated with agonist Iso (10 μM) or Iso plus antagonist Pro (10 μM) for 0 to 30 min. BRET ratios (GFP2/Rluc activity) were measured by addition of DeepBlue C (5 μM) in cells coexpressing Rluc and GFP2 fusion proteins. Results are expressed as the mean ± S.E. of three independent experiments. Note that isoproterenol stimulates GPCR interaction with G-protein first (peaks within 5 min of agonist) and later leads to association of GPCR with β-arrestin2 (peaks at 30 min). Both sets of protein-protein interactions are blocked by simultaneous addition of propranolol with agonist.
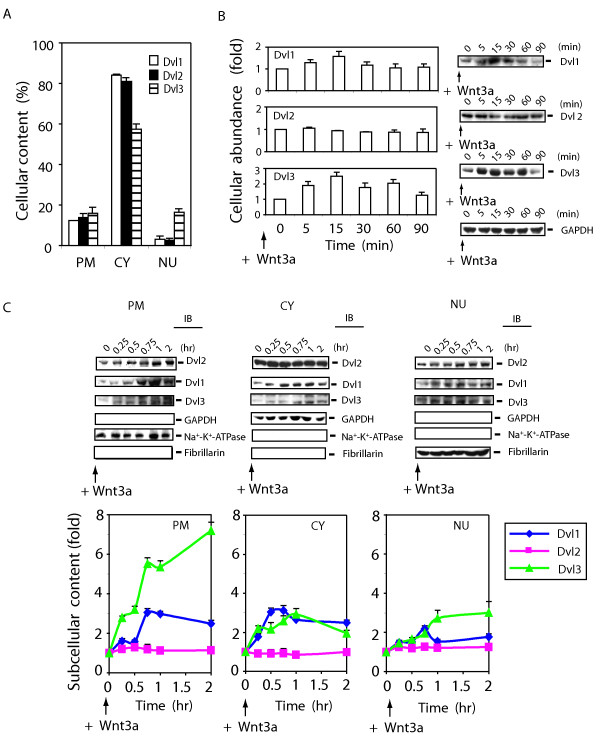
Figure 5
Differential effects of Wnt3a stimulation on Dvl1, Dvl2, and Dvl3. Panel A, the comparison of the cellular abundance of mammalian Dvl isoforms (Dvl1, Dvl2, and Dvl3) in subcellular fractions. F9 cells expressing Rfz1 were used to prepare subcellular fractions. Plasma membrane-enriched (PM), cytosol-enriched (CY), and nuclear-enriched (NU) fractions were prepared as described in detail in Methods and are displayed. The results of multiple densitometric scans of immunoblots were quantified. The results are displayed based upon the distribution (%), the total protein content of the whole-cell homogenate and fractions, and quantified analysis of blots from SDS-PAGE for each molecule and various controls for sample loading and blotting. The results are shown as mean values ± S.E. from 6–8 independent experiments. Panel B, the comparison of the cellular abundance of Dvls in response to Wnt3a. F9 cells expressing Rfz1 were stimulated with purified Wnt3a for indicated time and then disrupted in a lysis buffer [50 mM Tris-HCl, pH 7.5, 150 mM NaCl, 5 mM EDTA, 2 mM Na3VO4, 50 mM NaF, 1 % Triton X-100, 1 mM phenymethysulfonyfluoride (PMSF), 10 μg/ml leupeptin, and 10 μg/ml aprotinin]. Abundance of each Dvl isoform was determined by staining of blots with specific antibodies against each Dvl. Fractions were also stained with anti-GAPDH antibody to establish loading equivalence. Values are displayed as ''fold'' of zero-time point (set to 1). A representative blot is shown and the quantification of results is shown as mean values ± S.E. from 6 independent experiments. Panel C, F9 cells expressing Rfz1 receptor were stimulated without or with Wnt3a. Cells were harvested at each time point indicated, cell lysates were fractionated into plasma membrane (PM), cytoplasm (CY) and nuclei (NU) fractions. Quantified immunoblotting was performed as described in Methods. Each fraction (100 μg) was subjected to SDS-PAGE and the resolved proteins analyzed by immunoblotting with anti-Dvl1-, anti-Dvl2- and anti-Dvl3-specific antibodies. The three panels displayed at the bottom of the immunoblot set show blots stained with antibodies to well known subcellular marker proteins: Na+-K+-ATPase (plasma membrane), GAPDH (cytoplasm) and fibrillarin (nuclei), respectively. Representative blots are shown (top panel). Summary of quantified analysis of blots from SDS-PAGE are shown (bottom panel). The results are shown as mean values ± S.E. from 4–6 independent experiments. Dvl1 (blue line), Dvl2 (pink line) and Dvl3 (green line) are displayed.