
Figure 1
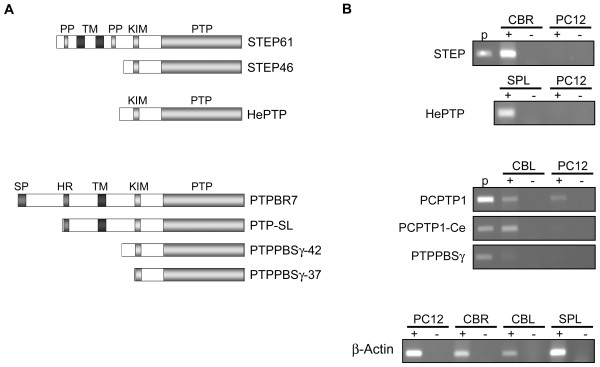
Tyrosine-specific MAPK phosphatases expressed in PC12 cells. A) Schematic diagrams of STEP (STEP61, STEP46), HePTP and PTPRR (PTPBR7, PTP-SL, PTPPBSγ-42, PTPPBSγ-37) protein isoforms. Mouse isoform nomenclature is given on the right. Signal peptides (SP), proline-rich and PEST domains (PP), transmembrane segments (TM), kinase-interacting motifs (KIM), hydrophobic regions (HR) and catalytic phosphotyrosine phosphatase domains (PTP) are indicated. B) Assessment of KIM-containing, tyrosine-specific PTP expression by RT-PCR. Rat protein nomenclature is indicated on the left, aligned with the diagrams of the mouse orthologs depicted in panel A). STEP and HePTP transcripts, as detected by RT-PCR (+) in mouse cerebrum (CRB) and spleen (SPL) RNA, respectively, are not found in PC12 cells. For rat PTPRR proteins (PCPTP1, PCPTP1-Ce, PTPPBSγ) isoform-specific primer sets were used on rat cerebellum (CBL) and PC12 total RNA. Samples lacking RT enzyme (-) and appropriate plasmids (p) served as negative and positive controls, respectively. A β-actin specific RT-PCR served as a positive control for the reverse transcriptase reactions.
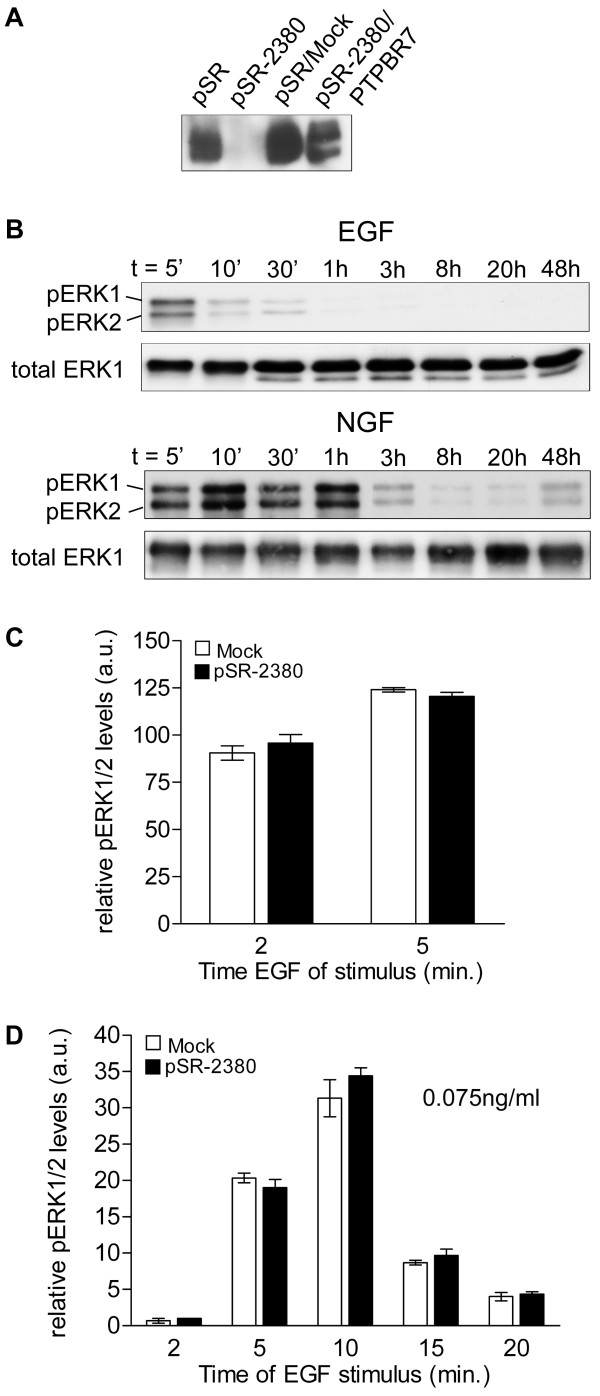
Figure 2
ERK activity profile is not affected by PCPTP1 depletion. A) RNAi-mediated knockdown of endogenous PCPTP1 in PC12 cells. PC12 cells stably expressing siRNA targeted to nucleotides 2380–2398 in PCPTP1 cDNA (pSR-2380) were generated via retroviral transduction. Empty vector (pSR) was used as control and PCPTP1 knockdown was rescued by transduction of pSR-2380-containing cells with a retroviral expression construct for the mouse ortholog PTPBR7. Equal amounts of protein from the resulting stable cell pools were subjected to immunoprecipitation using α-SL antiserum and captured proteins were analyzed on Western blots using monoclonal antibody 6A6. B) Transient and sustained ERK1/2 signaling in wild type PC12 cells. After overnight serum deprivation, cells were stimulated with 100 ng/ml EGF (upper panels) or 50 ng/ml NGF (lower panels) for the indicated time points. Cell lysates were subjected to Western blot analysis and phospho-ERK1/2 signals (pERK1, pERK2) were detected using a chemiluminescence imaging system. The same blot was reprobed with total ERK1 antibody to correct for loading differences. C) Transient ERK activity is not affected in PCPTP1 knockdown cells. Serum-starved cells were stimulated with 10 ng/ml EGF for 2 or 5 min, respectively, and harvested. Relative phospho-ERK1/2 levels in the protein lysates, determined as above, are presented as mean values ± SEM from three independent experiments. D) PCPTP1 knockdown in PC12 cells does not significantly alter ERK activity at reduced levels of EGF. Serum starved cells were stimulated with 0.075 ng/ml EGF for the indicated time points and relative phospho-ERK1/2 levels were determined as before. Results are mean values ± SEM (n = 4).
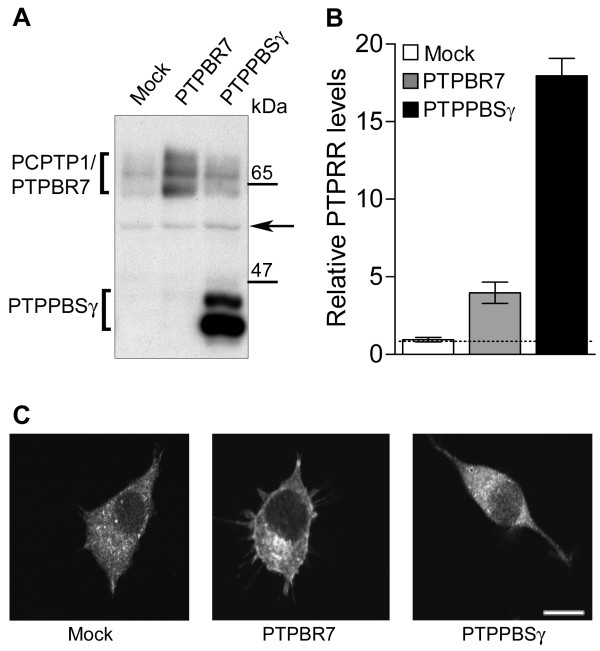
Figure 3
Expression of PTPRR isoforms in PC12 cells. A) PC12 cells were retrovirally transduced with expression constructs for mouse PTPRR isoforms, or mock-transduced. Equal amounts of cell lysates were subjected to 10% SDS-PAGE and immunoblotting. Rat PCPTP1, mouse PTPBR7 and mouse PTPPBSγ (indicated on the left) were detected using 6A6 antibody. Molecular size markers are indicated on the right. The arrow indicates a cross-reactive ~50 kDa background band. B) Quantitative representation of PTPRR expression levels as determined in A. PTPRR levels were corrected for loading differences using monoclonal α-tubulin antibody E7 immunostaining (not shown) as a control. Results are the mean values ± SEM of four individual pools of cells. C) Subcellular localization of stably expressed PTPRR protein isoforms in the transduced PC12 cells as determined by fluorescence microscopy using polyclonal α-SL antibody. Bar indicates 10 μm.
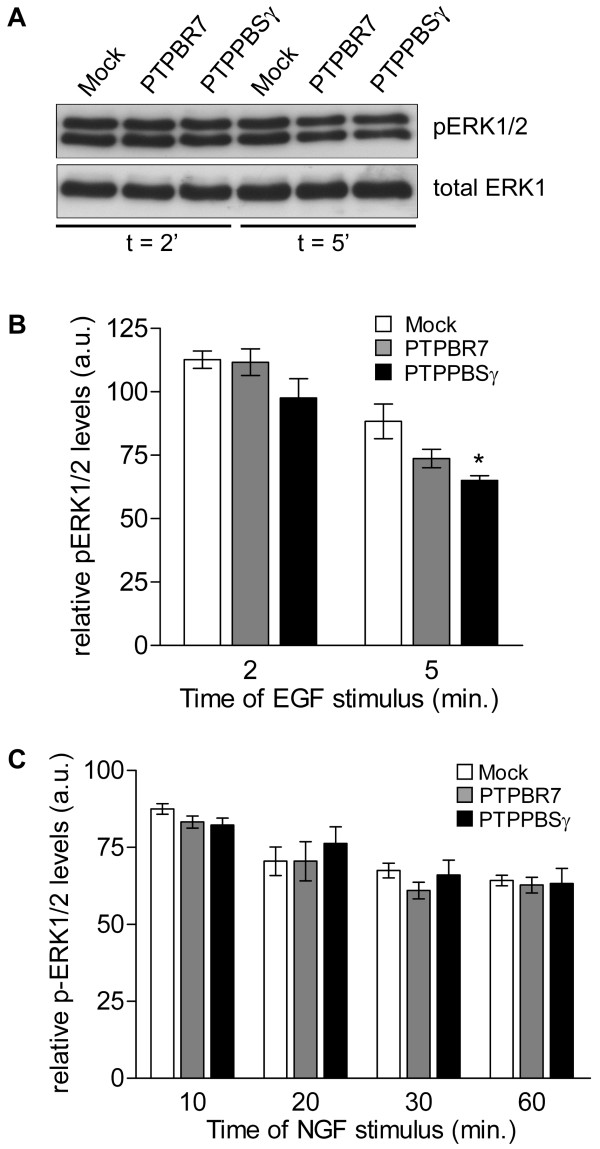
Figure 4
PTPRR effect on growth factor-induced ERK signaling. A) PC12 cells stably expressing PTPPBSγ show reduced transient ERK1/2 activity. Serum-starved pools of mock-transduced, PTPBR7 expressing or PTPPBSγ expressing cells were treated with 100 ng/ml EGF for 2 or 5 min before being lysed. Proteins were size-separated and immunoblotted. Representative images of phospho-ERK1/2 (upper panel) and total ERK1 (lower panel) immunoreactivity are depicted. B) Reduced transient ERK activity in PTPPBSγ expressing cells. Quantitative representation of relative phospho-ERK1/2 levels in cells stimulated with EGF for two or five minutes. Results are presented as mean values ± SEM from six independent experiments (Student's t-test, *p < 0.008). C) Increased PTPRR levels have no effect on NGF-induced ERK1/2 activity. Serum starved PC12 cell pools stably expressing PTPBR7 or PTPPBSγ were stimulated with 50 ng/ml NGF for the indicated time points (in min). Cells were then lysed and phospho-ERK1/2 were analysed on Western blots as in panels A-B. Results are the mean ± SEM of three independent experiments.
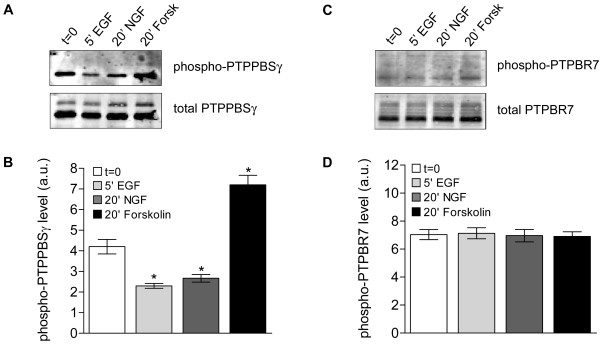
Figure 5
Assessment of PTPRR KIM domain phosphorylation. A) Lysates of PTPPBSγ expressing cells after overnight serum starvation (t = 0) and subsequent treatment with EGF, NGF or forskolin were subjected to immunoprecipitation with monoclonal antibody 6A6, and captured proteins were analyzed on blot using a phospho-PKA substrate antibody (upper panel) and 6A6 (lower panel). It was ascertained that the phospho-PKA substrate antibody remained unreactive towards PTPPBSγ mutant S94A (data not shown). B) Quantitative representation of phospho-PTPPBSγ levels determined as in A. Results, expressed as the ratio of the signals obtained with the phospho-PKA substrate antibody and the PTPRR antibody, are presented as mean values ± SEM (n = 3, Student's t-test, *p < 0.02). C) Representative image of PTPBR7 proteins, immunoprecipitated with antibody 6A6 from PTPBR7 expressing cells that received the indicated stimuli, as detected with phospho-PKA substrate antibody (upper panel) or 6A6 (lower panel). D) Quantitative representation of phospho-PTPBR7 levels as determined in C. Results are presented as mean values ± SEM (n = 3).
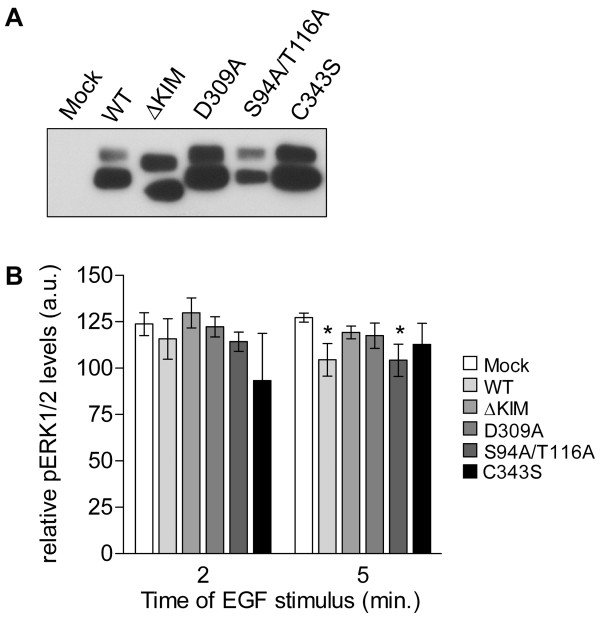
Figure 6
Wild type and non-phosphorylatable PTPPBSγ affect ERK activity. A) Expression analysis of wild type and mutant PTPPBSγ proteins. Equal amounts of protein from PC12 cells stably expressing wild type (WT) or mutant (ΔKIM, D309A, S94A/T114A, and C343S) PTPPBSγ were subjected to SDS-PAGE and immunoblot analysis using antibody 6A6. B) EGF-induced ERK1/2 activity in PC12 cells stably expressing PTPPBSγ protein variants. Serum starved cells that stably express PTPPBSγ mutants were stimulated with 10 ng/ml EGF for 2 or 5 min, and lysed. Relative phospho-ERK1/2 levels were determined via immunoblot analysis as described in the legends to Fig. 2. Results are presented as mean values ± SEM (n = 4, Student's t-test; *p < 0.05).