
Figure 1
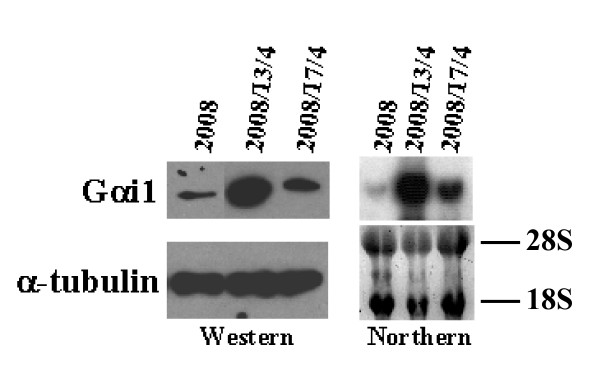
Expression of Gαi1 in the taxol-sensitive and -resistant cells. Whole cell lysate was prepared from each of the cell line by scraping into a buffer containing 20 mM Tris-HCl, pH 7.5, 150 mM NaCl, 1 mM EDTA, 1 mM EGTA, 1% (v/v) Triton-X-100, 0.5% (v/v) Nonidet P40, 2.5 mM Na pyrophosphate, 1 mM NaOV, 50 mM NaF and 1× protease inhibitor cocktail and incubated on ice for 15 minutes. The lysate was then centrifuged at 13,000 × g for 20 min and the supernatant was transferred to a fresh tube and stored at -80°C until use. Proteins (25 μg/lane) were separated on a SDS-PAG and transferred to a PVDF membrane. Western blotting analysis was performed using rabbit polyclonal antibody against Gαi1 and enhanced chemiluminescence reagents. Expression of α-tubulin was evaluated in the same lysates to ensure equal protein concentrations in each sample. For Northern blotting analysis, total RNA (20 μg) extracted from each cell was separated and transferred to Nylon membrane. Full-length Gαi1 cDNA was used as probe. The ethidium bromide stained RNA gel is shown in the bottom right-hand corner to ensure equal RNA loading.
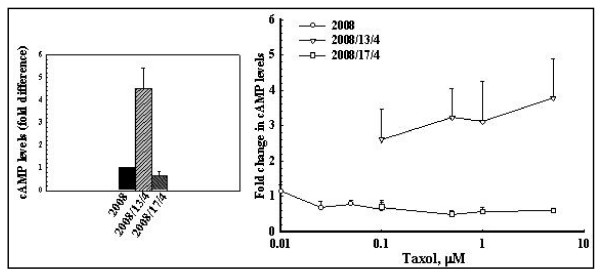
Figure 2
Intracellular cAMP levels in the parental and taxol resistant cells before and after treatment with taxol. cAMP levels were determined using an acetylated version of a cAMP measurement kit from Biomol Research Laboratories. A standard curve of known concentrations of acetylated cAMP was generated for each experiment. Untreated and taxol treated (16 hr) cells were processed as described (see Materials and Methods section). The cAMP level in the taxol resistant cells was compared with those observed in the 2008 cells (5.6 ± 1.1 pmol/mg protein; mean of 5 experiments each performed in duplicate) considered as 1.
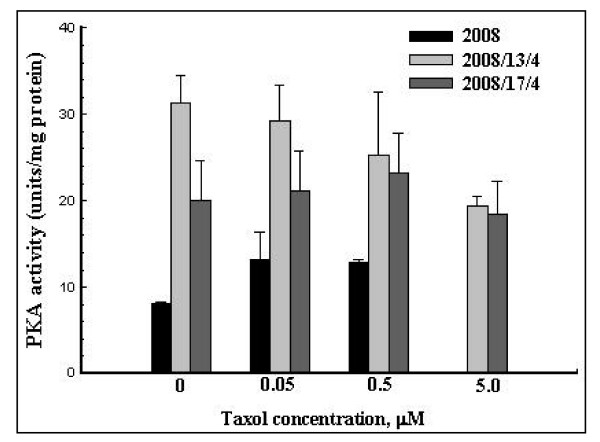
Figure 3
PKA activity in the parental and taxol resistant cells before and after treatment with taxol. PKA activity was determined using the Pierce Colorimetric Assay Kit that utilizes a fluorescent-labeled Kempeptide (a PKA-specific peptide (LRRASLG) substrate). Untreated and taxol treated cells were homogenized in a Dounce homogenizer (10 strokes with a tight fitting pestle) in a buffer containing 25 mM Tris-HCl, pH 7.4, 0.5 mM EDTA, 0.5 mM EGTA, 10 mM DTT and protease inhibitor cocktail. The homogenate was centrifuged at 13,000 × g for 20 min and the PKA activity was measured (in triplicate) in the supernatant fraction. Values shown are mean ± SD of 3 separate experiments.
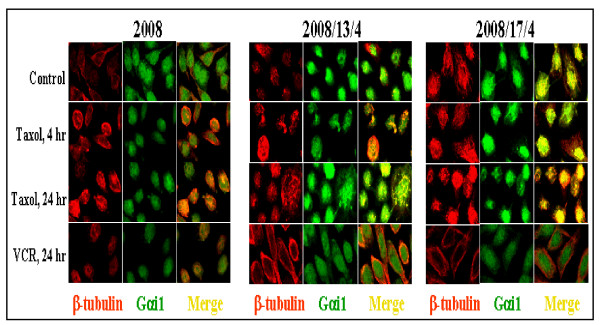
Figure 4
Immunolocalization of Gαi1 in the 2008, 2008/13/4 and 2008/17/4 cells, before and after treatment with taxol. To immunolocalize the Gαi1 protein, the 2008, 2008/13/4 and 2008/17/4 cells were grown on tissue culture-treated slides. After 48 hr, cells were treated with either taxol or vincristine (50 nM in case of 2008 cells, and 5 μM in case of the 2008/13/4 and 2008/17/4 cells) for 4 hr and 24 hr. At the end of each time period, the cells were fixed with 4% (w/v) paraformaldehyde and processed for immunostaining. After blocking nonspecific binding sites by incubating the slides with 5% (v/v) normal goat serum, the slides were incubated with primary antibody directed against Gαi1 (1:100 rabbit polyclonal) and β-tubulin (1:200 mouse monoclonal) for 1 hr. After washing in chilled PBS (3×), the slides were incubated with FITC-conjugated anti-rabbit antibody or rhodamine-conjugated anti-mouse antibody for 30 min. At the end of the incubation, the slides were washed again in PBS and mounted in media containing anti-fade. Localization of Gαi1 and β-tubulin was accomplished using an Olympus Confocal microscope.
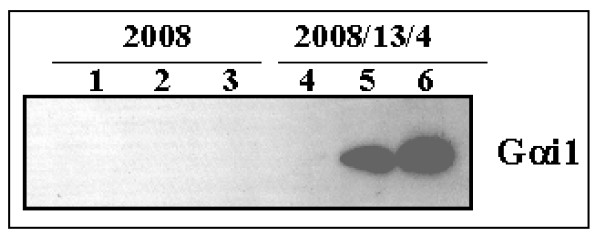
Figure 5
Taxol dose-dependent increase in the association of Gαi1 protein with the microtubules exclusively in the 2008/13/4 cells. The 2008 and 2008/13/4 cells were seeded at a density of 1 × 10⁶/ml and incubated under normal growth conditions for 36 hours. Thereafter, the 2008 cells untreated (lane 1) or treated for 24 hr with 25 nM (lane 2) and 500 nM (lane 3) taxol and the 2008/13/4 cells untreated (lane 4) or treated for 24 hr with 500 nM (lane 5) and 5 μM (lane 6) and then washed with chilled PBS (3 ×). The cytoskeletal fraction was isolated essentially as described previously [22]. Briefly, the attached cells were incubated in a microtubule-stabilizing buffer (0.1 M PIPES, 1 mM EGTA, 1 mM MgSO4, 2 M glycerol, pH 8.0) for 20 min. Thereafter, the cytosolic protein were removed by incubating the cells in the microtubule stabilizing buffer containing 0.1% NP-40 and protease inhibitor cocktail for 20 min. The cytoskeletal fraction (attached to the plastic dishes) was scraped into RIPA buffer (PBS containing 1% NP-40, 0.5% sodium deoxycholate and 0.1% SDS) containing protease inhibitor cocktail. The cytoskeletal fraction (5 μg protein/lane) was then subjected to SDS-PAGE. The separated proteins were transferred to PVDF membranes and Western blotting was performed using the polyclonal antibody against Gαi1.
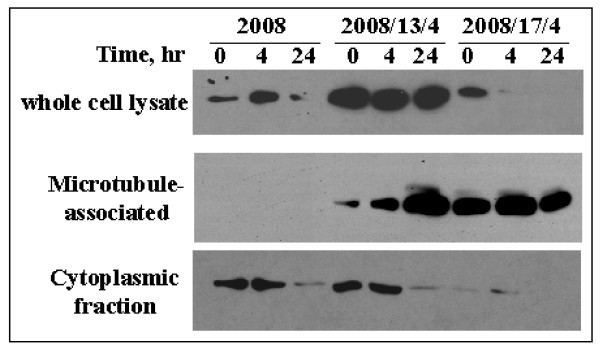
Figure 6
Differential partitioning of Gαi1 to the microtubule fraction in the taxol-resistant cells. The 2008, 2008/13/4 and 2008/17/4 cells were seeded at a density of 1 × 10⁶ cells/plate and allowed to incubate in complete growth media for 36 hours. The cells were then treated with taxol (500 nM) for the indicated time. At the end of each time period, cells were processed for extraction of whole cell lysates (as described in Fig. 1), cytoskeletal fractions (as described in Fig. 5), cytoplasmic and nuclear fraction (utilizing the protocol supplied by manufacturer of the NE-PER extraction kit) and membrane fraction (utilizing the single step Mem-PER extraction kit). Protein (5 – 20 μg/lane) from each fraction were resolved on a 12% (w/v) SDS-PAG and then transferred to a PVDF membrane. Western blotting was performed utilizing the Gαi1 polyclonal antibody.
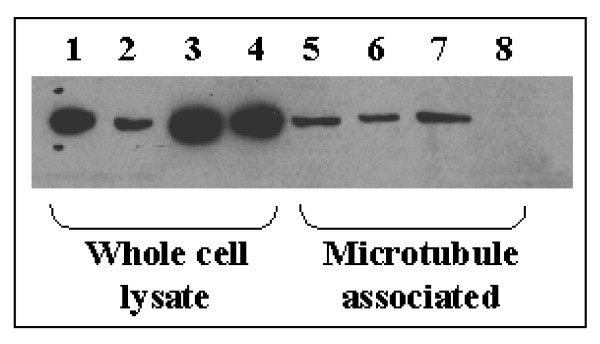
Figure 7
Effect of Vincristine on the levels of Gαi1 in the whole cell lysate and cytoskeletal fraction from 2008 and 2008/13/4 cells. The protein lysate (30 μg/lane) from untreated (lane 1,3,5,7) and vincristine treated (lane 2, 4, 6, 8) 2008 (lanes 1,2,5,6) and 2008/13/4 (lane 3,4,7,8) cells were separated by SDS-PAGE and then transferred to PVDF membrane. Presence of Gαi1 was assessed as described in Fig. 1.