
Table 1
Measures of the rest-activity cycle at baseline and after transition into DST
| Variable | Before | After |
| Mean (SD) | Mean (SD) | |
| IS | 0.67 (0.13) | 0.75 (0.07) |
| IV | 0.91 (0.26) | 0.92 (0.23) |
| RA | 0.93 (0.03) | 0.92 (0.05) |
| tau (min) | 1446.40 (9.00) | 1440.60 (10.82) |
Abbreviations: SD = standard deviation, IS = intra-daily stability, IV = intra-daily variability, RA = relative amplitude, tau = circadian period.
Table 2
Changes due to transition into DST among short- and long-sleepers
| Variable | Mean | SD | P value |
| Short sleepers | |||
| IS | -0.01 | 0.08 | 0.07 |
| IV | -0.14 | 0.12 | 0.04 |
| RA | +0.02 | 0.02 | 0.3 |
| tau | +1.00 | 16.12 | 0.4 |
| Long sleepers | |||
| IS | -0.15 | 0.12 | 0.08 |
| IV | +0.13 | 0.21 | 0.05 |
| RA | -0.01 | 0.01 | 0.5 |
| tau | +10.60 | 16.12 | 0.4 |
Abbreviations: SD = standard deviation, IS = intra-daily stability, IV = intra-daily variability, RA = relative amplitude, tau = circadian period.
Table 3
Changes due to transition into DST among morning and intermediate types
| Variable | Mean | SD | P value |
| Morning types | |||
| IS | -0.16 | 0.14 | 0.1 |
| IV | +0.05 | 0.31 | 0.5 |
| RA | +0.01 | 0.02 | 0.9 |
| tau | +16.00 | 17.66 | 0.1 |
| Intermediate types | |||
| IS | -0.03 | 0.08 | 0.2 |
| IV | -0.04 | 0.15 | 0.6 |
| RA | +0.01 | 0.02 | 0.9 |
| tau | -1.00 | 11.66 | 0.2 |
Abbreviations: SD = standard deviation, IS = intra-daily stability, IV = intra-daily variability, RA = relative amplitude, tau = circadian period.
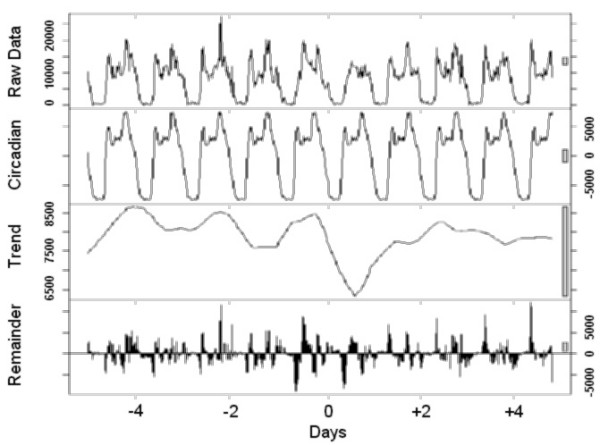
Figure 1
All participants. Data on the rest-activity cycle in 10 healthy persons for 10 days around the transition into DST in 2003. Graphics consist of four panels. The first panel from the top shows the original raw data, the second the circadian effect, the third the trend effect and the fourth the remainder. The remainder cannot be explained by the circadian nor trend effects. The scale bars to the right represent the corresponding unit in each figure.
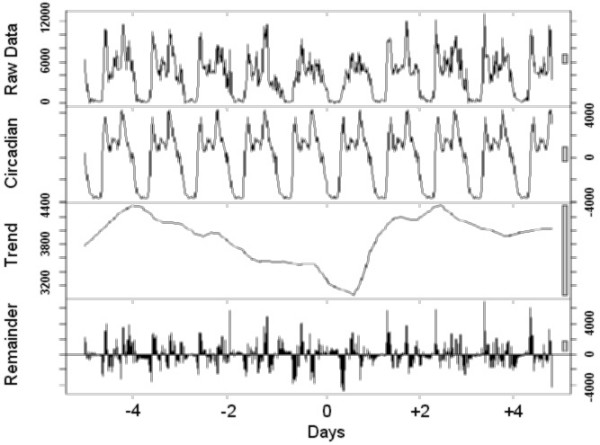
Figure 2
Short-sleepers. Data on the rest-activity cycle in short-sleepers for 10 days around the transition into DST in 2003.
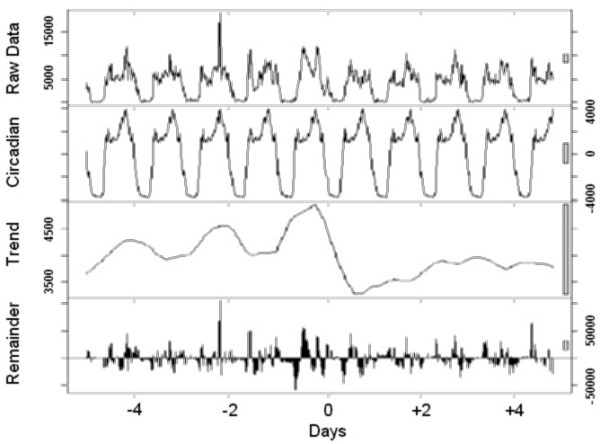
Figure 3
Long-sleepers. Data on the rest-activity cycle in long-sleepers for 10 days around the transition into DST in 2003.
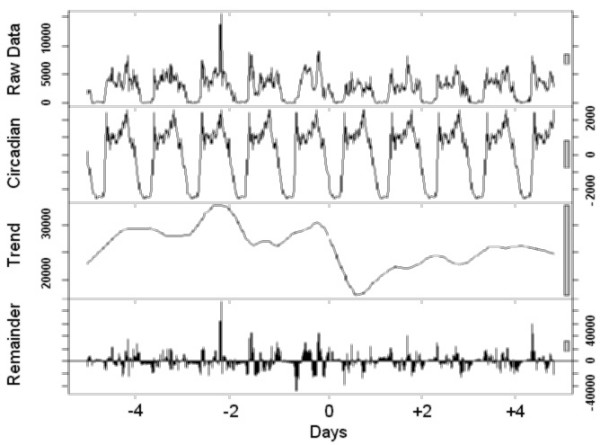
Figure 4
Morning types. Data on the rest-activity cycle in morning types for 10 days around the transition into DST in 2003.
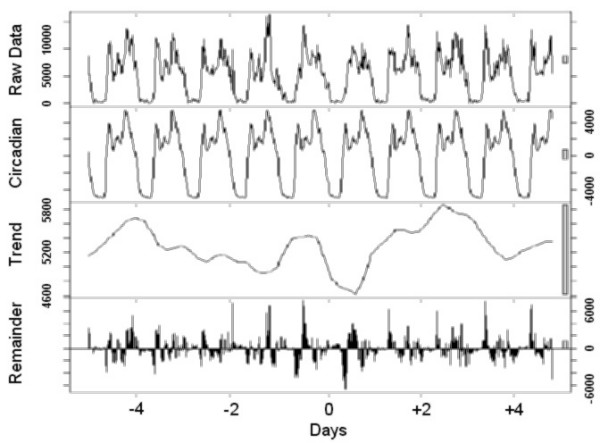
Figure 5
Intermediate types. Data on the rest-activity cycle in intermediate types for 10 days around the transition into DST in 2003.