
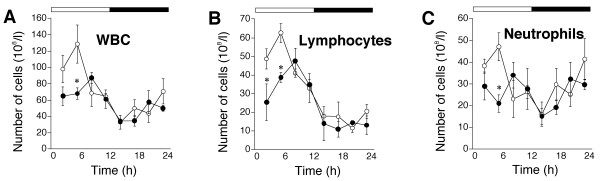
Figure 1
Circadian variations in peripheral circulatingleukocytes in Clock mutant mice. (A) Total number of white blood cells (WBC), (B) number of lymphocytes, (C) number of neutrophils. Open and filled circles, values from wild-type and Clock mutant mice, respectively. Open and solid bars, lights on and off, respectively. Values represent means ± SEM (n = 3). Significant differences between genotypes are shown as *P < 0.05.
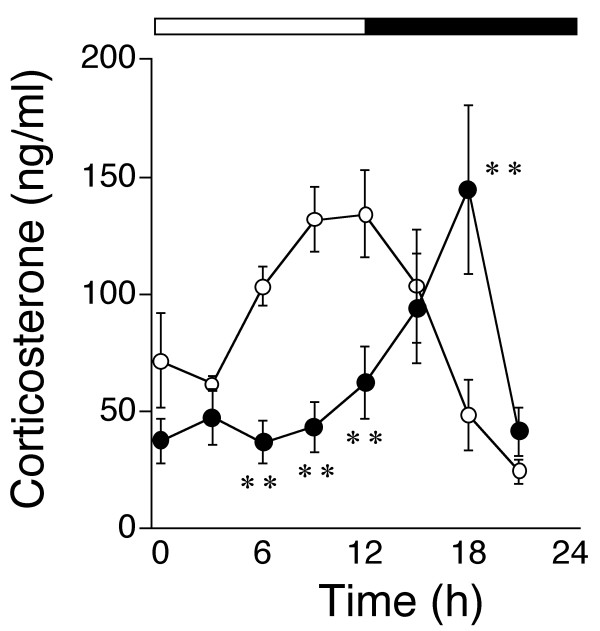
Figure 2
Circadian variations in plasma corticosterone (CS) levels in Clock mutant mice. Open and filled circles indicate values from wild-type and Clock mutant mice, respectively. Open and solid bars represent lights on and off, respectively. Values represent means ± SEM (n = 4). Significant differences between genotypes are shown as **P < 0.01.
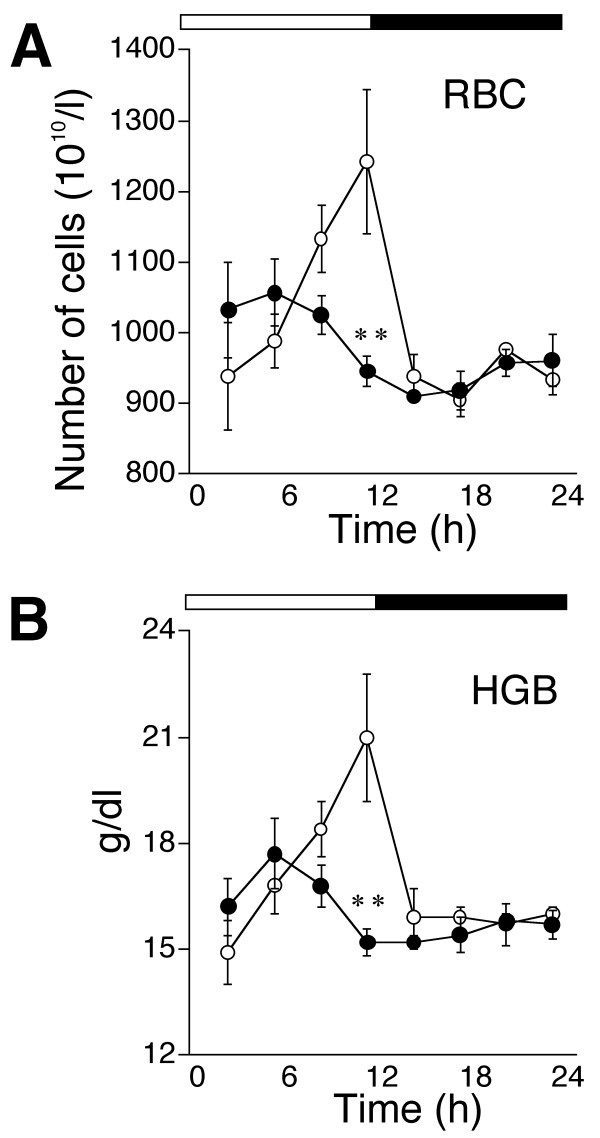
Figure 3
Circadian variations in peripheral circulating redblood cells (RBC) in Clock mutant mice. (A) Number of RBC and (B) blood levels of hemoglobin (HGB). Open and filled circles, values from wild-type and Clock mutant mice, respectively. Open and solid bars represent lights on and off, respectively. Values represent means ± SEM (n = 3). **P < 0.01, significant difference between genotypes.
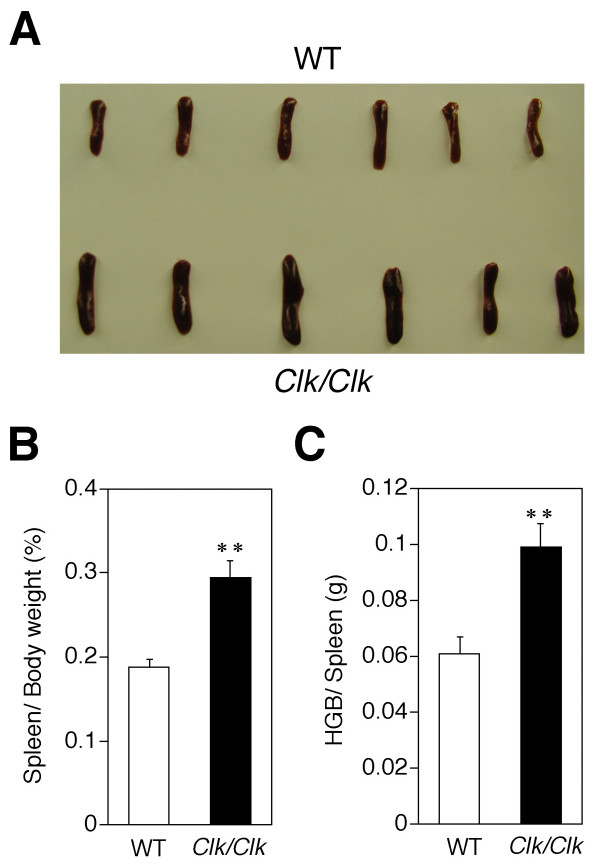
Figure 4
Swollen red spleens from Clock mutant mice. (A) Spleens from wild-type and Clock mutant mice. (B) Graphs show ratio (%) of wet weight of spleen per body weight in wild-type and Clock mutant mice. (C) Graphs show hemoglobin (HGB) content in wild-type and Clock mutant mice. Values represent means ± SEM (n = 6). **P < 0.01, significant difference between genotypes.