

Figure 1
Brief description of steps to determine the dominant cycle using spectral analysis. A: Plot of original data for pulse rate (PR). PR was measured once every 10 seconds and averaged into 1 minute time block for 1440 minutes; N = 1440 observation. B: Periodogram intensities for PR (plotted on linear scale). The largest peak of the periodogram was selected (arrow) as representative cyclic component that represent the largest amount of variance. C: The corresponding cycle of the largest peak in the periodogram intensities was reconstructed from the FFT coefficient to fit the sinusoidal function: χt = μ + Acos(ω t) + Bsin(ω t). The bold line is the detected cycle (period: 1440 minutes = 24 hours) superimposed on the original data.
Table 1
Demographic characteristics of 187 preterm and term neonates.
| Variables/Categories | n (%) |
| Gender (boys/Girls) | 114 (61)/73 (39) |
| Gestational age (wks), median (range) | 34 (23–42) |
| < 28 | 17 (9.1) |
| 28–32 | 49 (26.2) |
| 33–36 | 58 (31) |
| ≥37 | 63 (33.7) |
| Birth Weight (g), median (range) | 1968 (454–4132) |
| < 1000 | 27 (14.4) |
| 1000–1499 | 31 (16.6) |
| 1500–1999 | 38 (20.3) |
| ≥2000 | 91 (48.7) |
| Apgar score 1 min/5 min, median (range) | 8 (0–10)/9 (2–10) |
| Age at hospitalization (day), median (range) | 0 (0–9) |
| Hospitalization (day), median (range) | 32 (5–182) |
| Caesarian Section | 96 (51.3) |
| Multiple gestation | 4 (2.3) |
| Intubation | 111(59.4) |
| Oxygenation | 72 (38.5) |
| Birth asphyxia | 27 (14.4) |
| Intrauterine growth retardation | 23 (12.3) |
| Respiratory distress syndrome | 31 (16.6) |
| Transient tachypnea of the newborn | 38 (20.3) |
Data are expressed as mean ± SD or n (%).
Table 2
Descriptive profiles for significant cycles of HR, PR, RR and SpO2.
| Period | Period 1 | Period 2 | Period 3 | Period 4 | |
| Sampling | (0–3) | (4–6) | (7–13) | (14–21) | |
| n | 116 | 114 | 125 | 106 | |
| Eligible sample* | HR | 82 (70.7) | 64 (56.1) | 91 (72.8) | 67 (63.2) |
| PR | 101 (87.1) | 88 (77.2) | 106 (84.8) | 84 (79.2) | |
| RR | 99 (85.3) | 85 (74.6) | 104 (83.2) | 84 (79.2) | |
| SpO2 | 103 (88.8) | 89 (78.1) | 106 (84.8) | 85 (80.2) | |
| Significant cycle** | HR | 80 (98) | 64 (100) | 89 (98) | 67 (100) |
| PR | 100 (99) | 87 (99) | 104 (98.1) | 83 (99) | |
| RR | 90 (91) | 84 (99) | 97 (93.3) | 79 (94) | |
| SpO2 | 94 (91.3) | 86 (97) | 103 (97) | 78 (92) | |
| Circadian cycle*** | HR | 19 (23.8) | 11 (17.2) | 20 (22.5) | 13(19.4) |
| PR | 20 (20) | 16 (18.4) | 20 (19.2) | 16 (19.3) | |
| RR | 25 (27.8) | 28 (33.3) | 21 (21.6) | 11 (13.9) | |
| SpO2 | 15 (16) | 10 (11.6) | 17 (16.5) | 15 (19.2) |
Data are shown in n (%). Parentheses are percentages of * eligible samples in all samples, ** significant cycles in all eligible samples, and *** circadian cycles in significant cycles.
Table 3
Distribution of circadian cycles according to gestational age groups in each period.
| Gestational age | Period 1 | Period 2 | Period 3 | Period 4 | |||||
| Groups | n | (0–3 d) | n | (4–6 d) | n | (7–13 d) | n | (14–21 d) | |
| PR | <28 wks | 10 | 4 (40) | 12 | 3 (25) | 12 | 5 (41.7) | 13 | 4 (30.8) |
| 28–32 wks | 26 | 6 (23.1) | 22 | 6 (27.3) | 42 | 11 (26.2) | 39 | 9 (23.1) | |
| 33–36 wks | 29 | 5 (17.2) | 26 | 5 (19.2) | 31 | 2 (6.5) | 23 | 3 (13.0) | |
| ≥37 wks | 35 | 5 (14.3) | 27 | 2 (7.4) | 19 | 2 (10.5) | 8 | 0 (0) | |
| RR | < 28 wks | 7 | 1 (14.3) | 11 | 1(9.1) | 13 | 5 (38.5) | 13 | 0 (0) |
| 28–32 wks | 24 | 8 (33.3) | 20 | 9 (45) | 38 | 9 (23.7) | 36 | 8 (22.2) | |
| 33–36 wks | 25 | 8 (32) | 27 | 9 (33.3) | 28 | 3 (10.7) | 22 | 2 (9.1) | |
| ≥37 wks | 34 | 8 (23.5) | 26 | 9 (34.6) | 18 | 4 (22.2) | 8 | 1(12.5) | |
| SpO2 | < 28 wks | 10 | 0 (0) | 12 | 3 (25) | 12 | 3 (25) | 13 | 2 (15.4) |
| 28–32 wks | 25 | 5 (20) | 20 | 3 (15) | 40 | 7 (17.5) | 37 | 9 (24.3) | |
| 33–36 wks | 26 | 5 (19.2) | 25 | 5 (20) | 32 | 4 (12.5) | 20 | 3 (15) | |
| ≥37 wks | 33 | 5 (15.2) | 29 | 4 (13.8) | 19 | 3 (15.8) | 8 | 1 (12.5) |
Data are shown in n (%).

Figure 2
Amplitudes (A) and amplitude indexes (B) of all detected cycle of PR over the 4 periods for 4 gestational age groups infants. Data are shown in Mean ± SD. The dark bar is for < 28 wks, the gray bar is for 28–32 wks, the light gray bar is for 33–36 wks, and white bar is for ≥ 37 wks. * p < 0.01, ** p < 0.001, *** p < 0.0001, according to ANOVA. The sample size for each gestational age group is shown in Table 2.
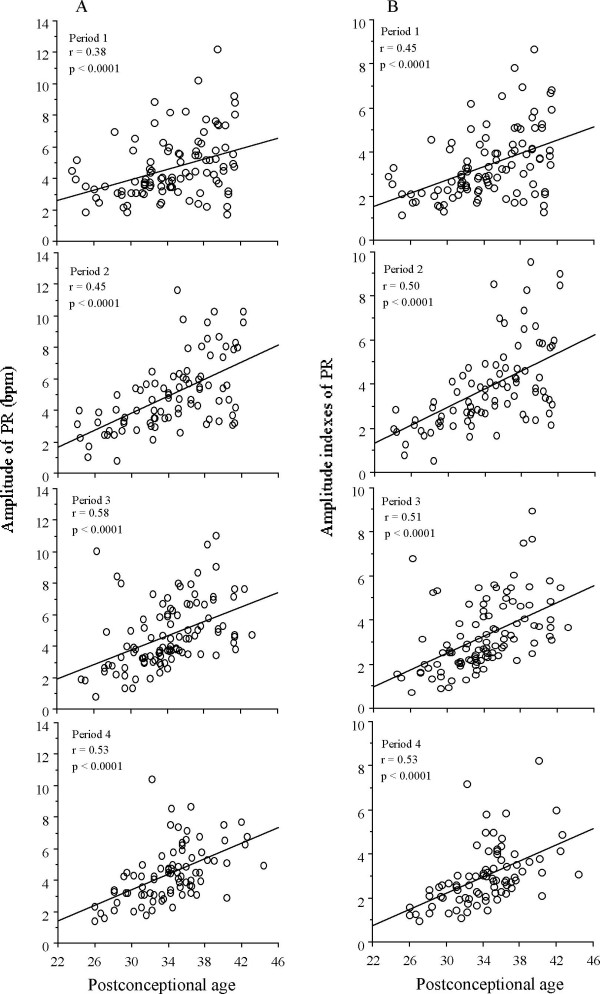
Figure 3
Linear regression (and coefficients of correlation) for amplitudes and amplitude indexes of PR as functions of postconceptional age. A significant increase in amplitudes and amplitude indexes with postconceptional age is present in all period in PR.
Table 4
Univariate analysis for association of clinical parameters with existence of circadian rhythmicities in PR in Period 1.
| Clinical variables | Cycle 1440 (n = 20) | ≤ 720 (n = 80) | p |
| Gestational age (wks) | 32.7 ± 4.9 | 34.2 ± 4.6 | NS |
| Birth weight (g) | 1930 ± 983 | 2077 ± 900 | NS |
| Apgar Score < 6 (5 min) | 1 (5) | 10 (12.7) | NS |
| Asphyxia | 4 (20) | 17 (21.3) | NS |
| RDS | 4 (20) | 14 (17.3) | NS |
| IUGR | 3 (15) | 6 (7.5) | NS |
| Mean of variables | |||
| Mean PR (/min) | 140.2 ± 8.6 | 135.5 ± 12.8 | NS |
| Mean RR (/min) | 45.7 ± 8.5 | 43.0 ± 8.5 | NS |
| Mean SpO2 (%) | 97.9 ± 1.1 | 97.9 ± 1.3 | NS |
| Treatment of data sampling | |||
| Oxygenation | 18 (90) | 46 (57.5) | 0.02 |
| Intubation | 10 (50) | 25 (31.3) | NS |
| Aminophylline | 1 (5) | 4 (5) | NS |
| Phenobarbital | 0 (0) | 1 (1.3) | NS |
| Midazolam | 3 (15) | 6 (7.5) | NS |
Data are expressed as mean ± SD or n (%). Mann-Whitney U test was performed for continuous variables and Fisher's exact test was performed for categorical variables.