
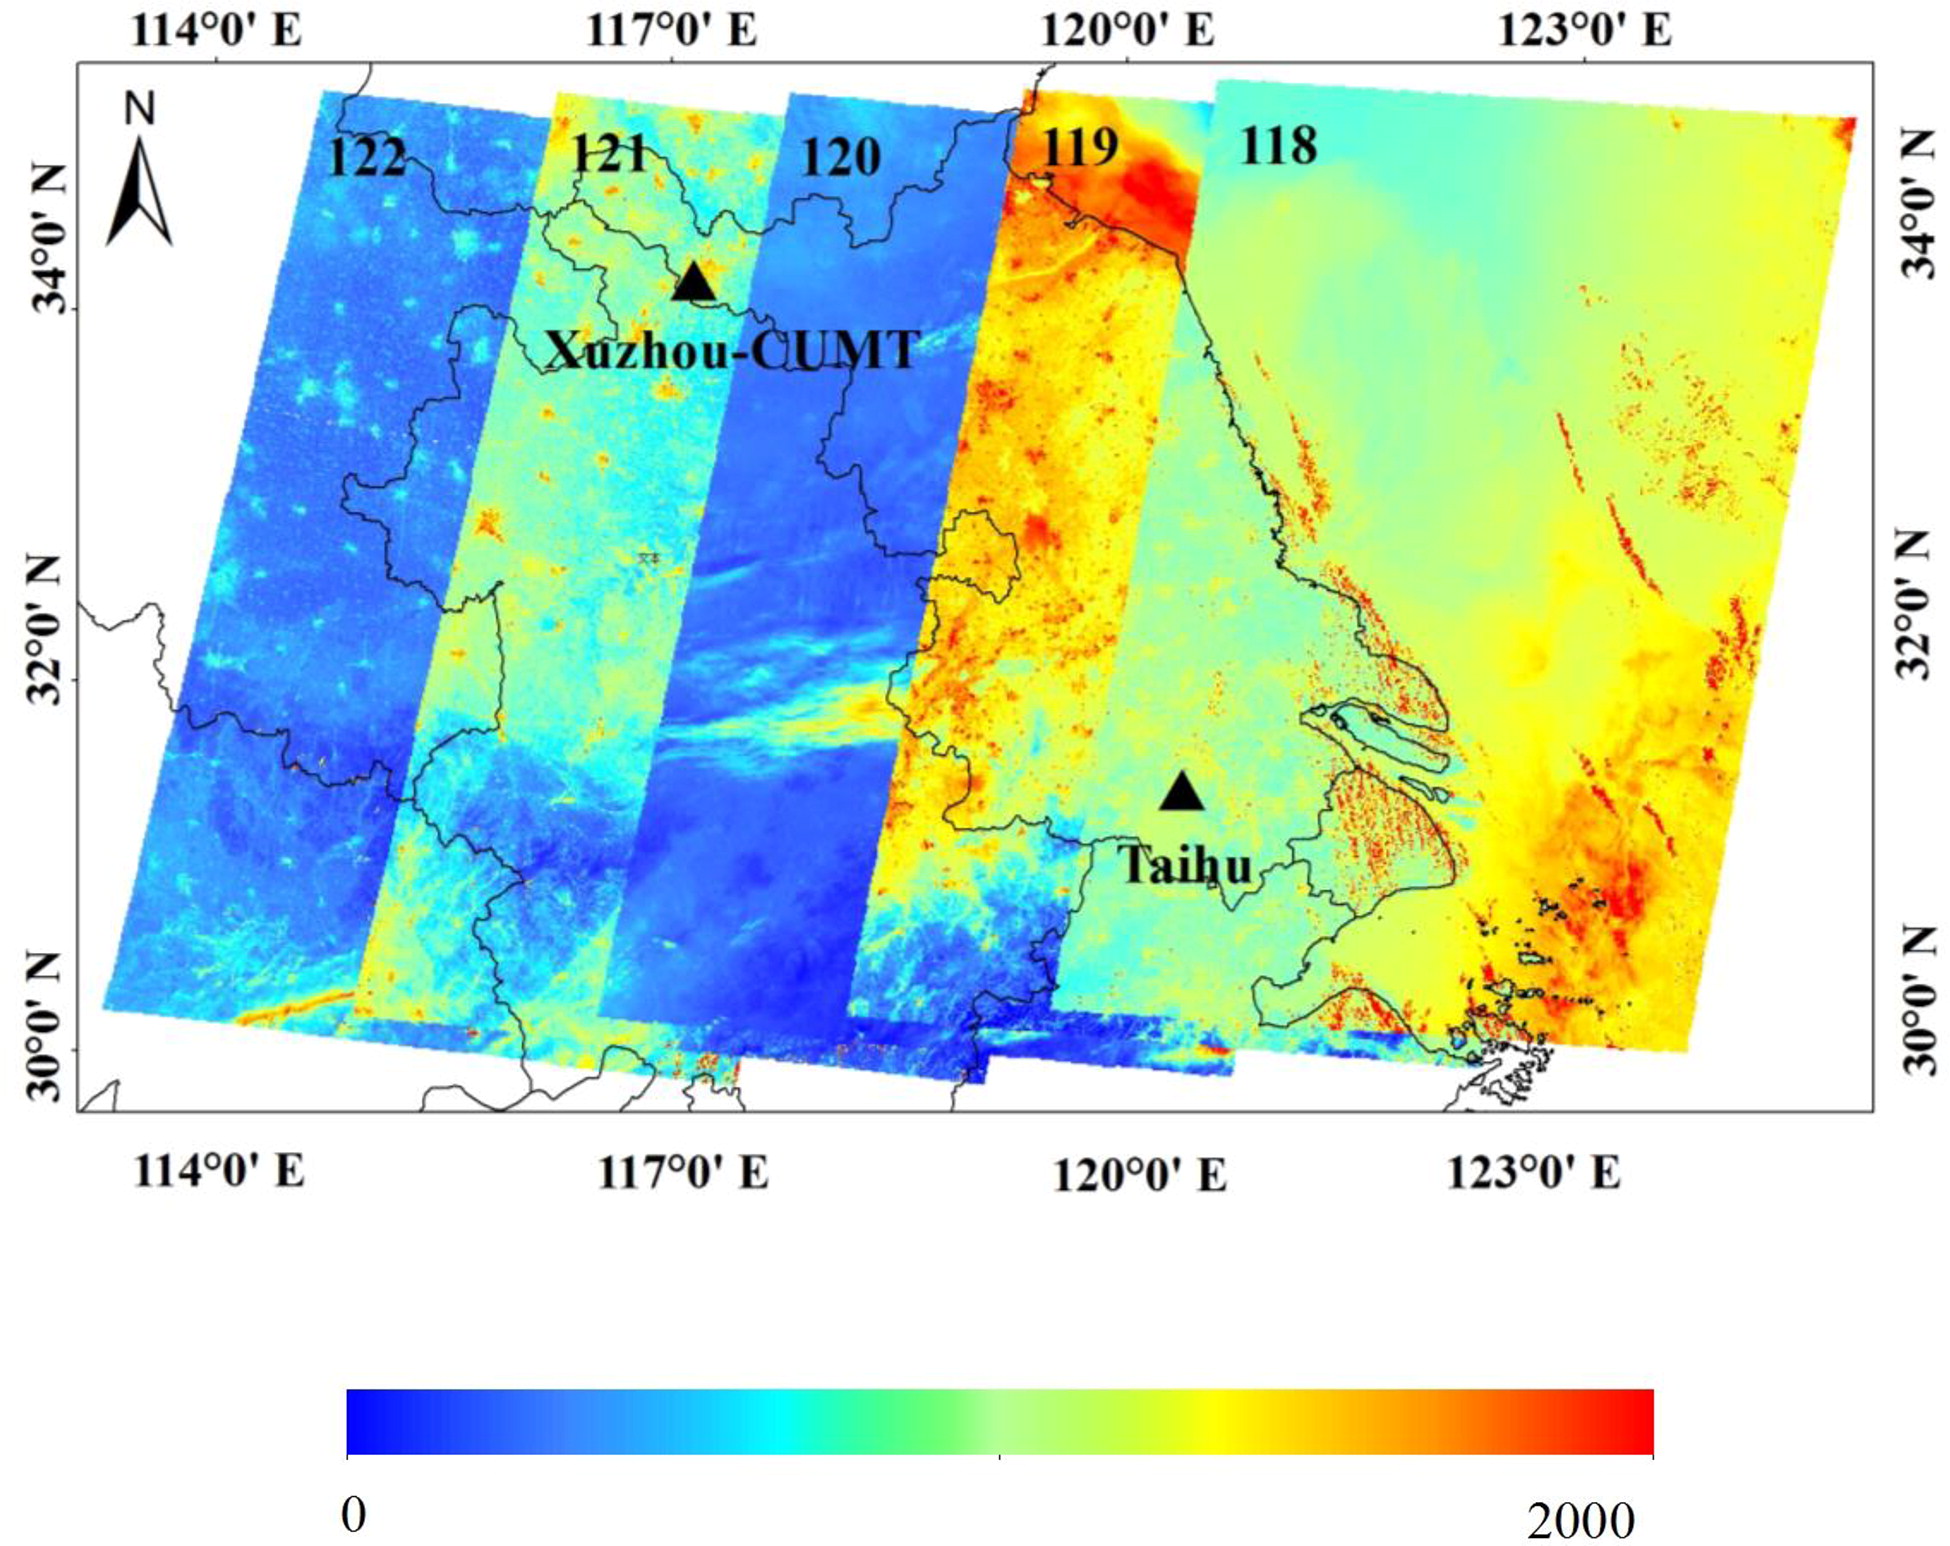
Figure 1.
Remote sensing image of the study area (Radiance data) (Left: path 122, Right: path 118).
Table 1.
The spatial resolution of MISR data (m).
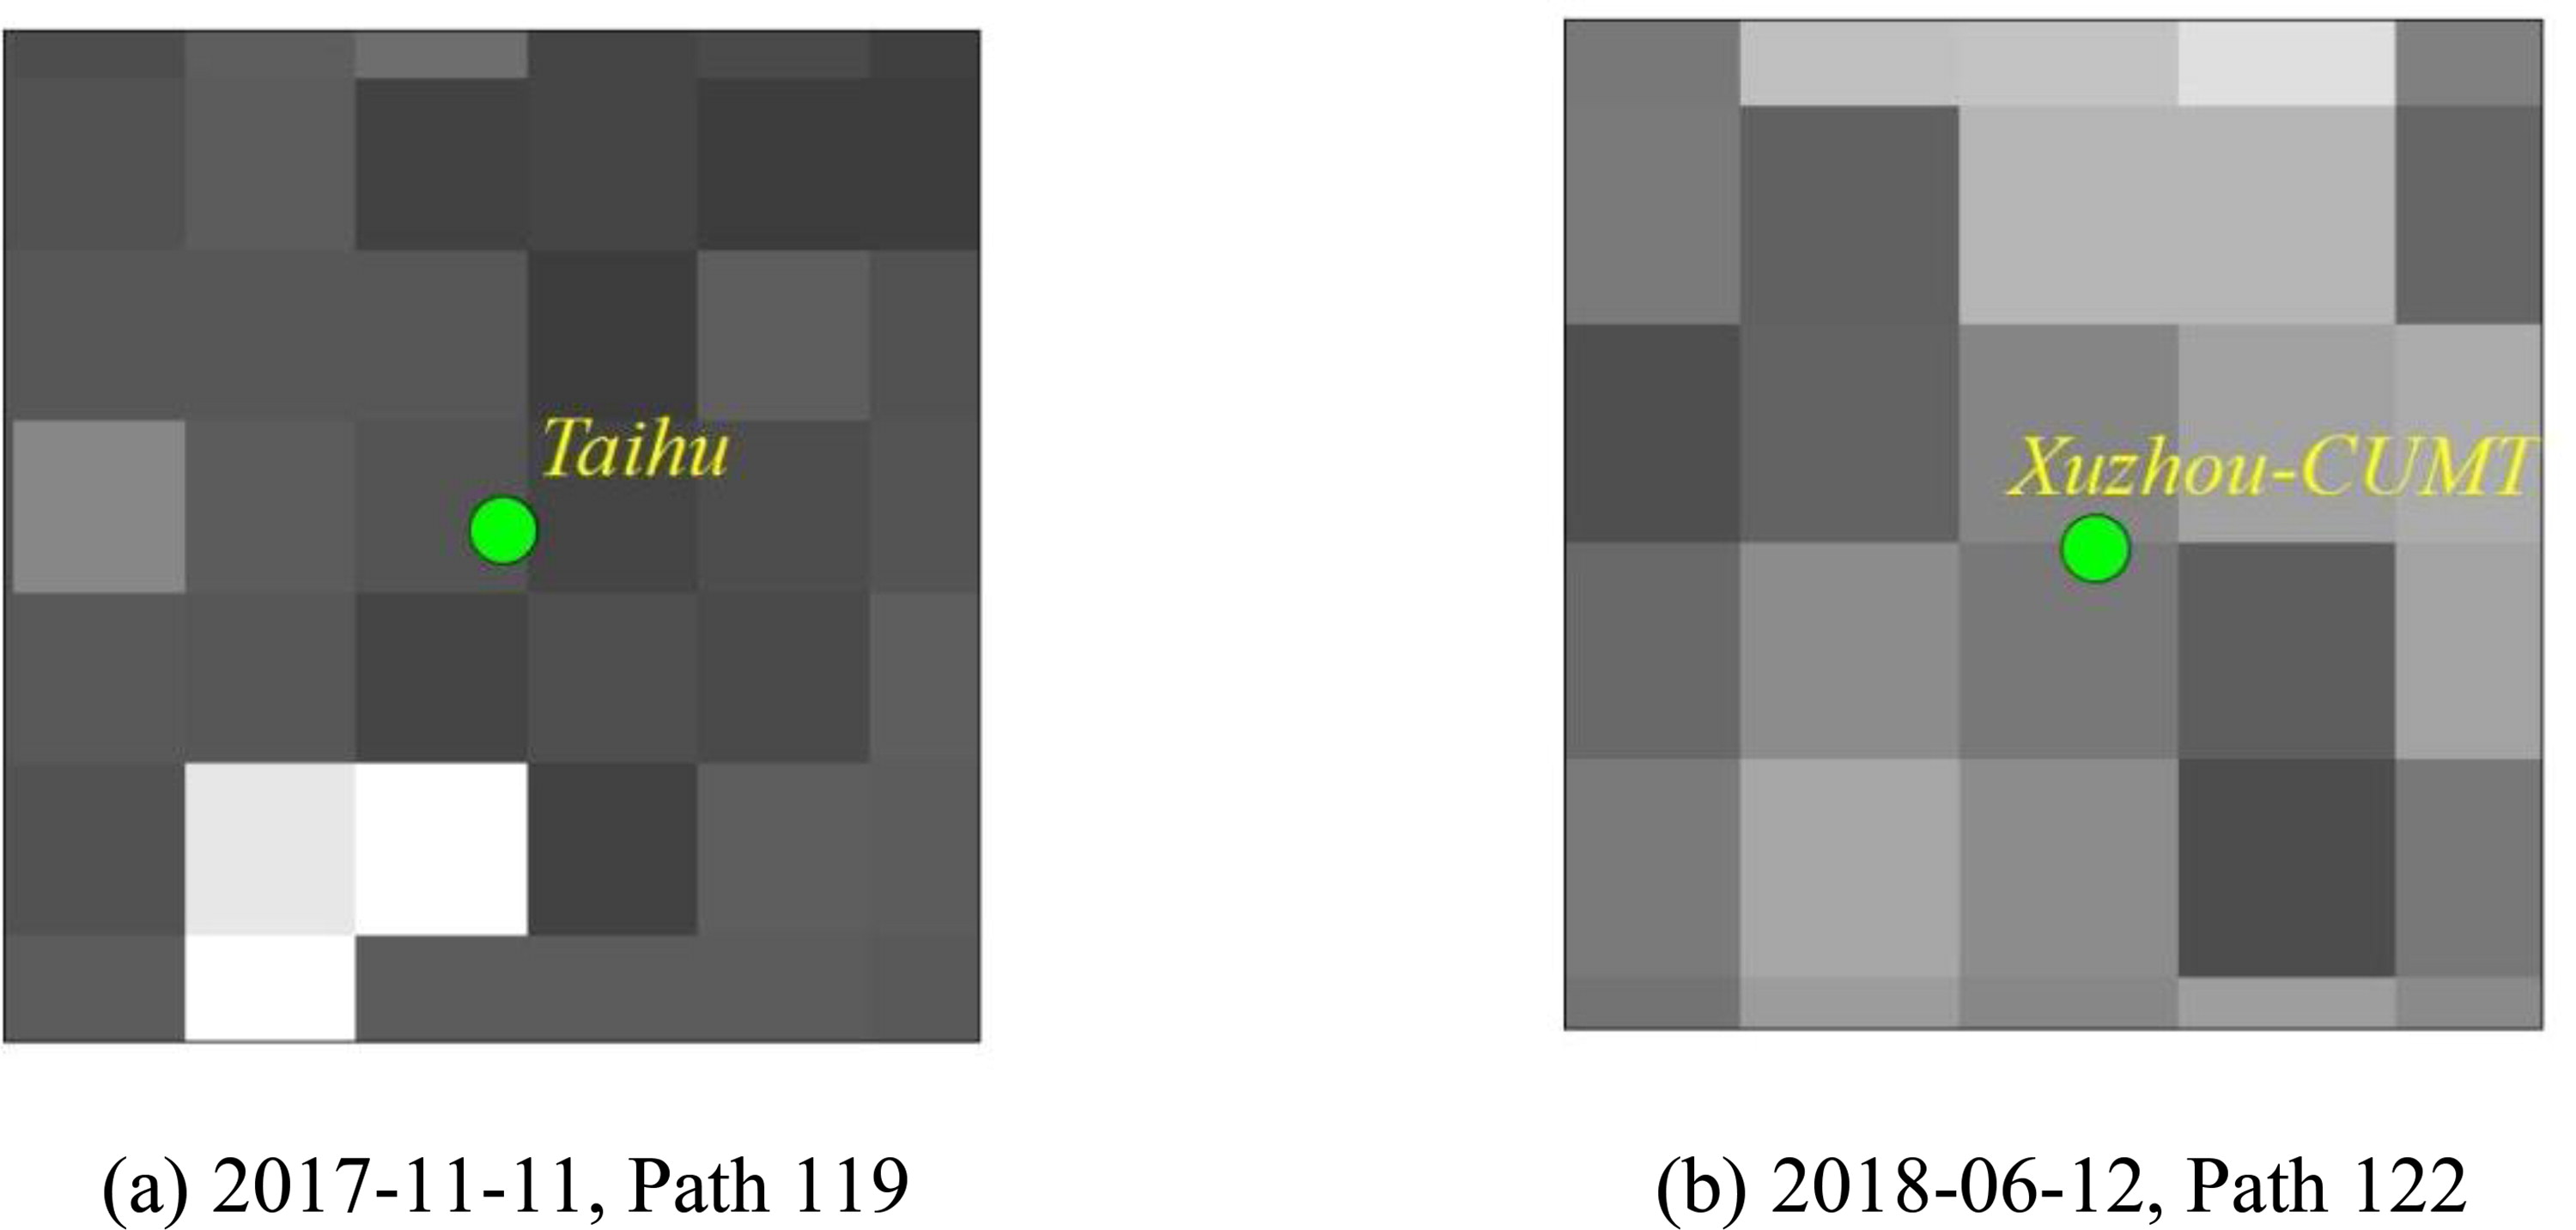
Figure 2.
Map of the verification matching method of Taihu and Xuzhou-CUMT stations.
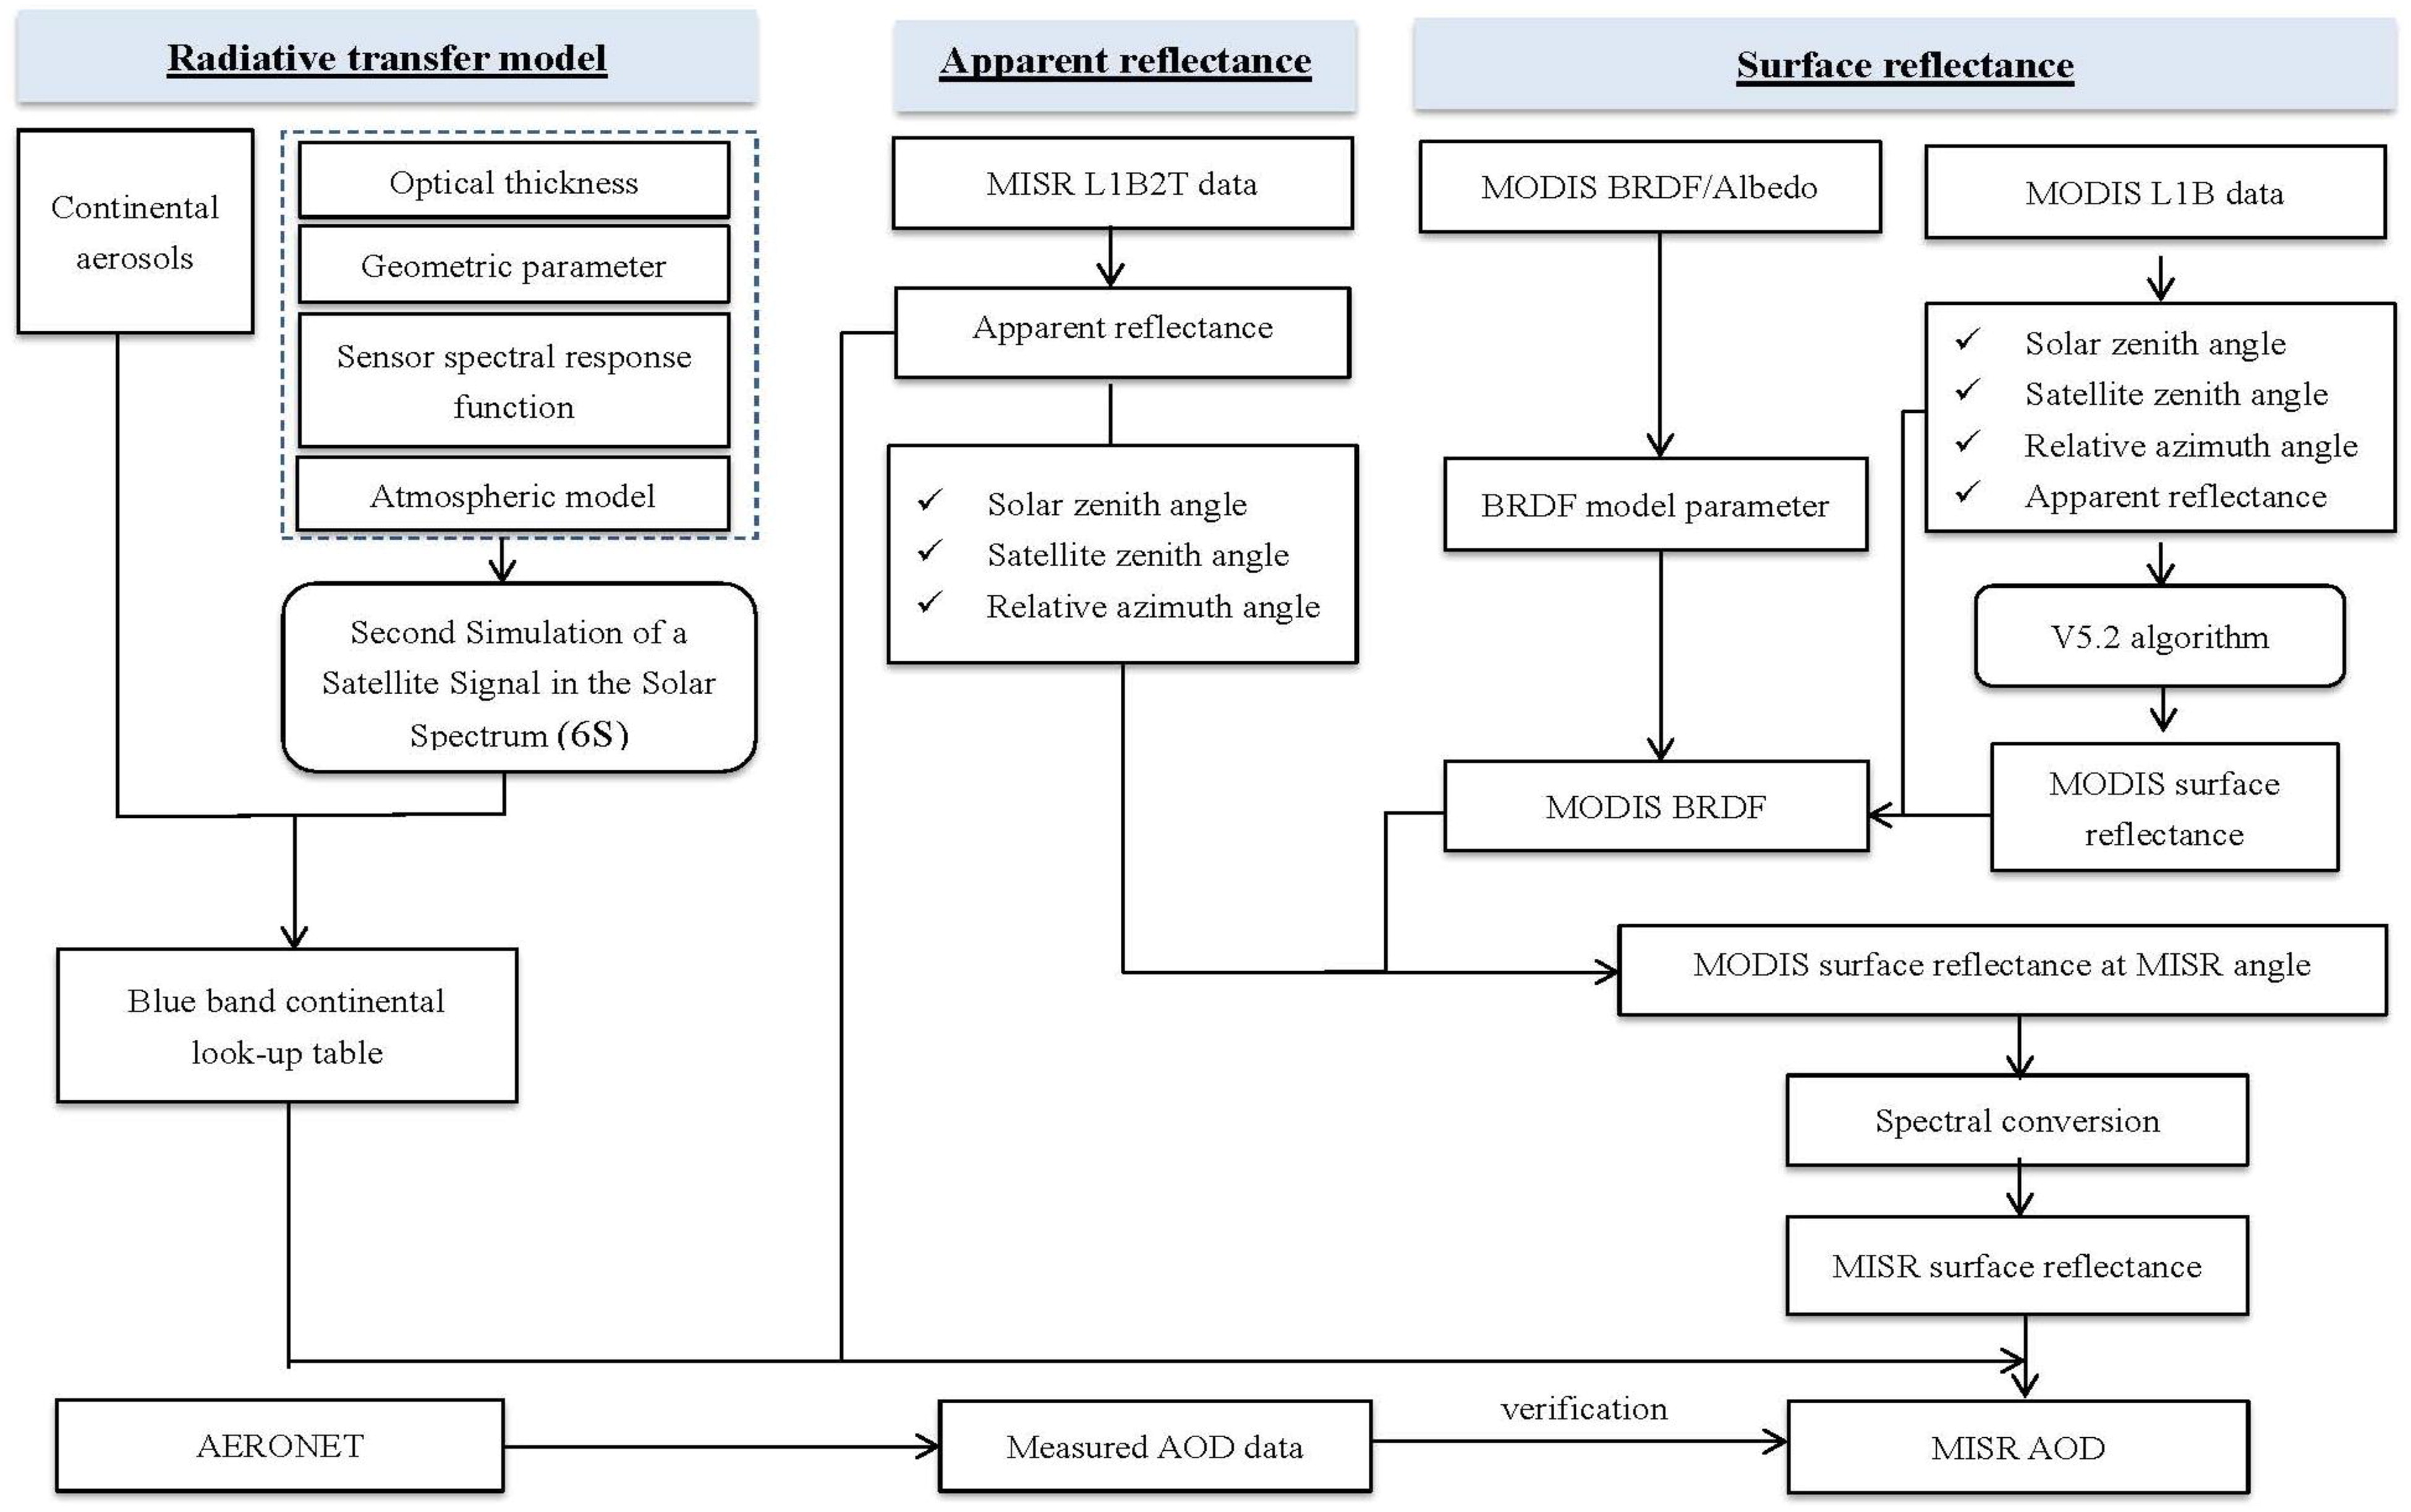
Figure 3.
Flowchart of algorithm processing.
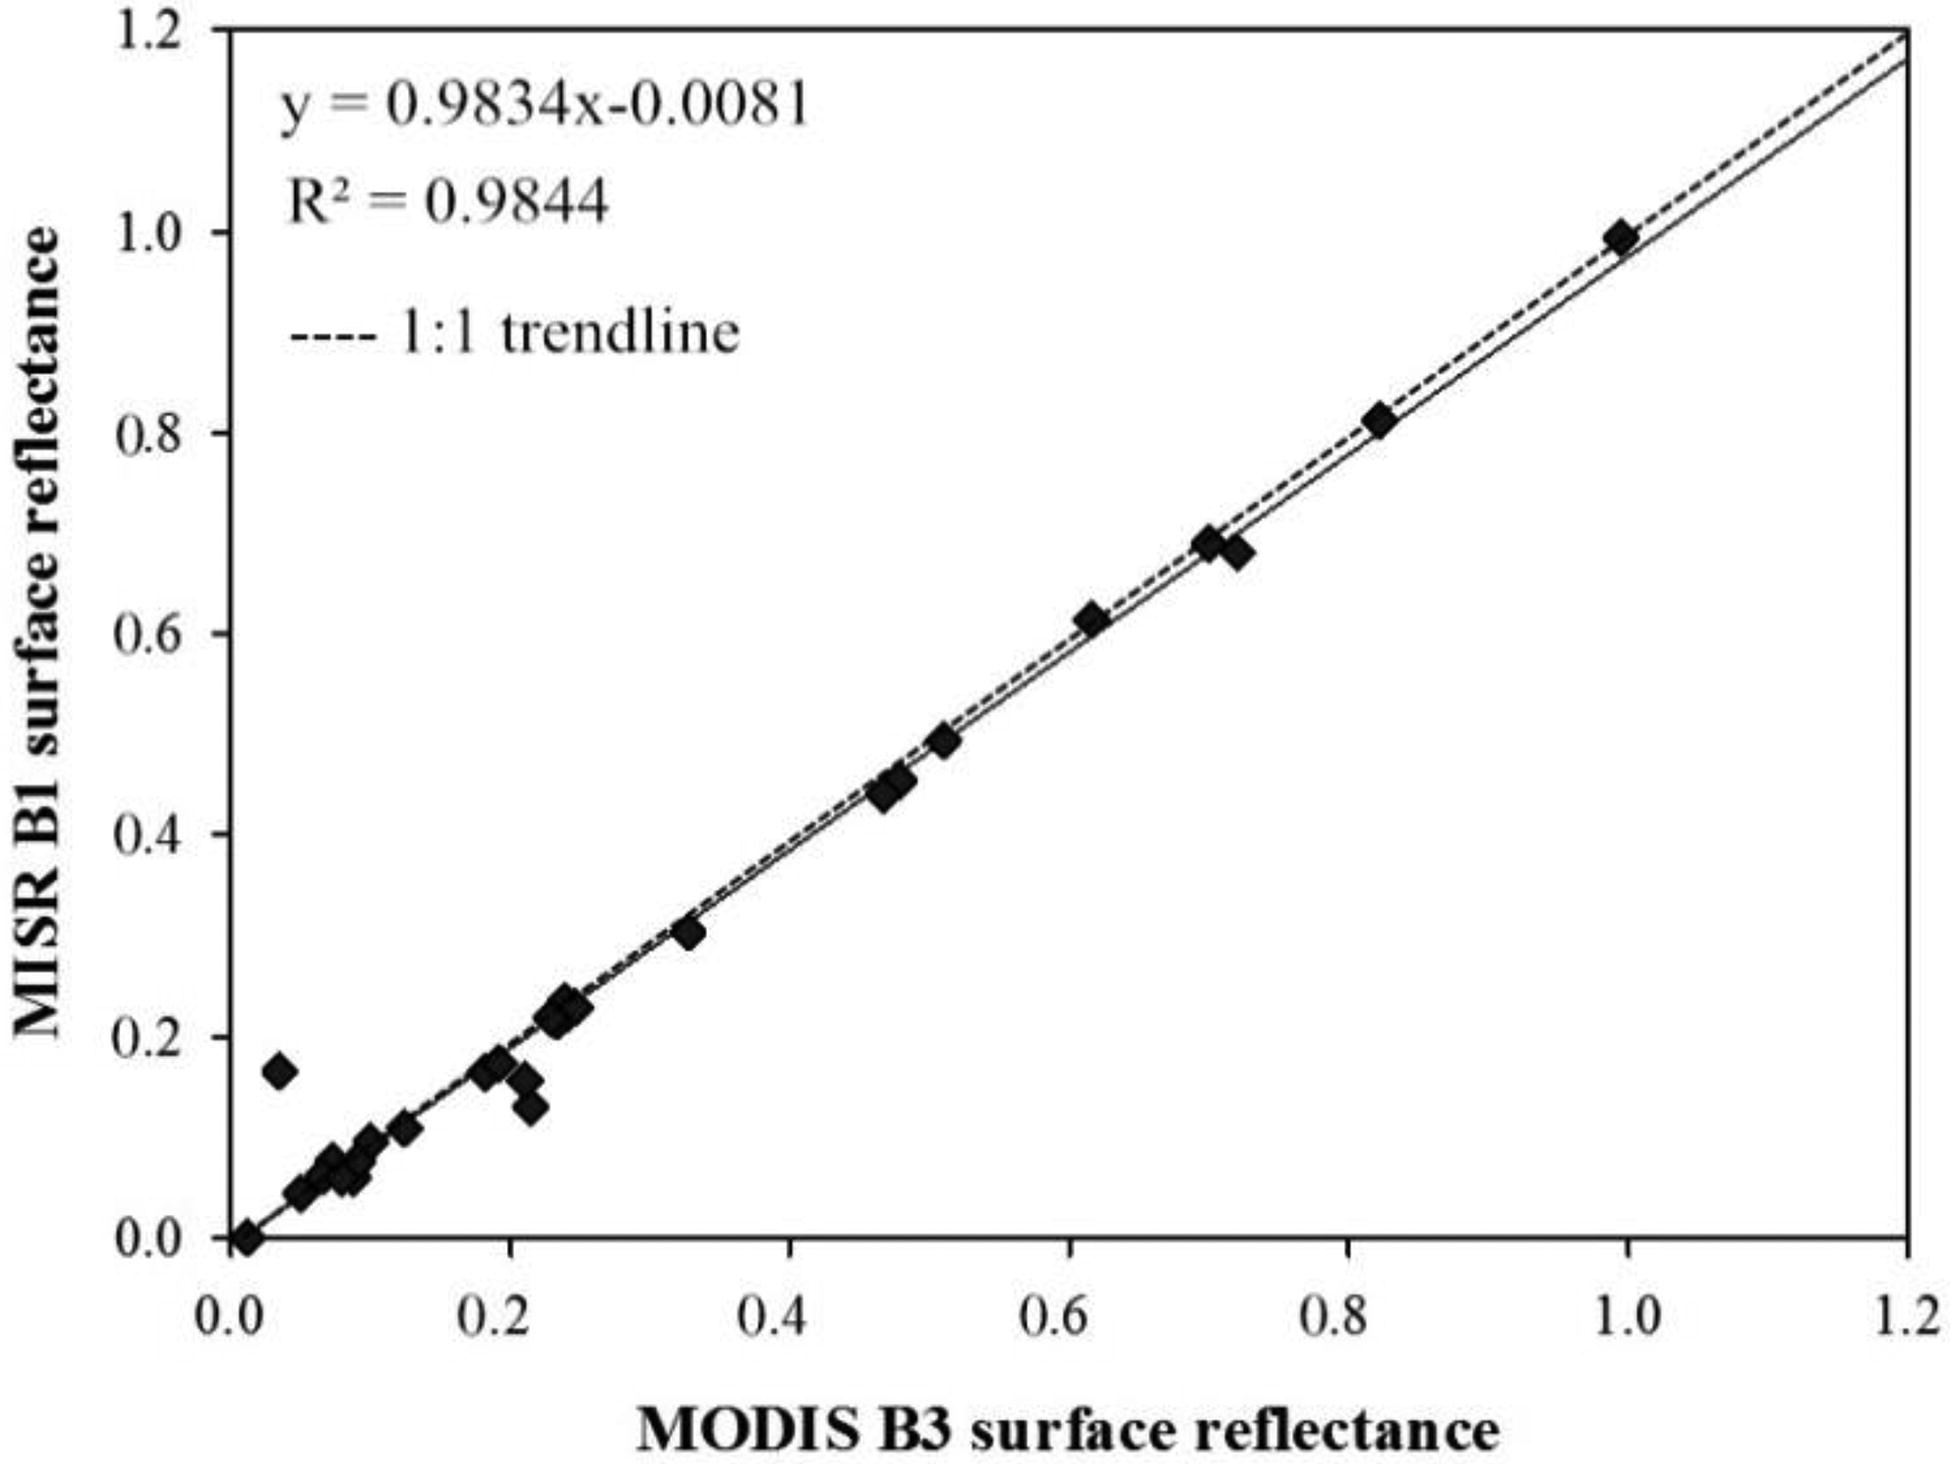
Figure 4.
The linear regression analysis of MODIS and MISR blue band surface reflectance.
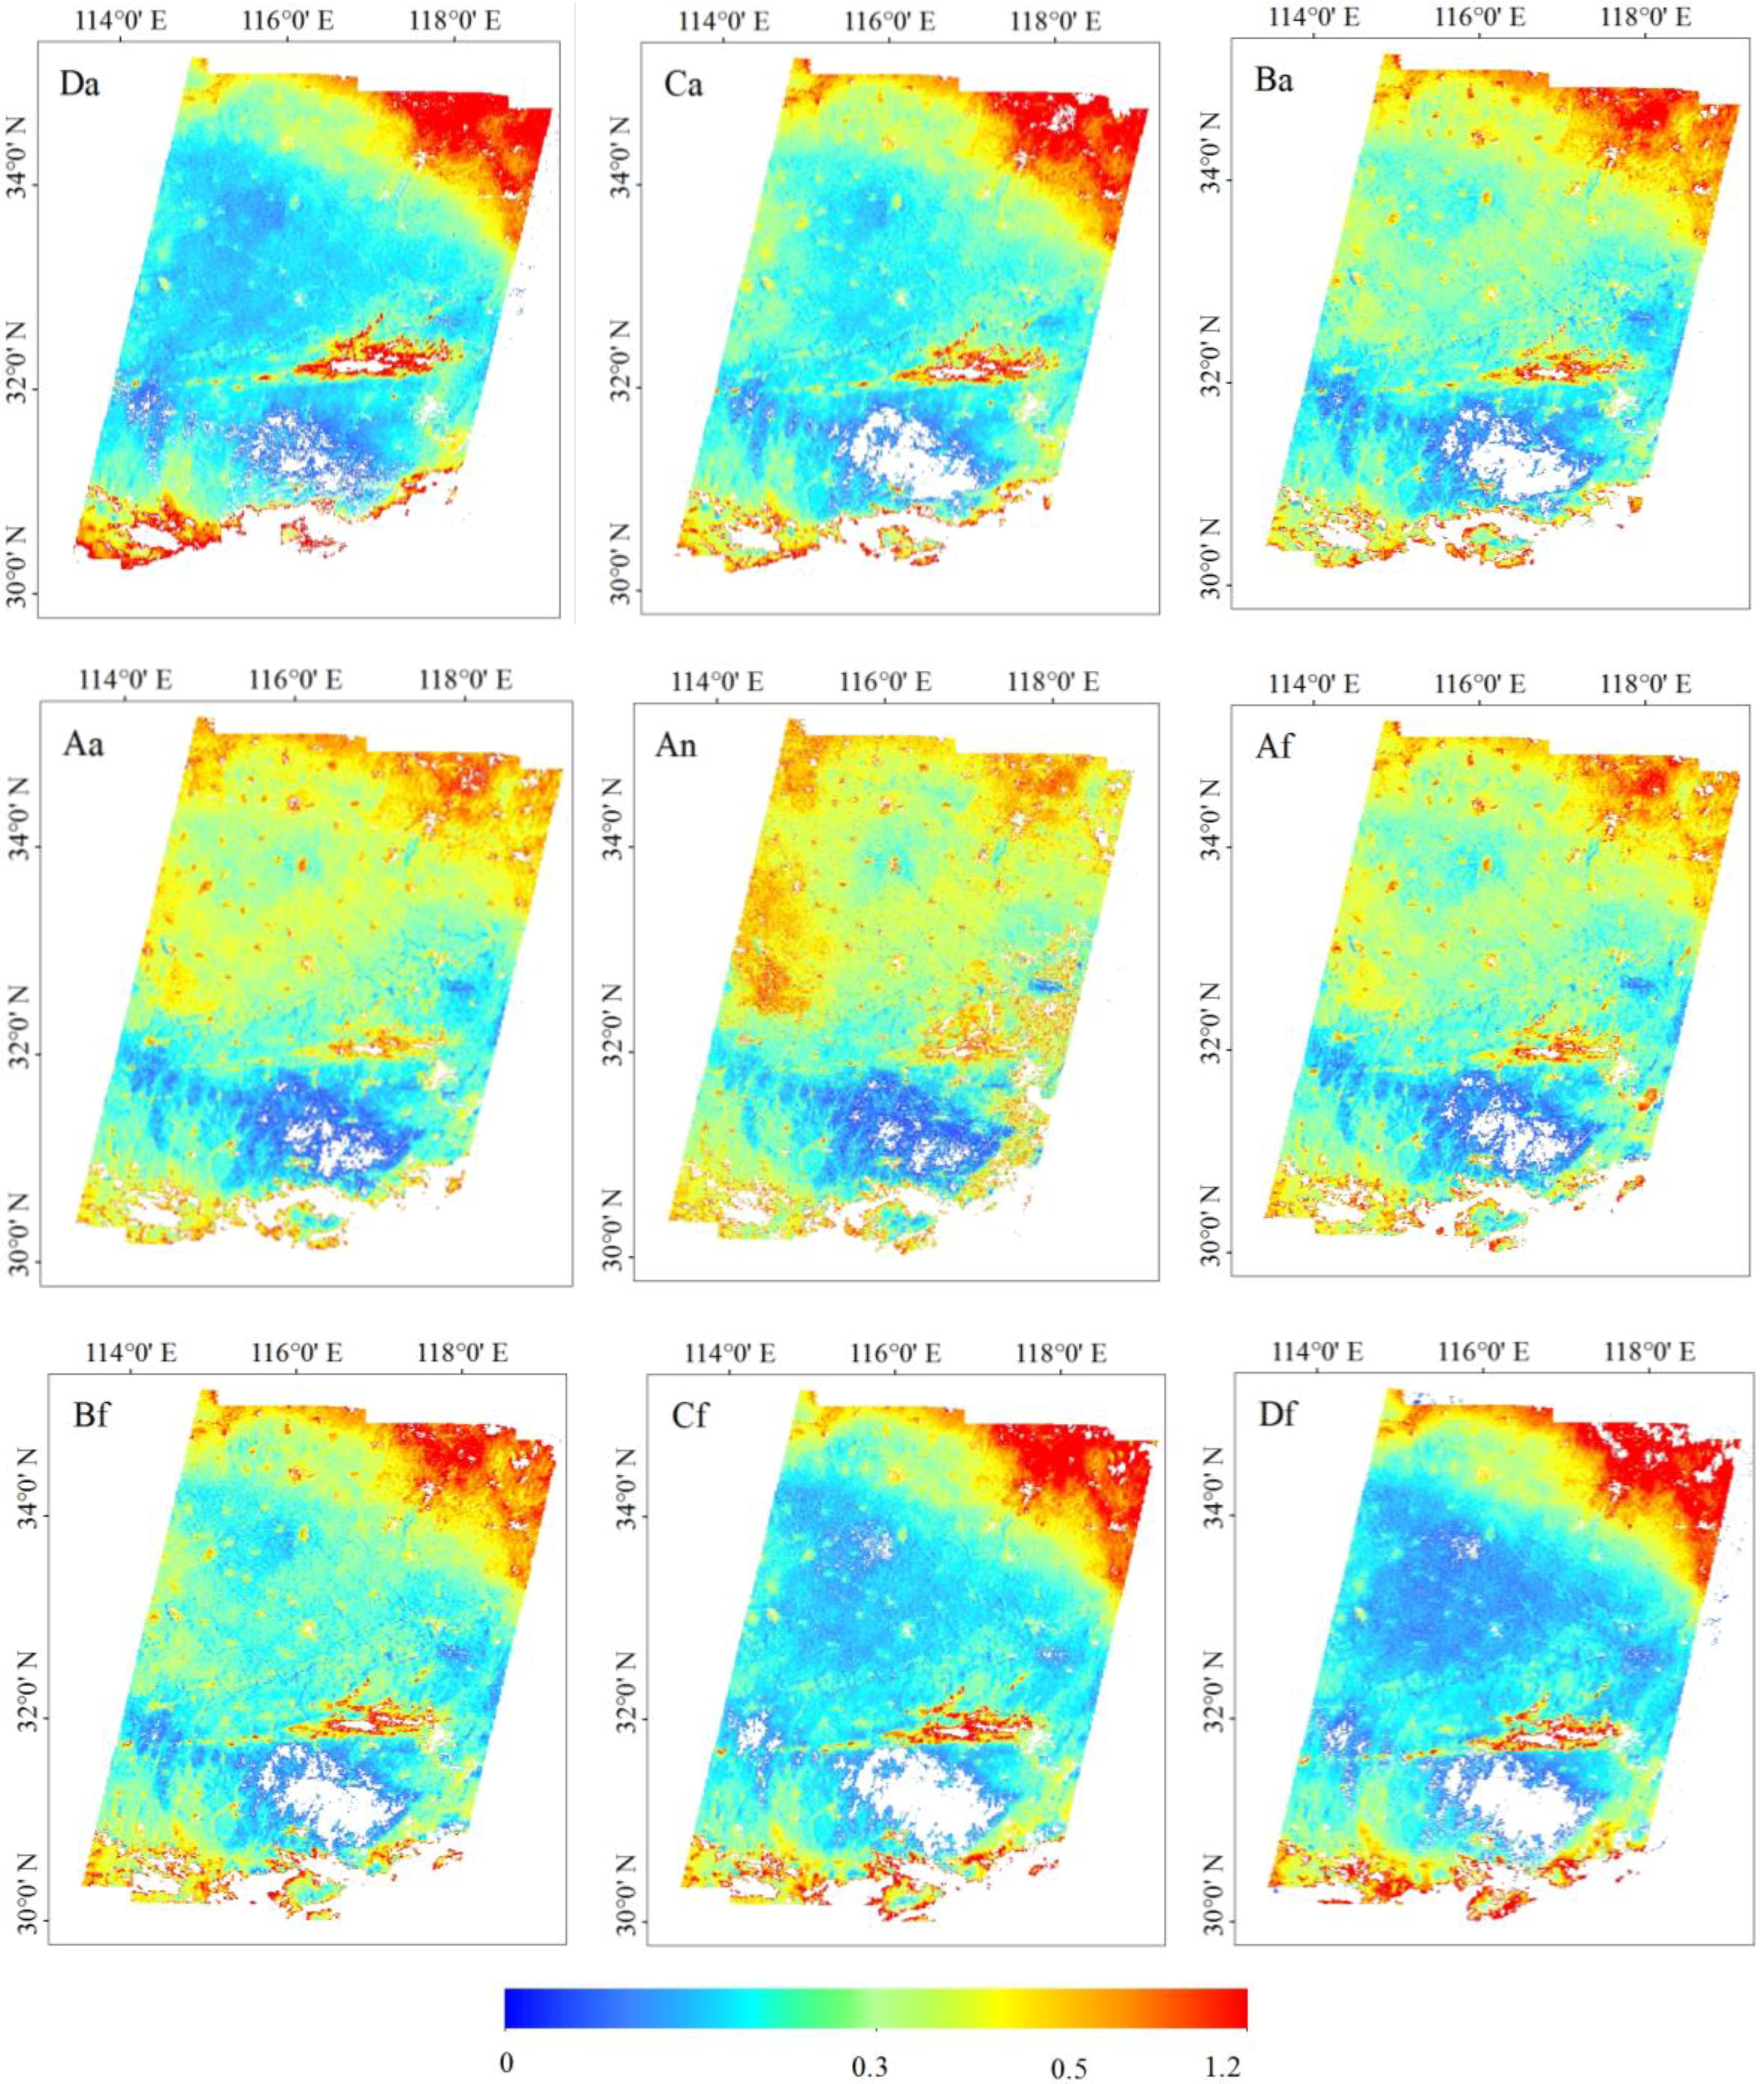
Figure 5.
Retrieved AOD for MISR images (Path: 122, 2018-06-12).
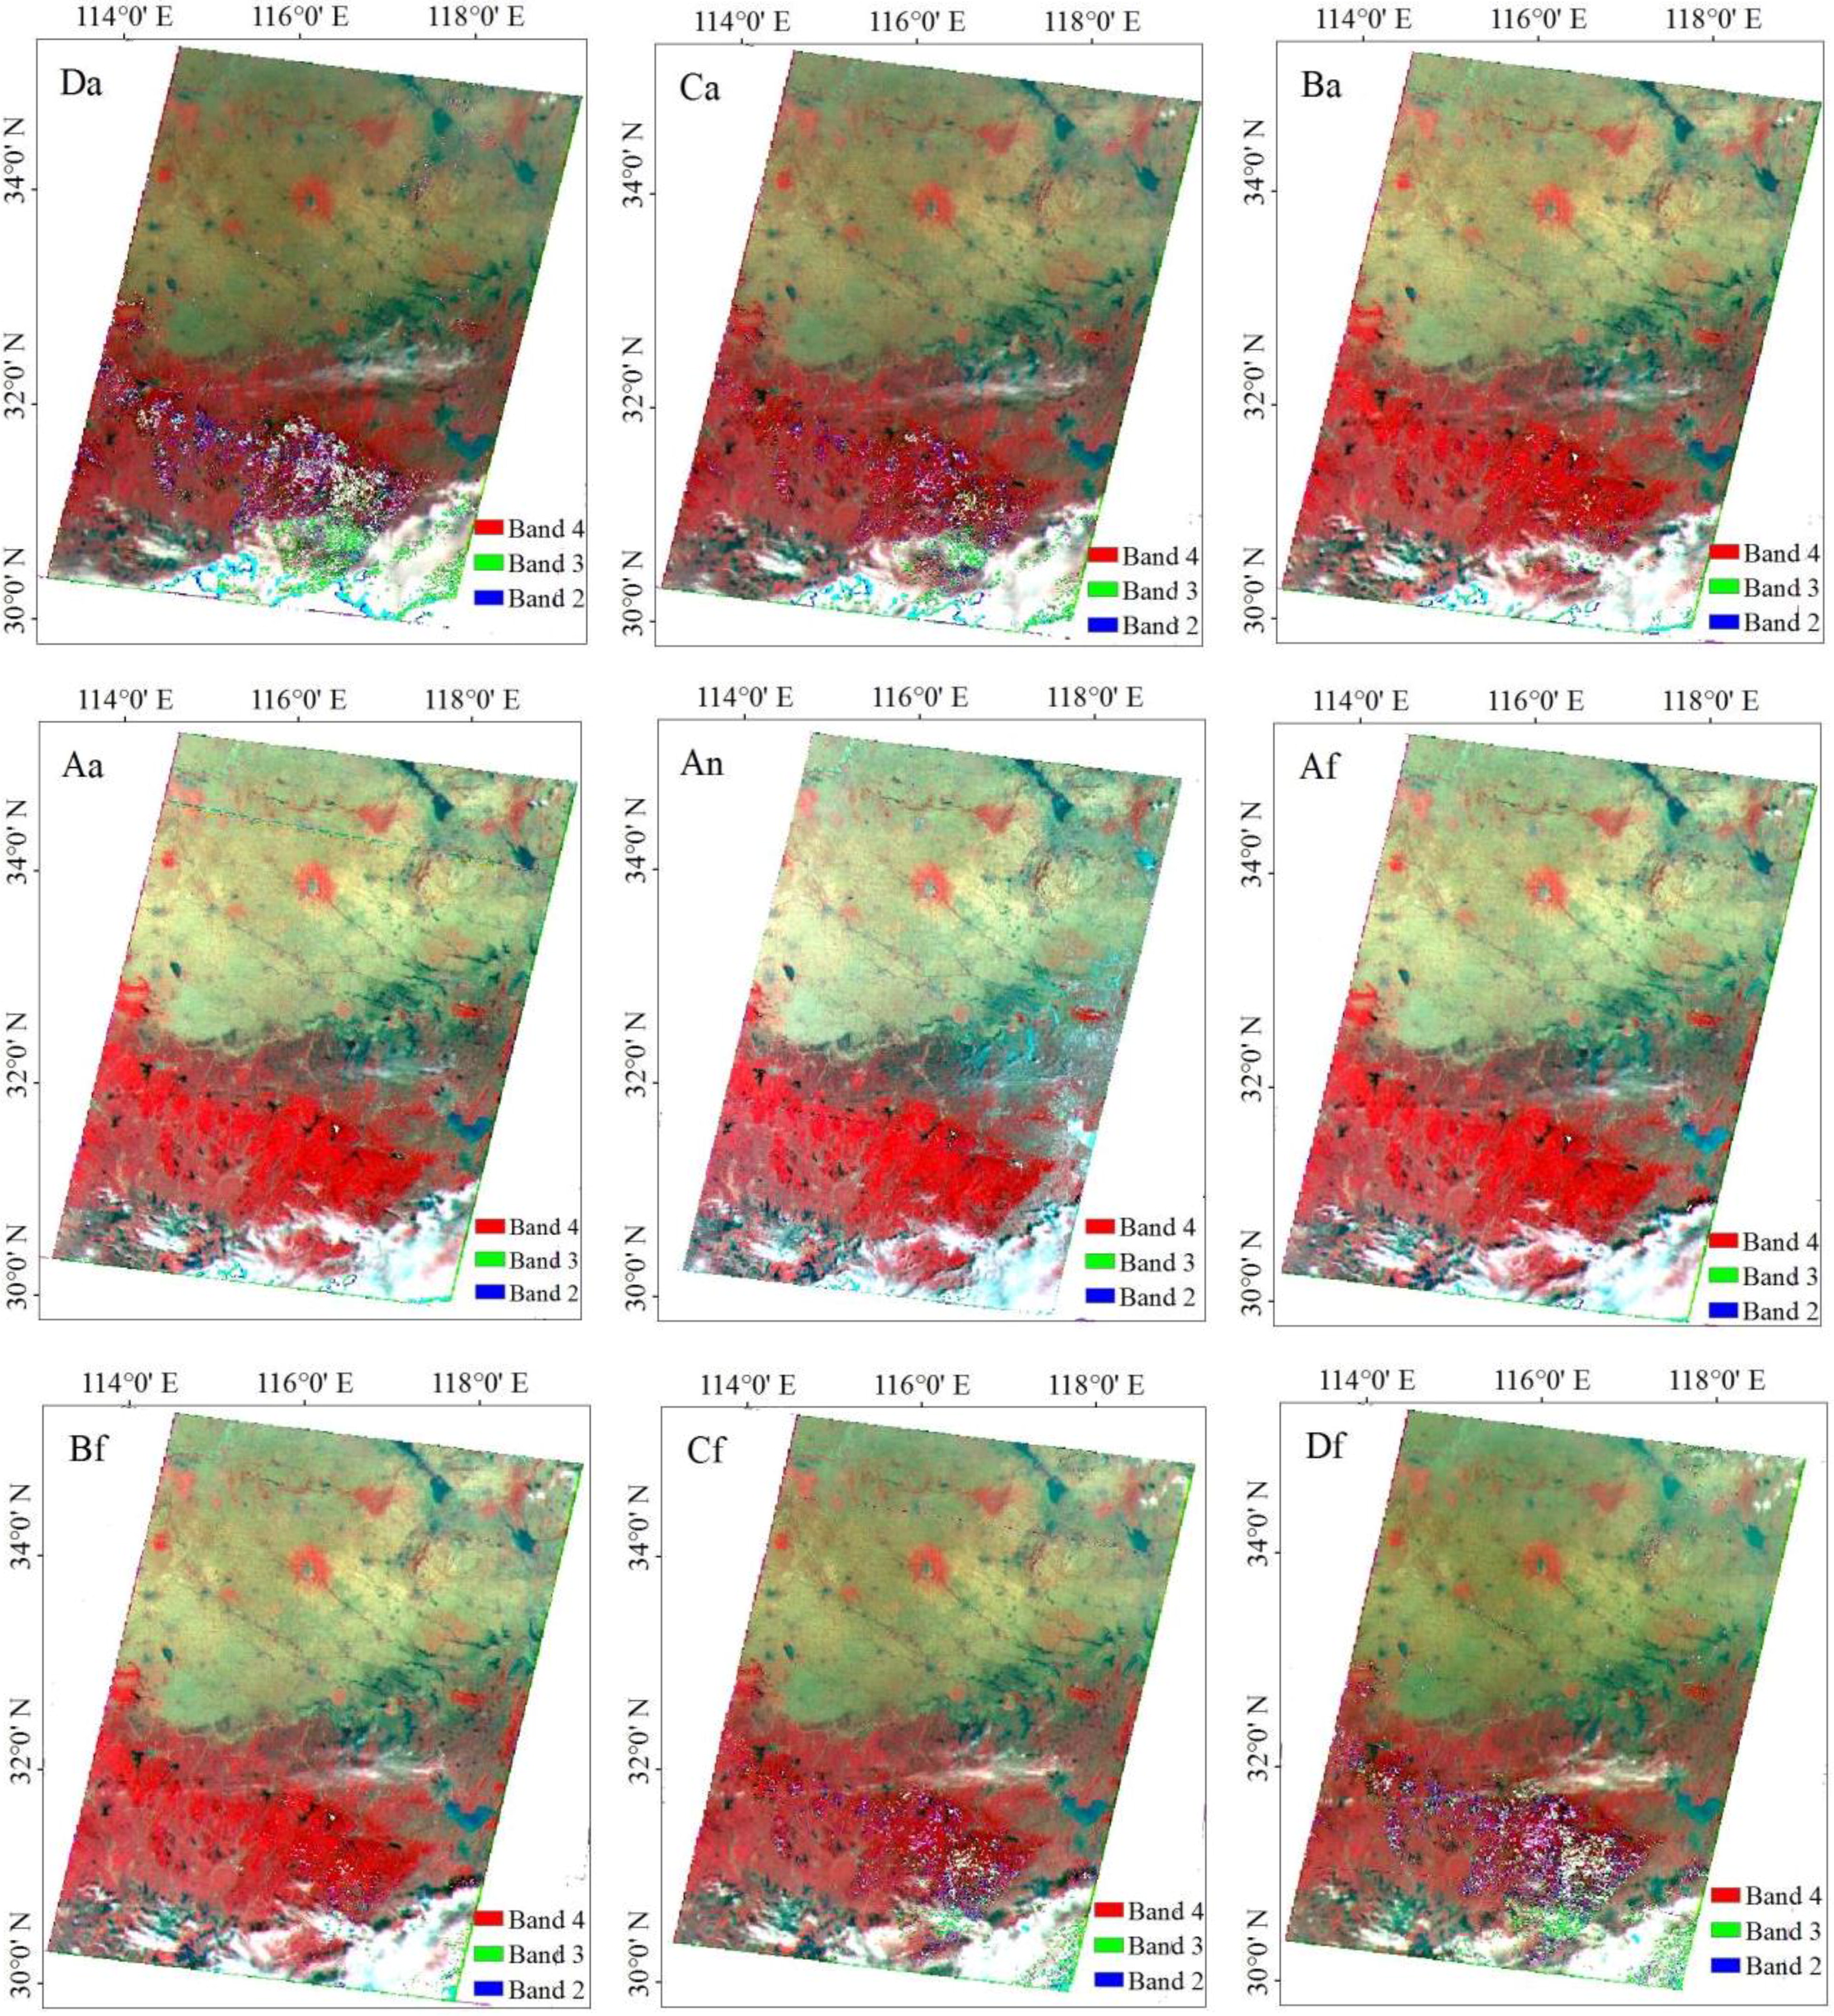
Figure 6.
9-angle false color images of MISR data.
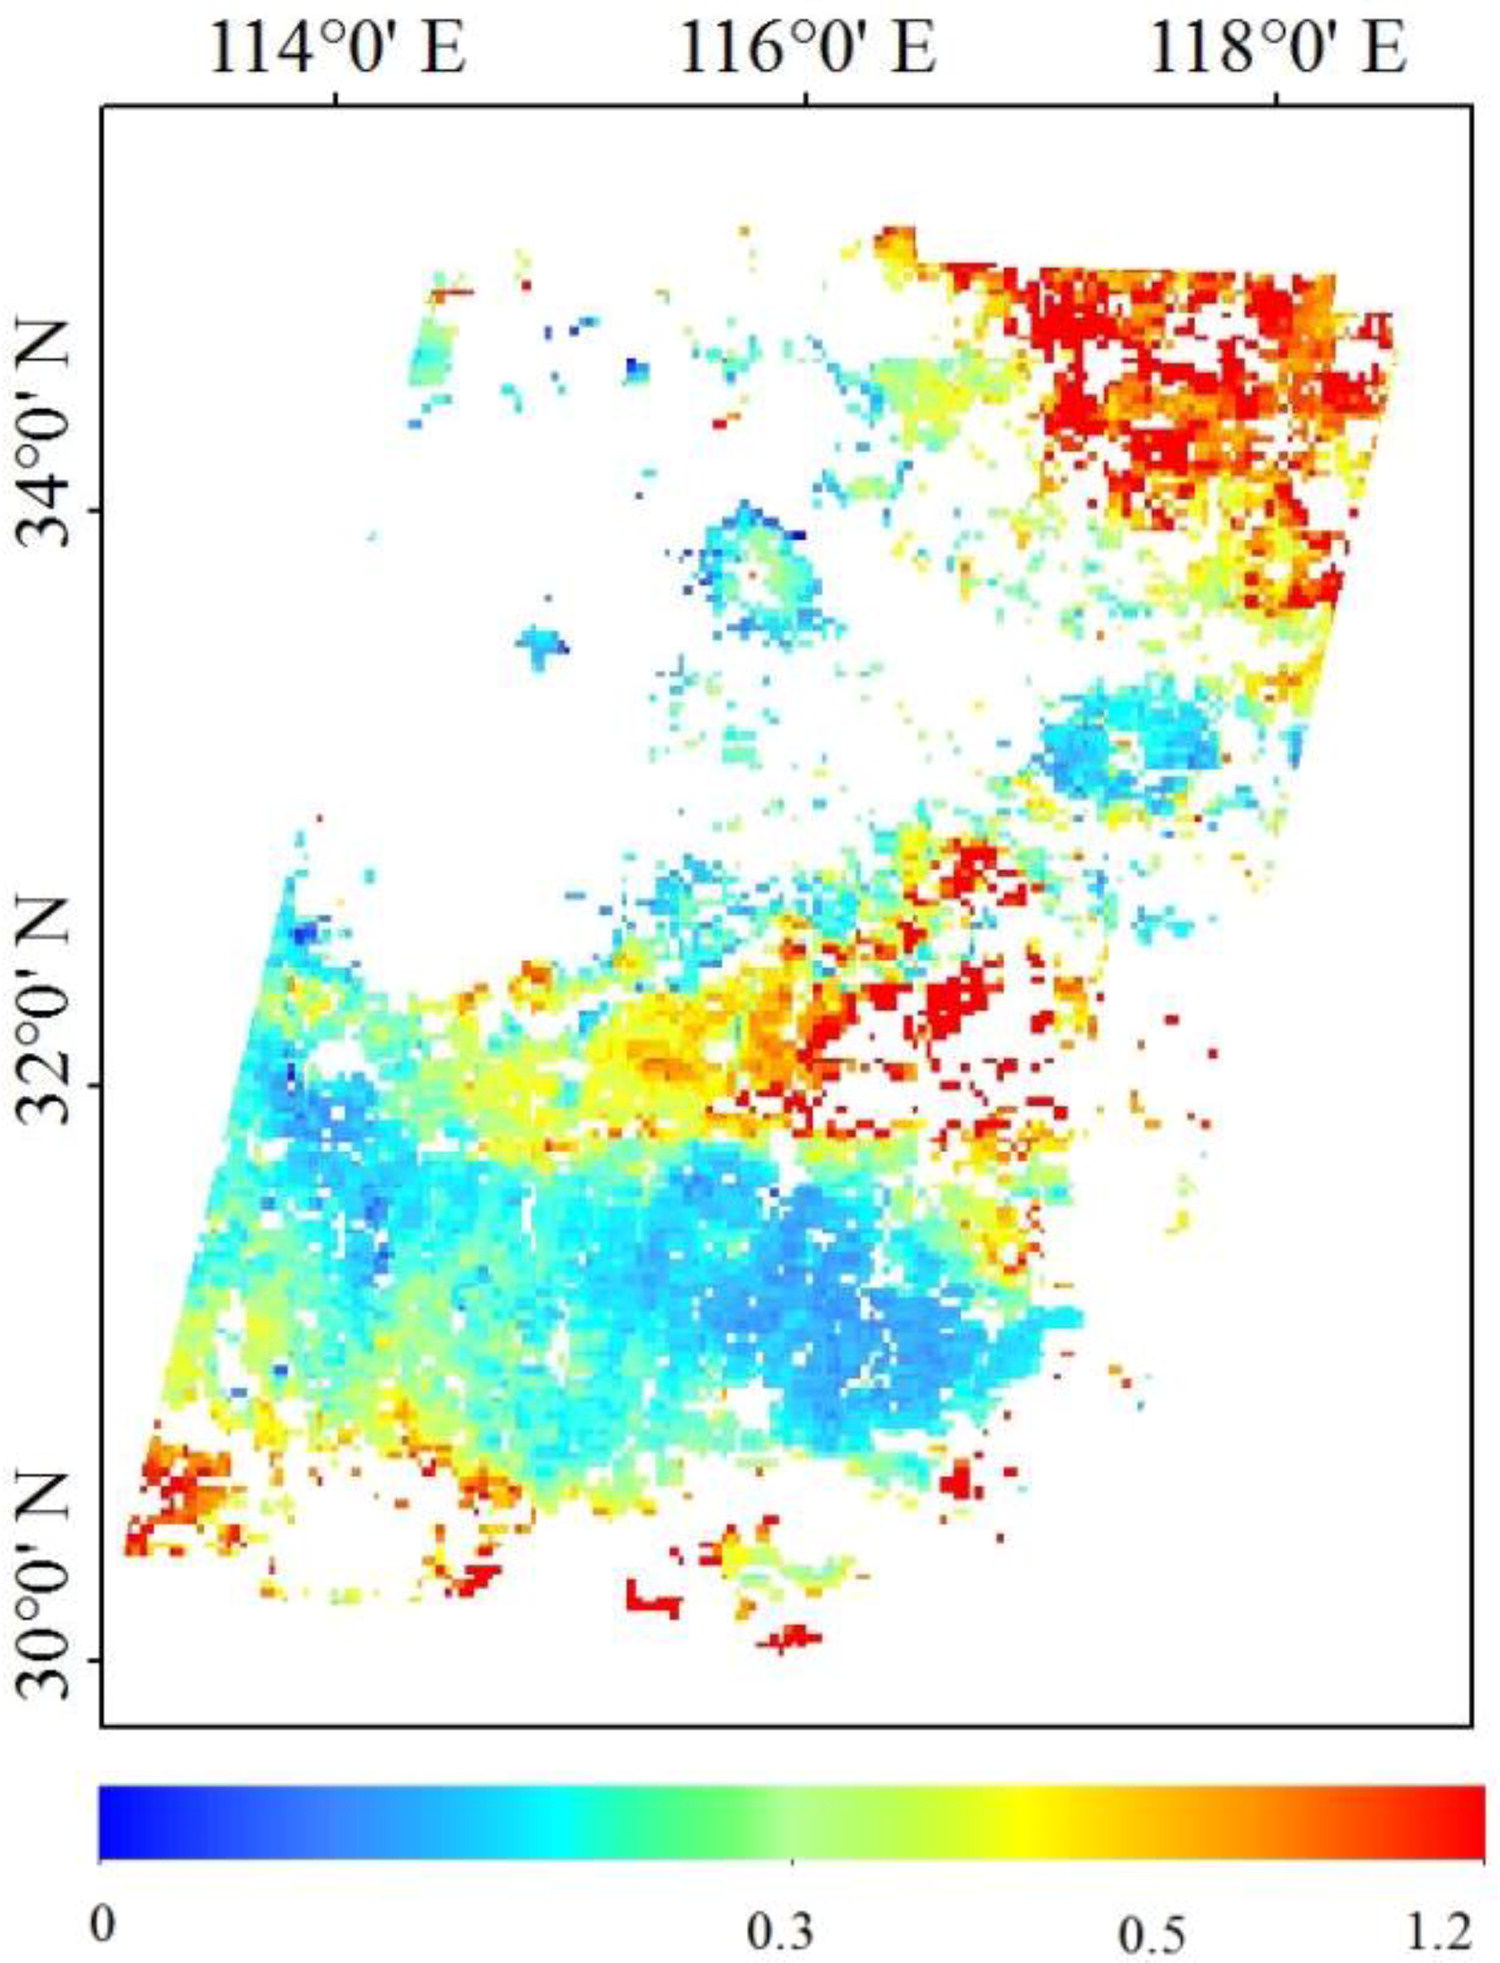
Figure 7.
Retrieval results of MODIS AOD products on June 12, 2018.
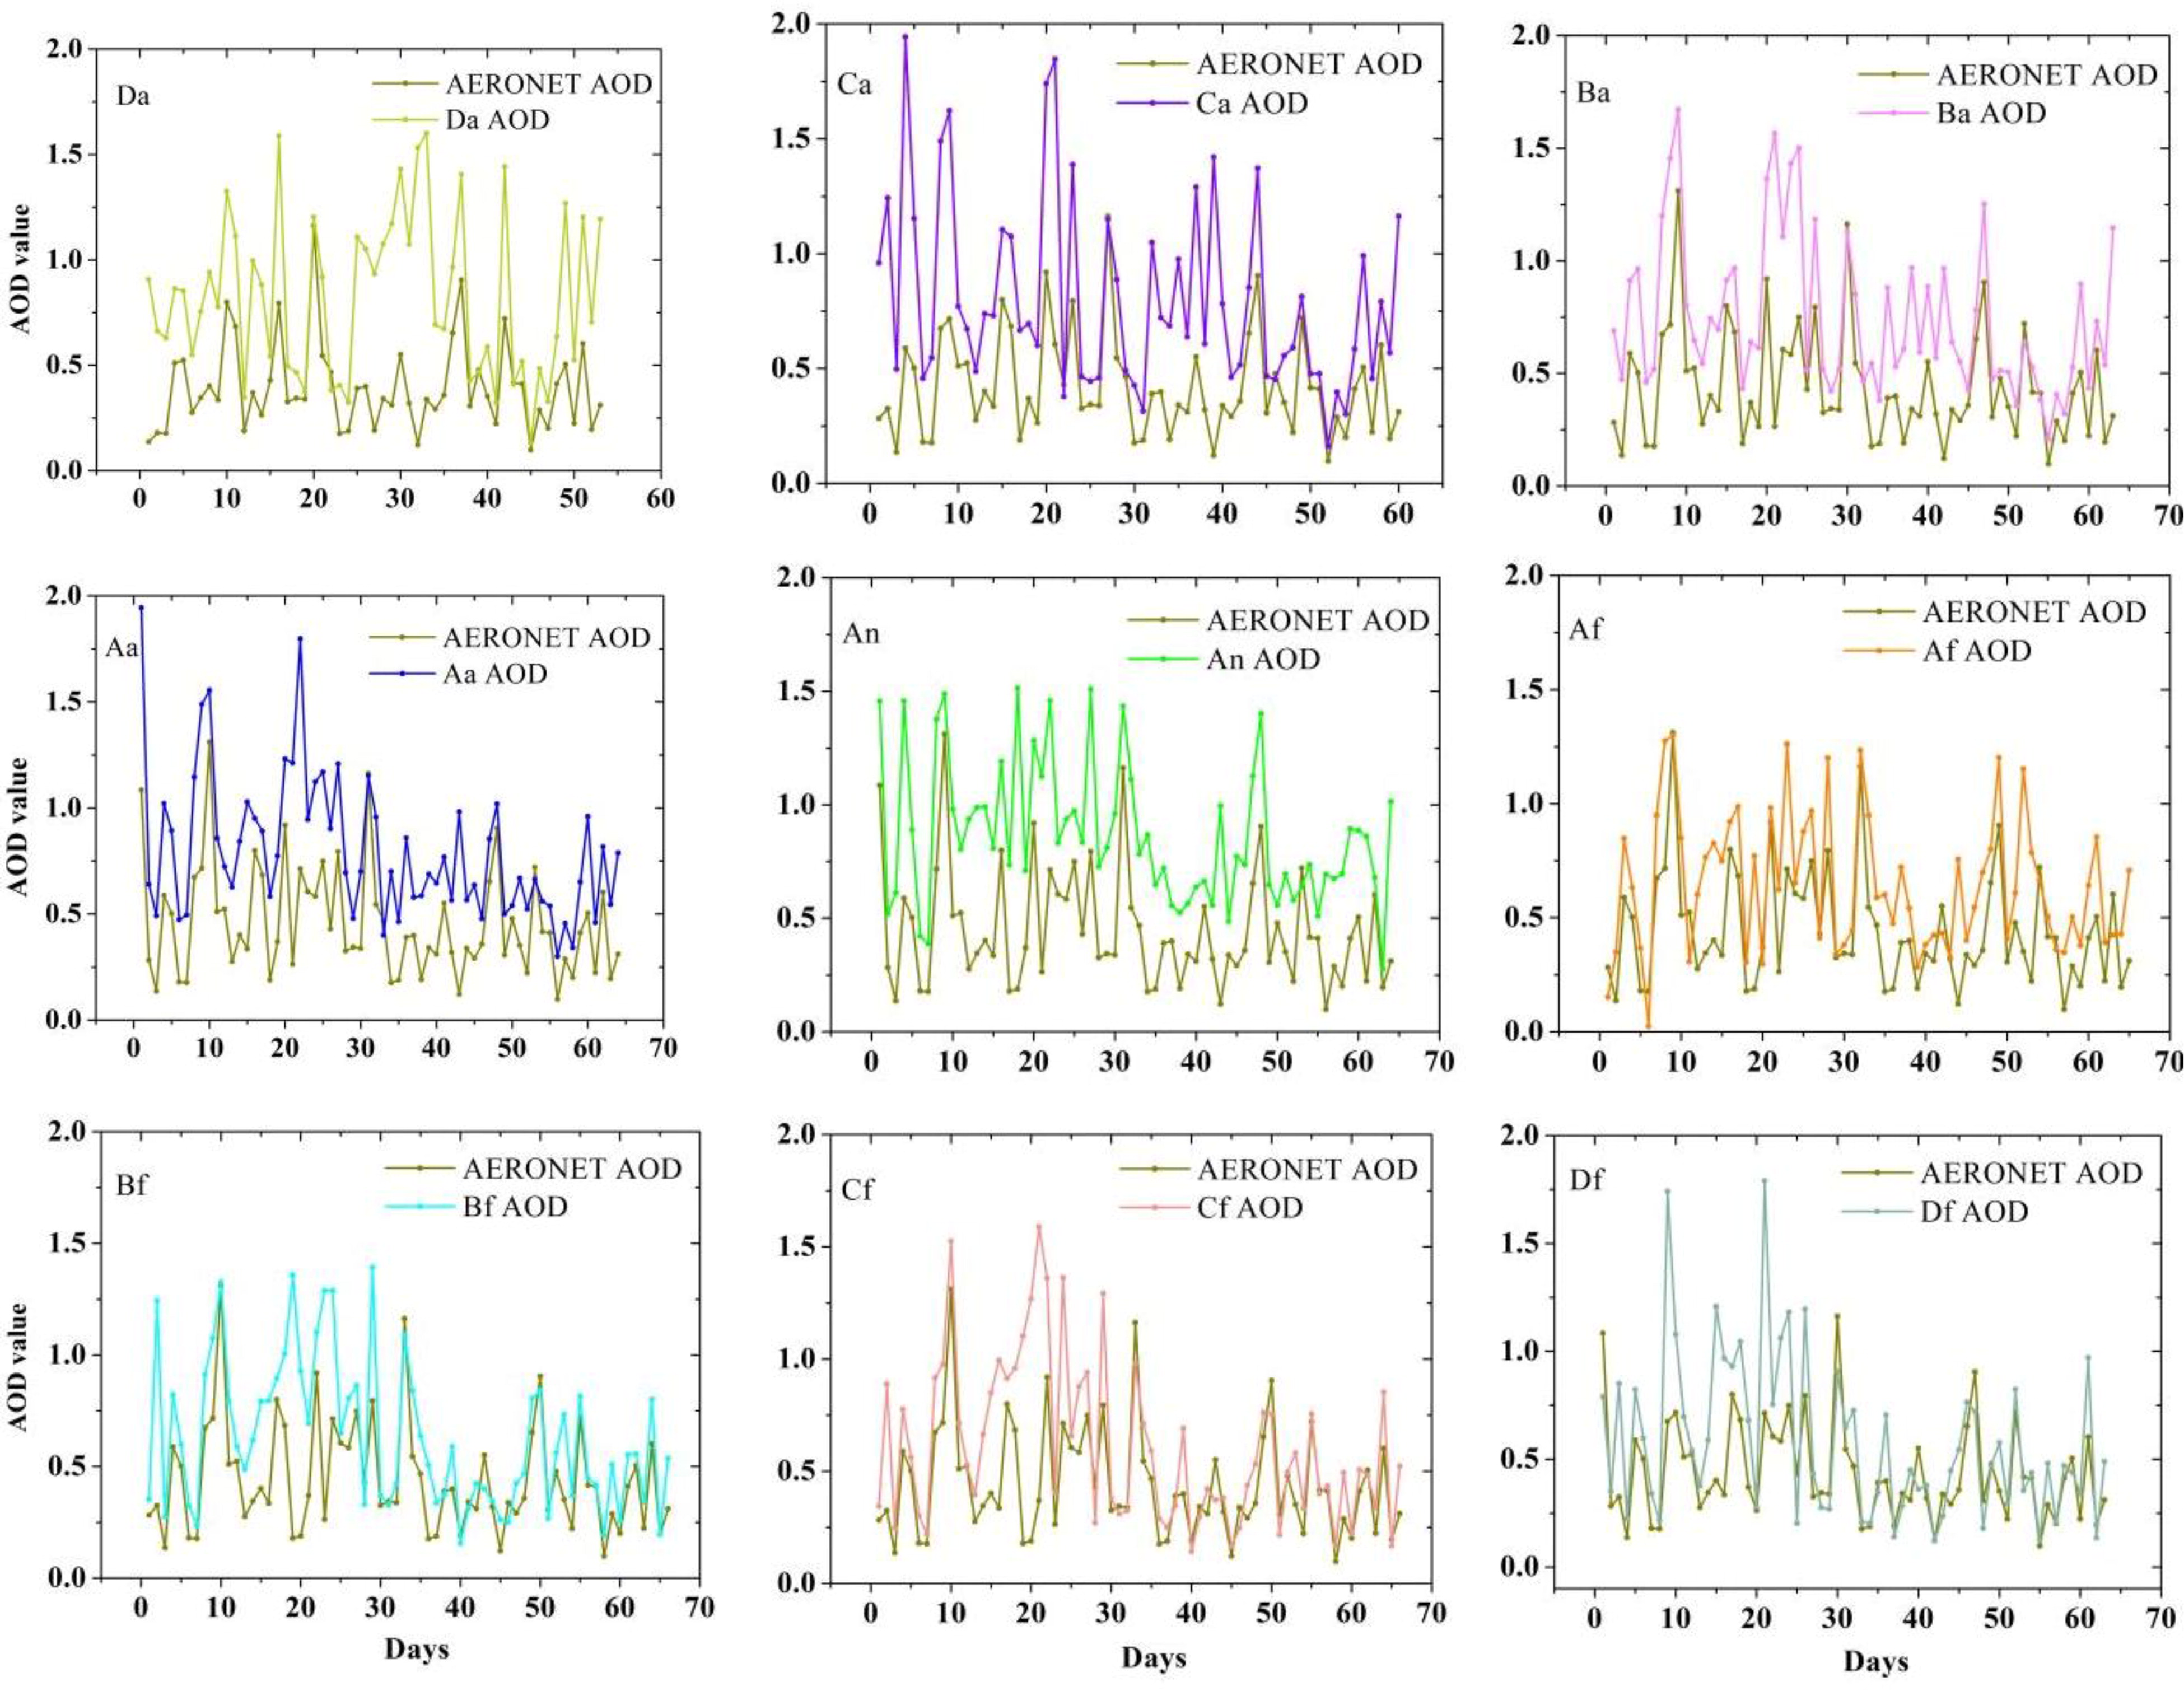
Figure 8.
AOD time series type plot of 9 angles.
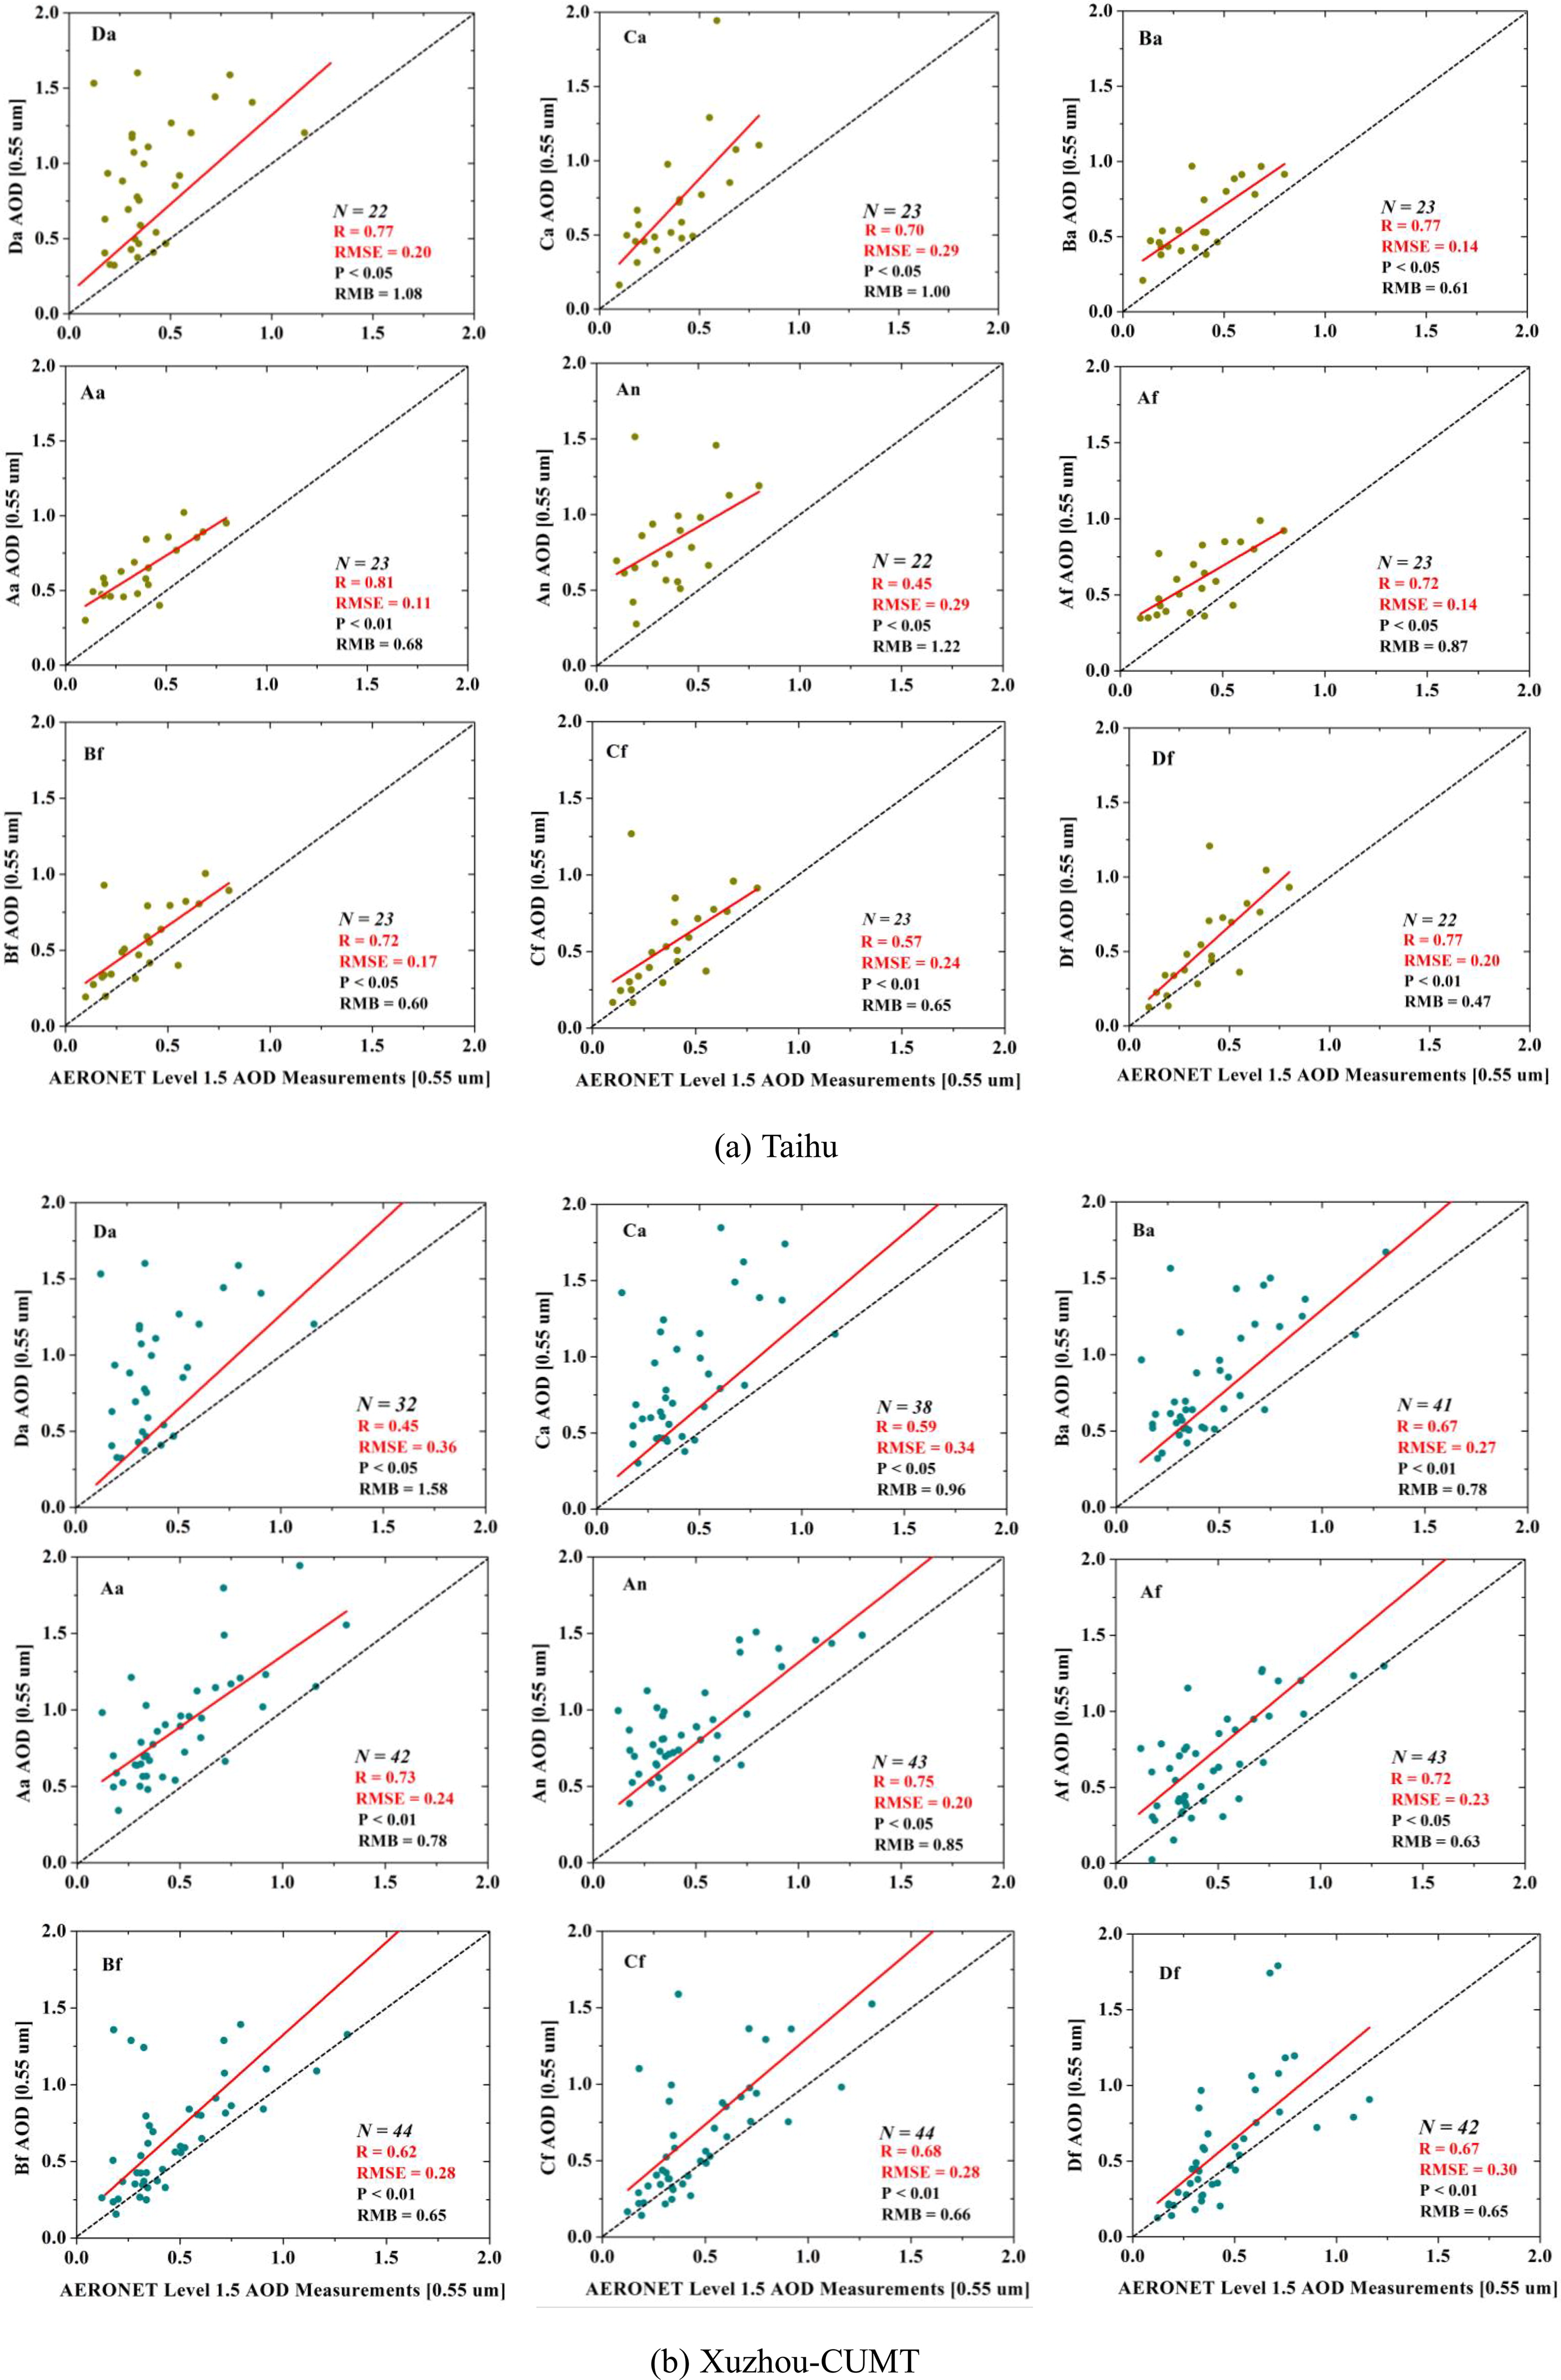
Figure 9.
Comparison of the MISR AOD retrieval and the AERONET observations (N is the number of verification points).
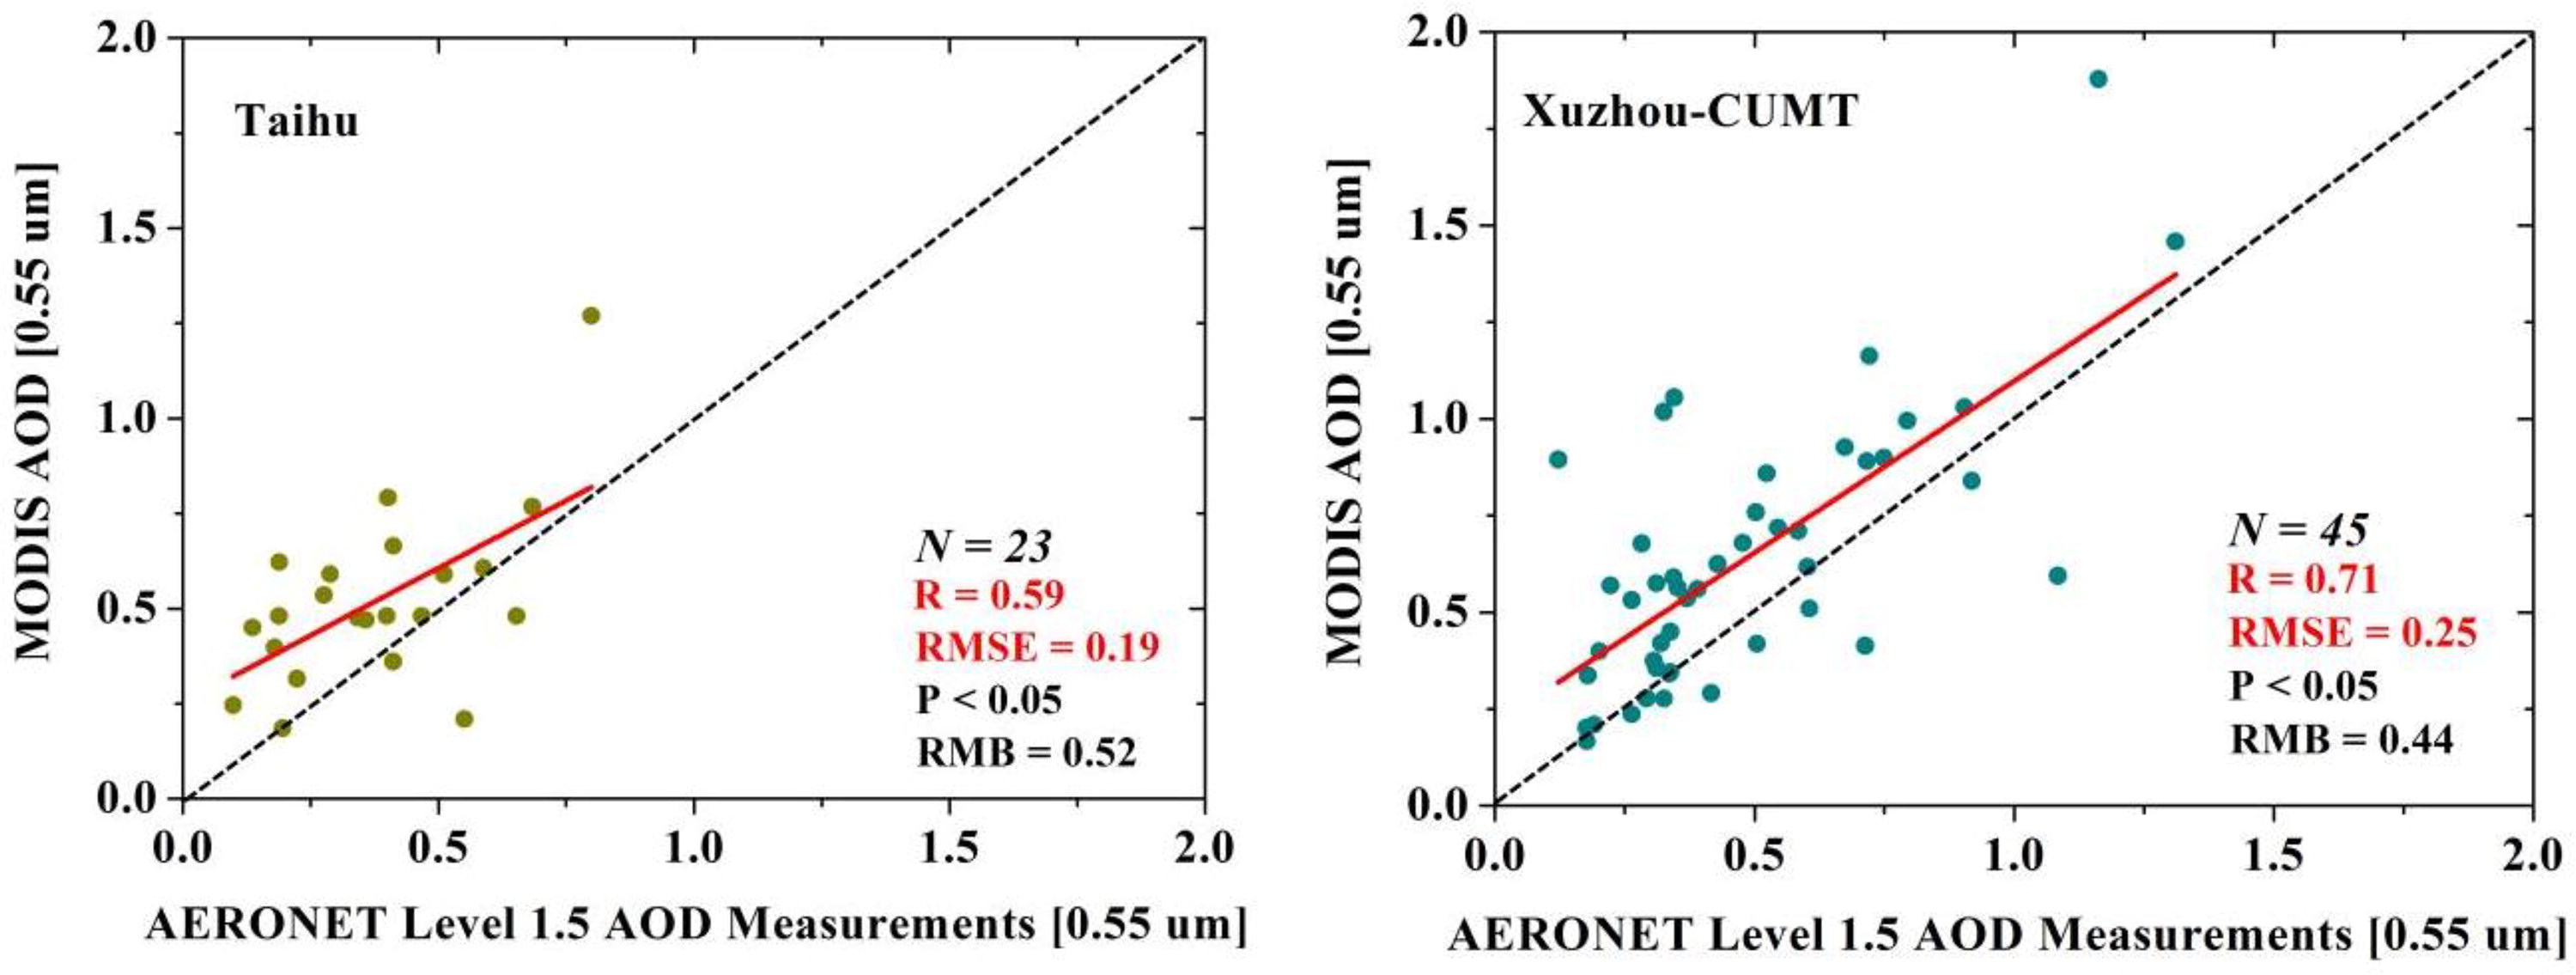
Figure 10.
MODIS AOD 550nm validation results for corresponding collocations.
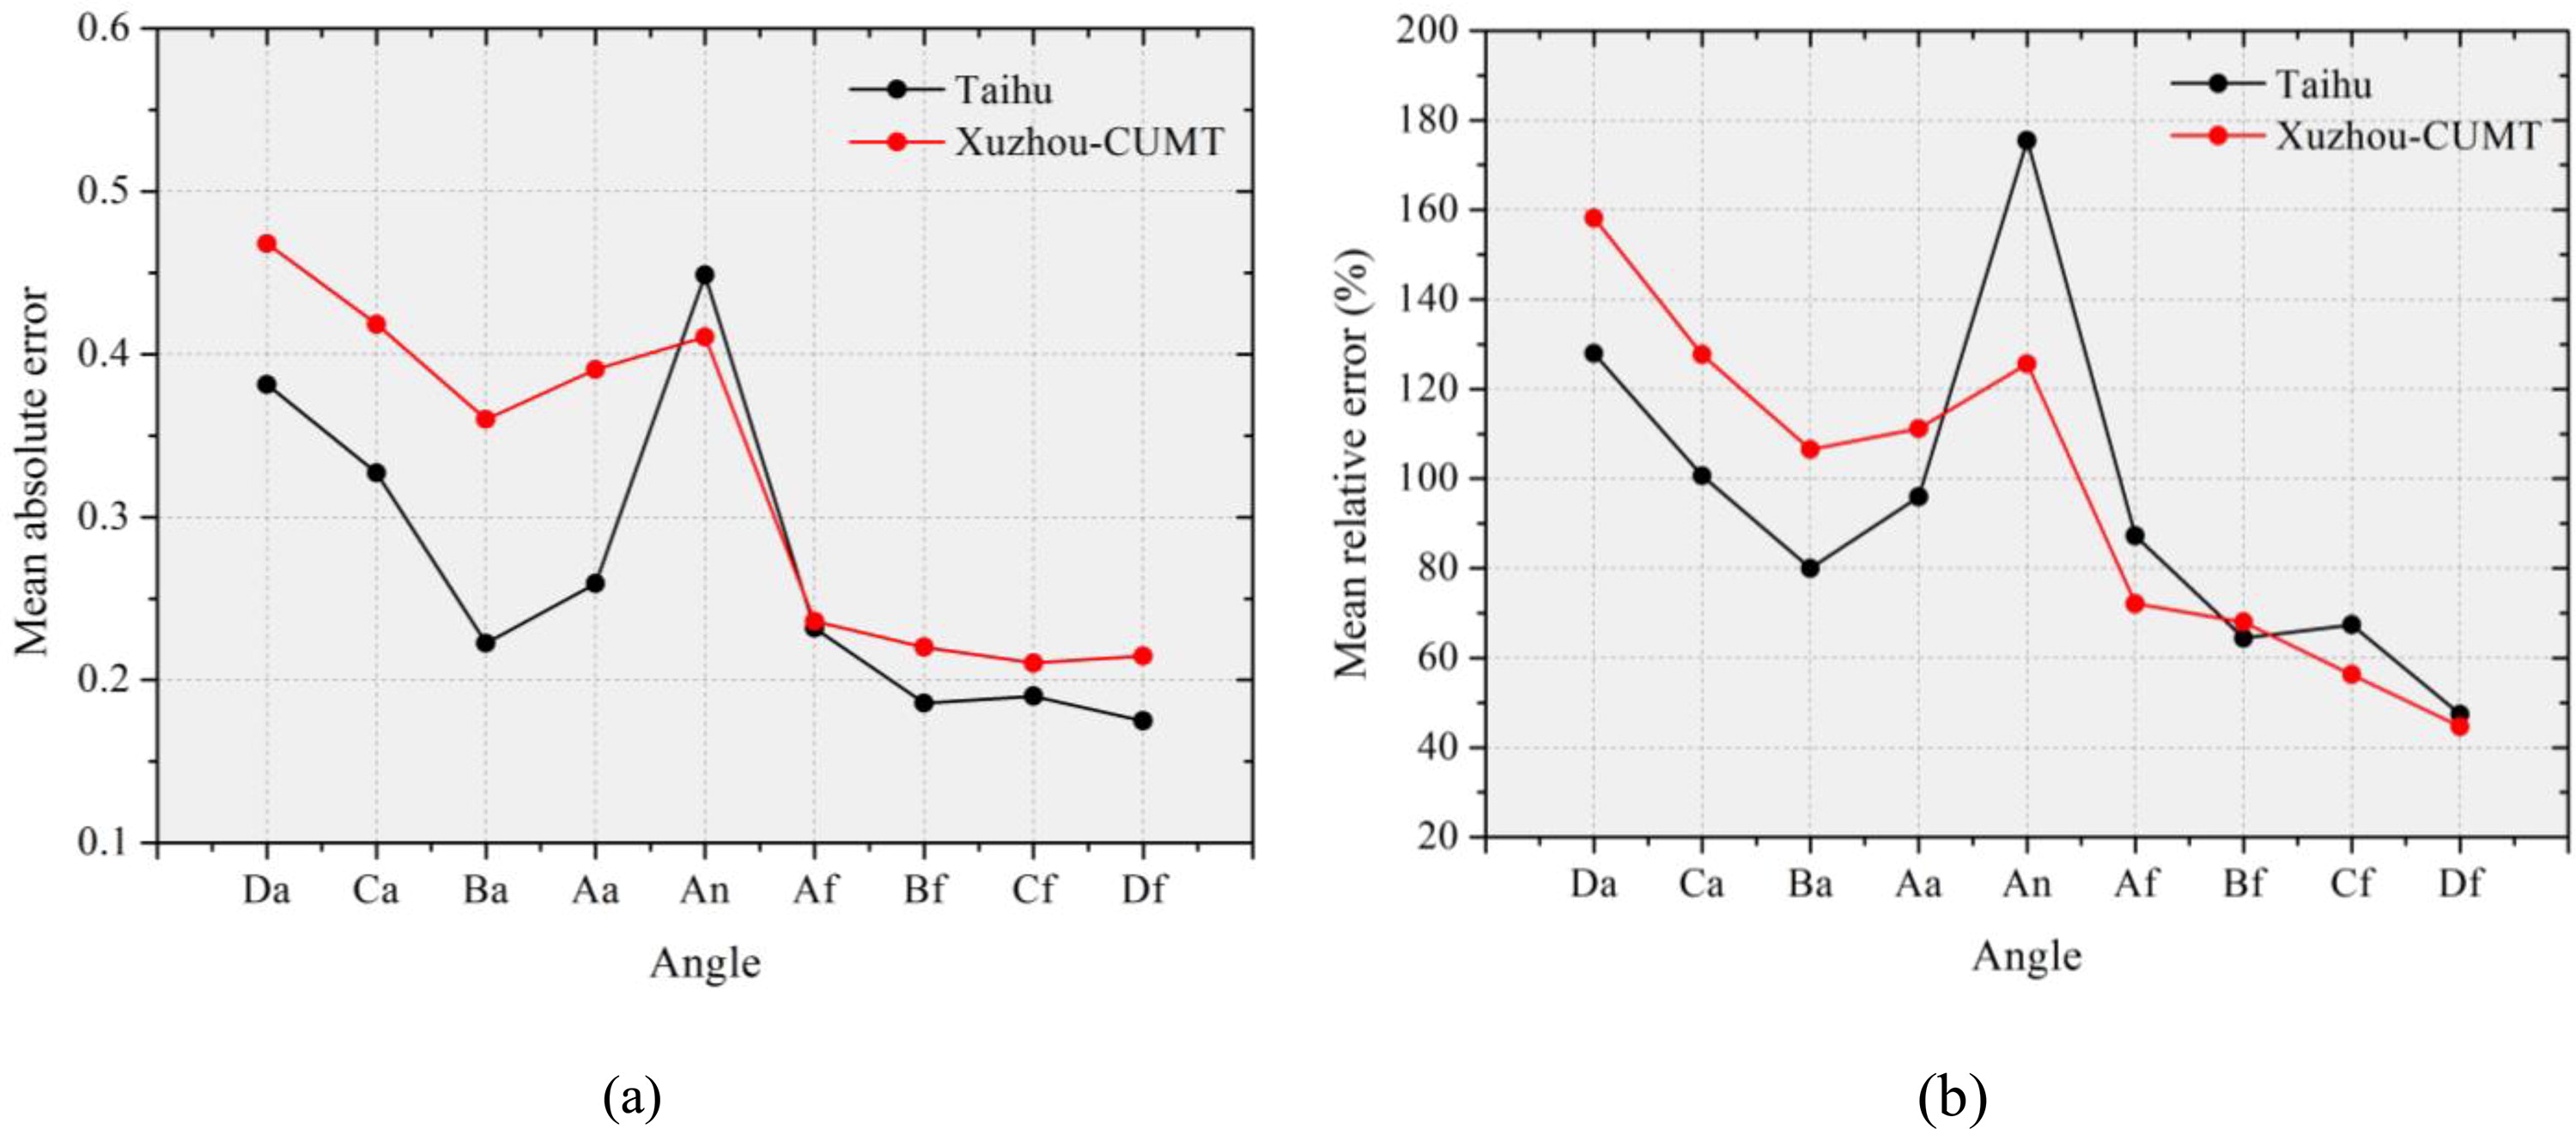
Figure 11.
Mean absolute error and mean relative error of the nine angles.
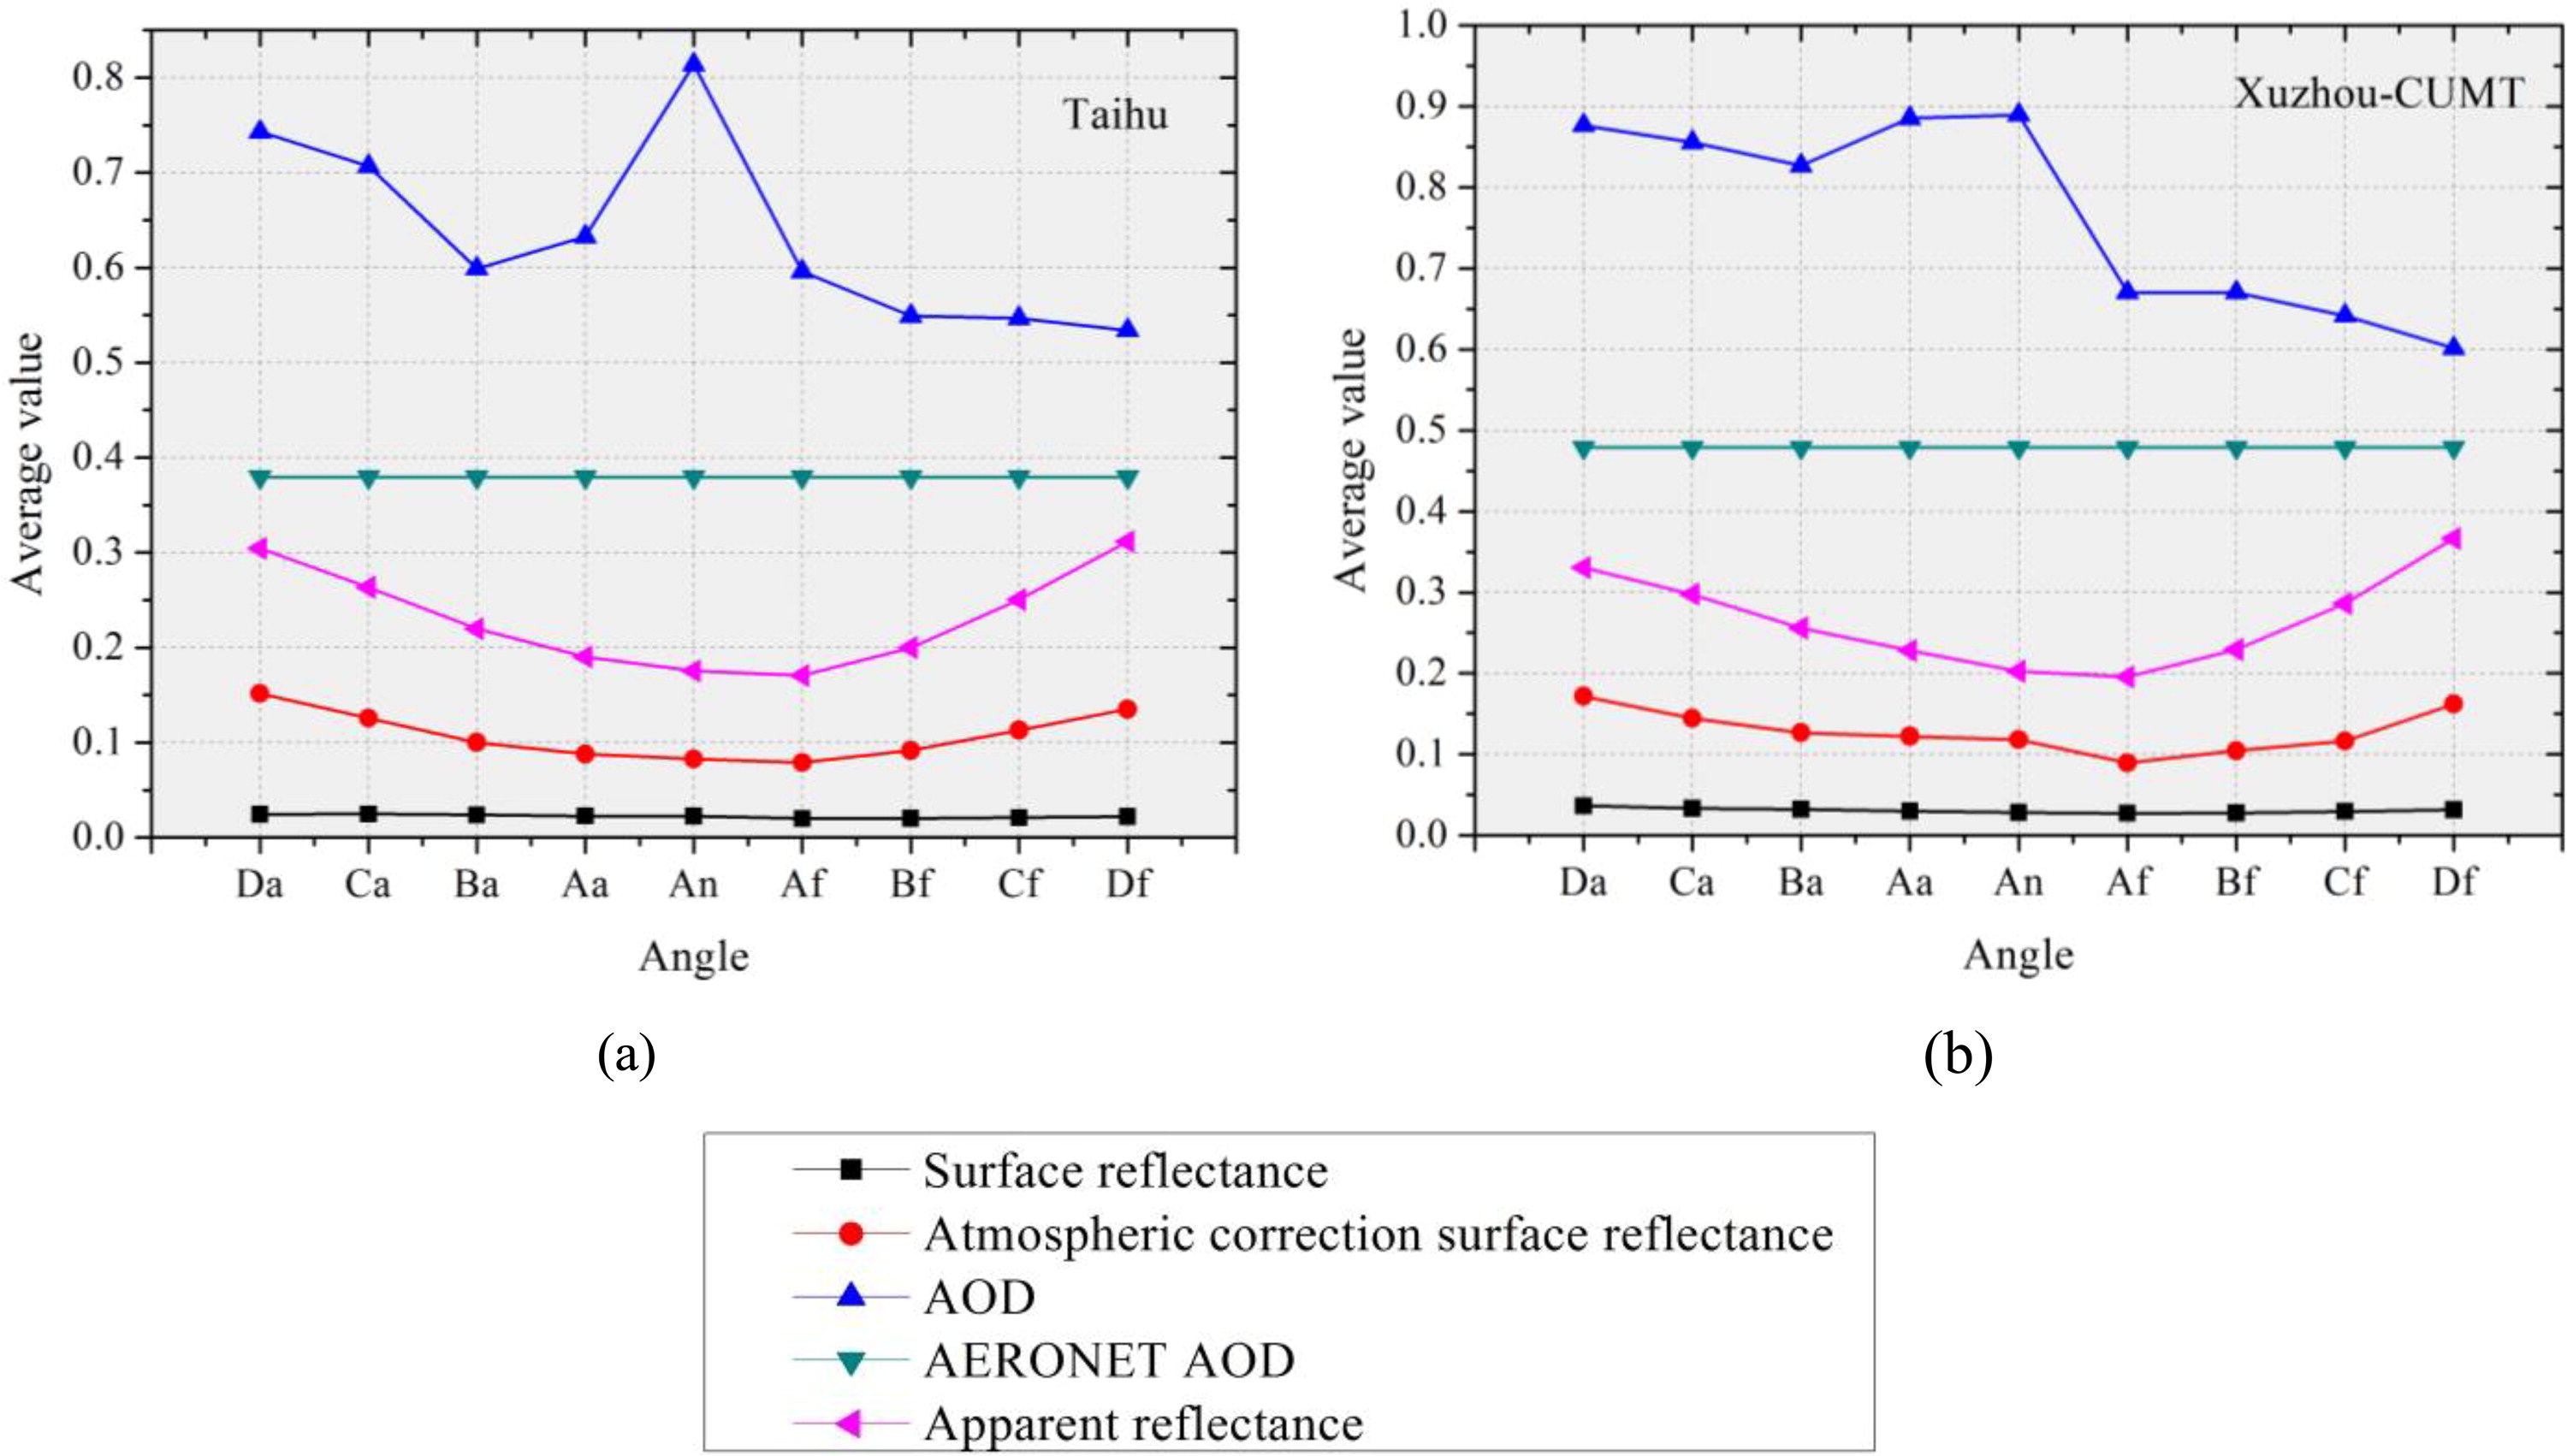
Figure 12.
The influence of geometric conditions on AOD. The Y-axis is the average of all (Surface reflectance, atmospheric correction surface reflectance, AOD, AERONET AOD and apparent reflectance) values that match the location of the site at 9 angles from 2016 to 2018.
Table 2.
The difference between the MISR surface reflectance and reflectance with atmospheric correction and the deviations of MISR AOD and AERONET AOD at different angles.
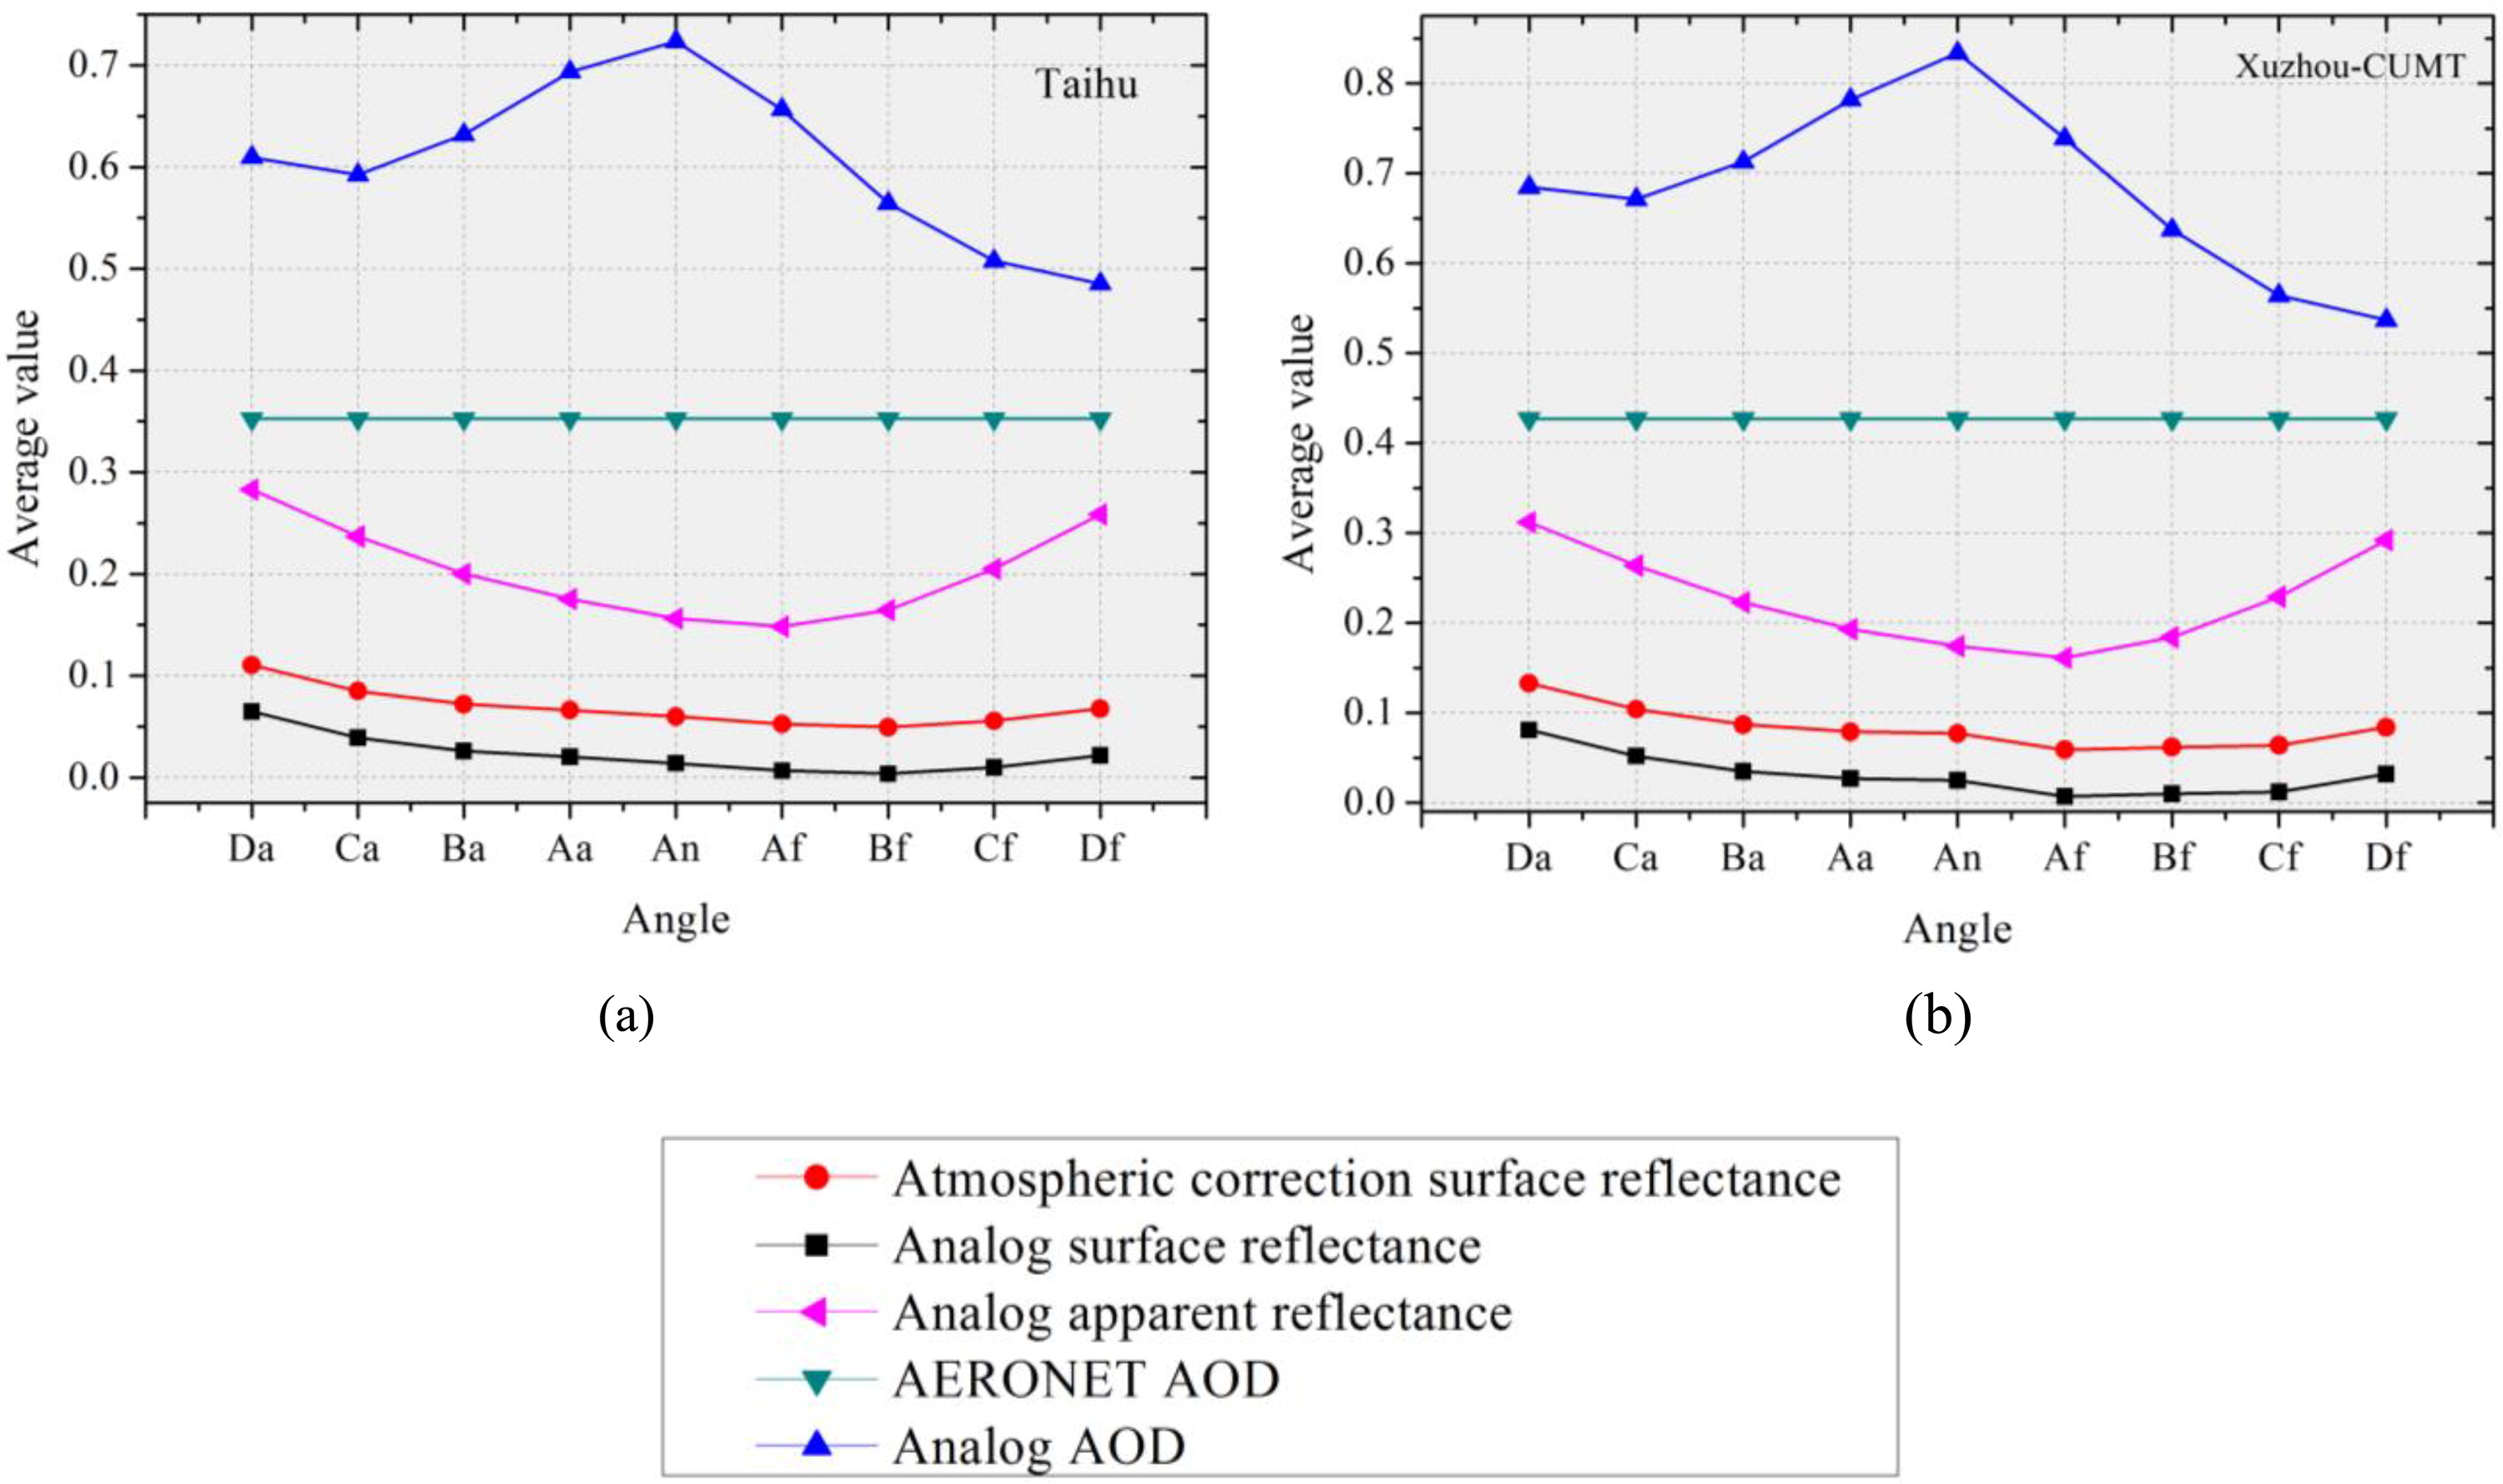
Figure 13.
The influence of Angle on AOD retrieval. The Y-axis is the average of all (Atmospheric correction surface reflectance, analog surface reflectance, analog apparent reflectance, AERONET AOD and analog AOD) values that match the location of the site at 9 angles from 2017 to 2018.