
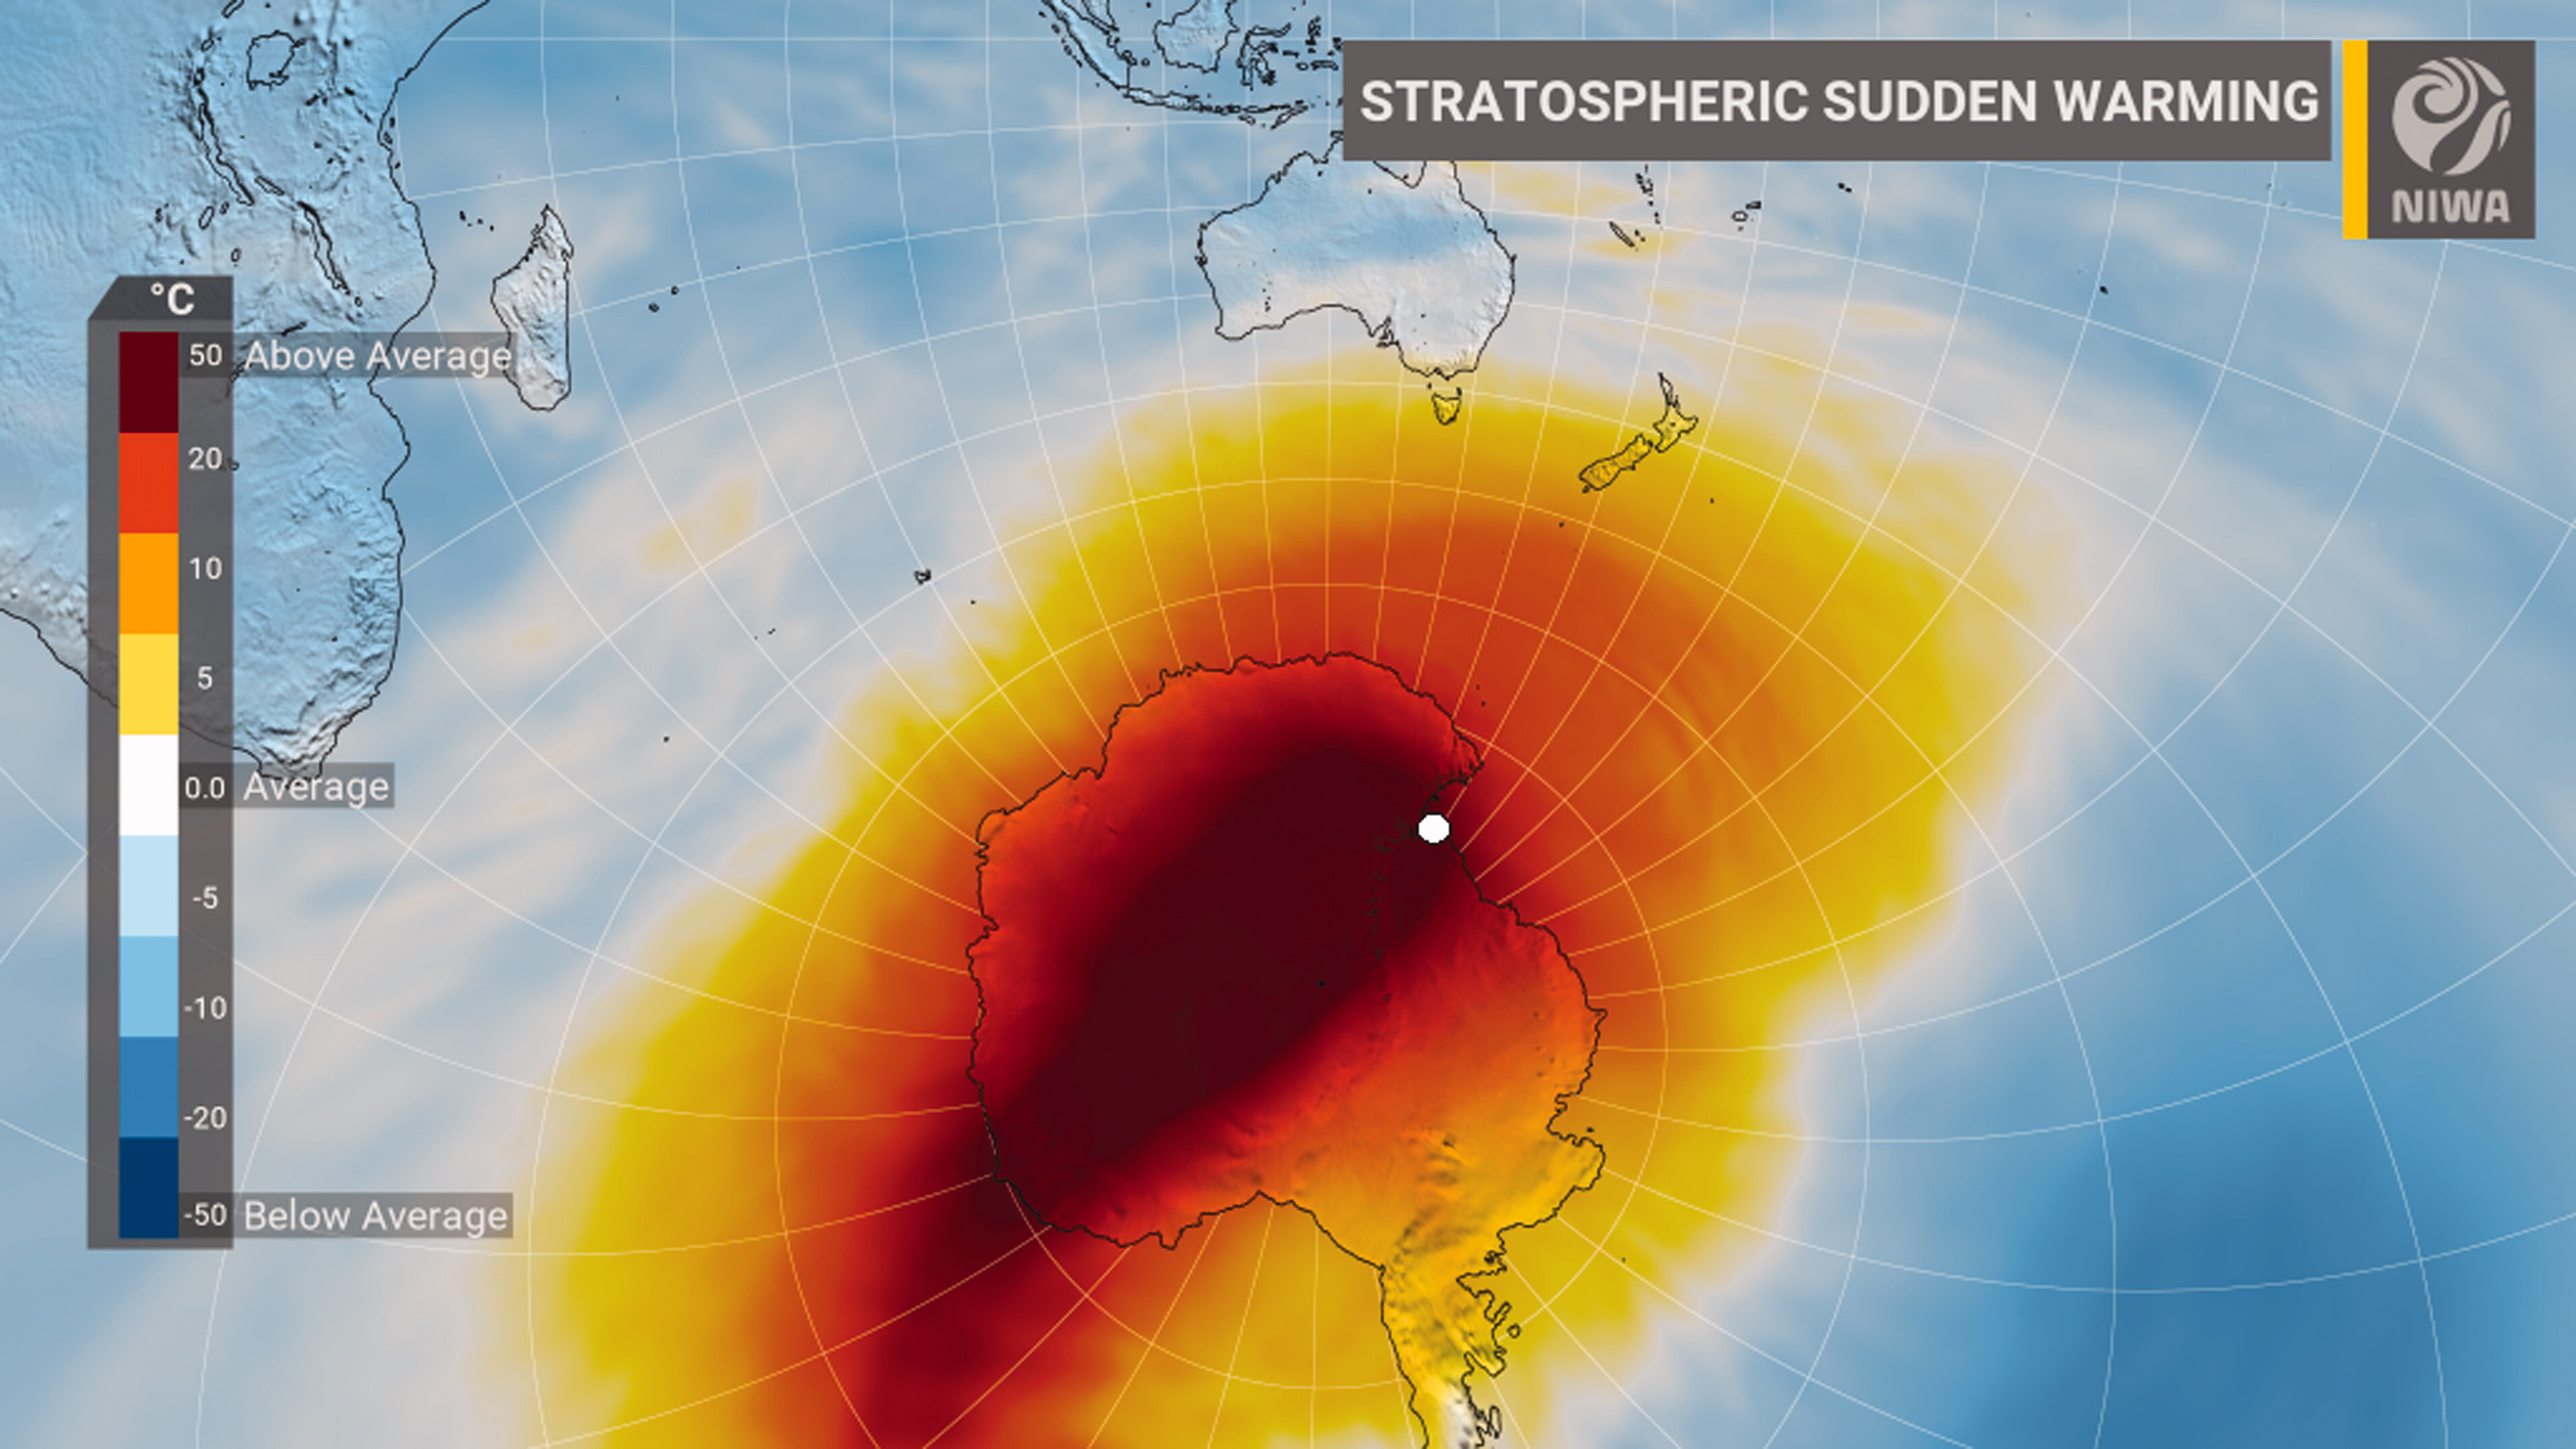
Fig. 1.
ERA5 reanalysis 10 hPa temperature at local midnight 12th September 2019 compared to the 1981-2010 climatology. The 12th September 2019 being the approximate date of peak temperature anomaly (Yamazaki et al., 2020). Arrival Heights (77.8°S, 166.7°E) is shown as a white dot. MERRA2 temperature anomaly is like that of ERA5.
Table 1.
Details of instrumentation and measurements used in this study.
(UV 345 − 384 nm
VIS 402 − 440 nm)2002-2019BrO, NO2,
O3, OClOFrieß et al. (2005)Bruker120m and 125HRArrival HeightsDirect-sun mid infrared Fourier transform interferometer
(800–4200 cm-1)1996-2019ClONO2, HCl, HF, HNO3, N2OKohlhepp et al. (2012)
Ronsmans et al. (2016)
Vigouroux et al. (2007)ChlOE1Scott BaseMicrowave radiometer (278.63 GHz)1996-2019ClONedoluha et al. (2016)DobsonArrival HeightsUV spectrophotometer
(300–350 nm)1988-2019O3Nichol (2018)RadiosondeMcMurdoRS92 and RS41-SGP in-situ soundings, twice daily (0, 12 UTC)2016-2019Pressure, TemperatureDirksen et al. (2020)
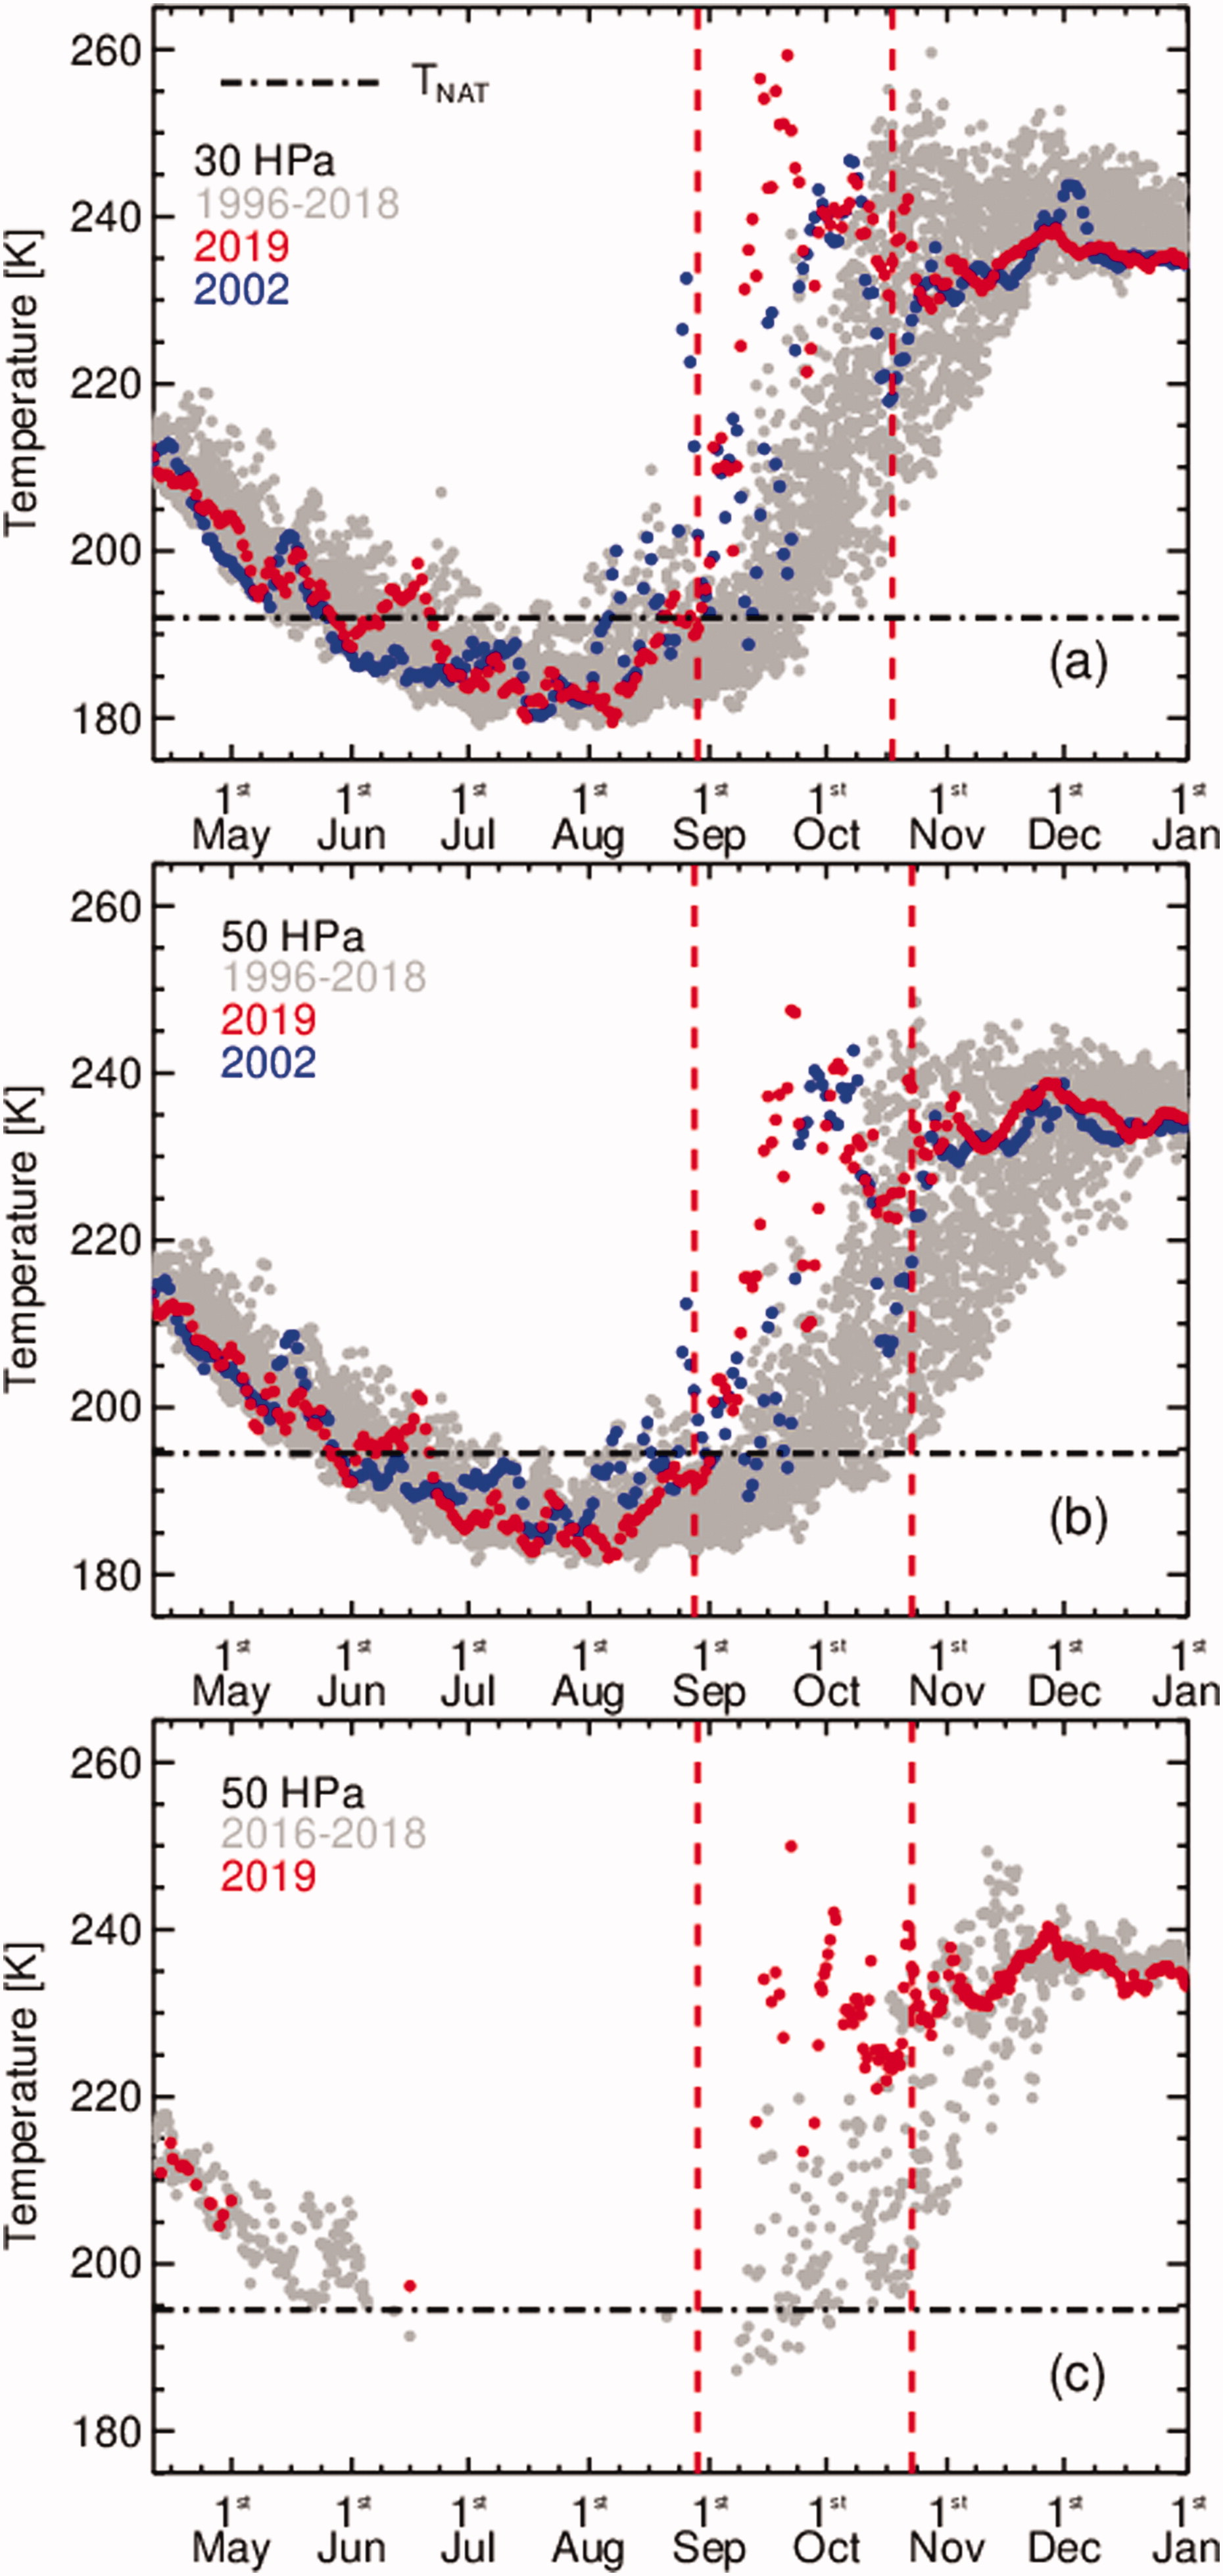
Fig. 2.
30 hPa and 50 hPa temperatures over AHTS from NCEP (panels A and B). McMurdo sonde 50 hPa temperature (panel C). Years with significant SSW events (2002 and 2019) are highlighted. The two vertical dashed red lines at 28th August and 22nd October indicate the onset on the 2019 SSW at AHTS and the last day AHTS is located beneath the polar vortex before vortex breakup. The black horizontal perforated line indicates the approximate formation temperature of NAT PSCs (∼192 K at 30 hPa and ∼195 K at 50 hPa). Supercooled ternary solution (STS) and water ice (ICE) PSCs form at temperatures lower than NAT formation temperatures.
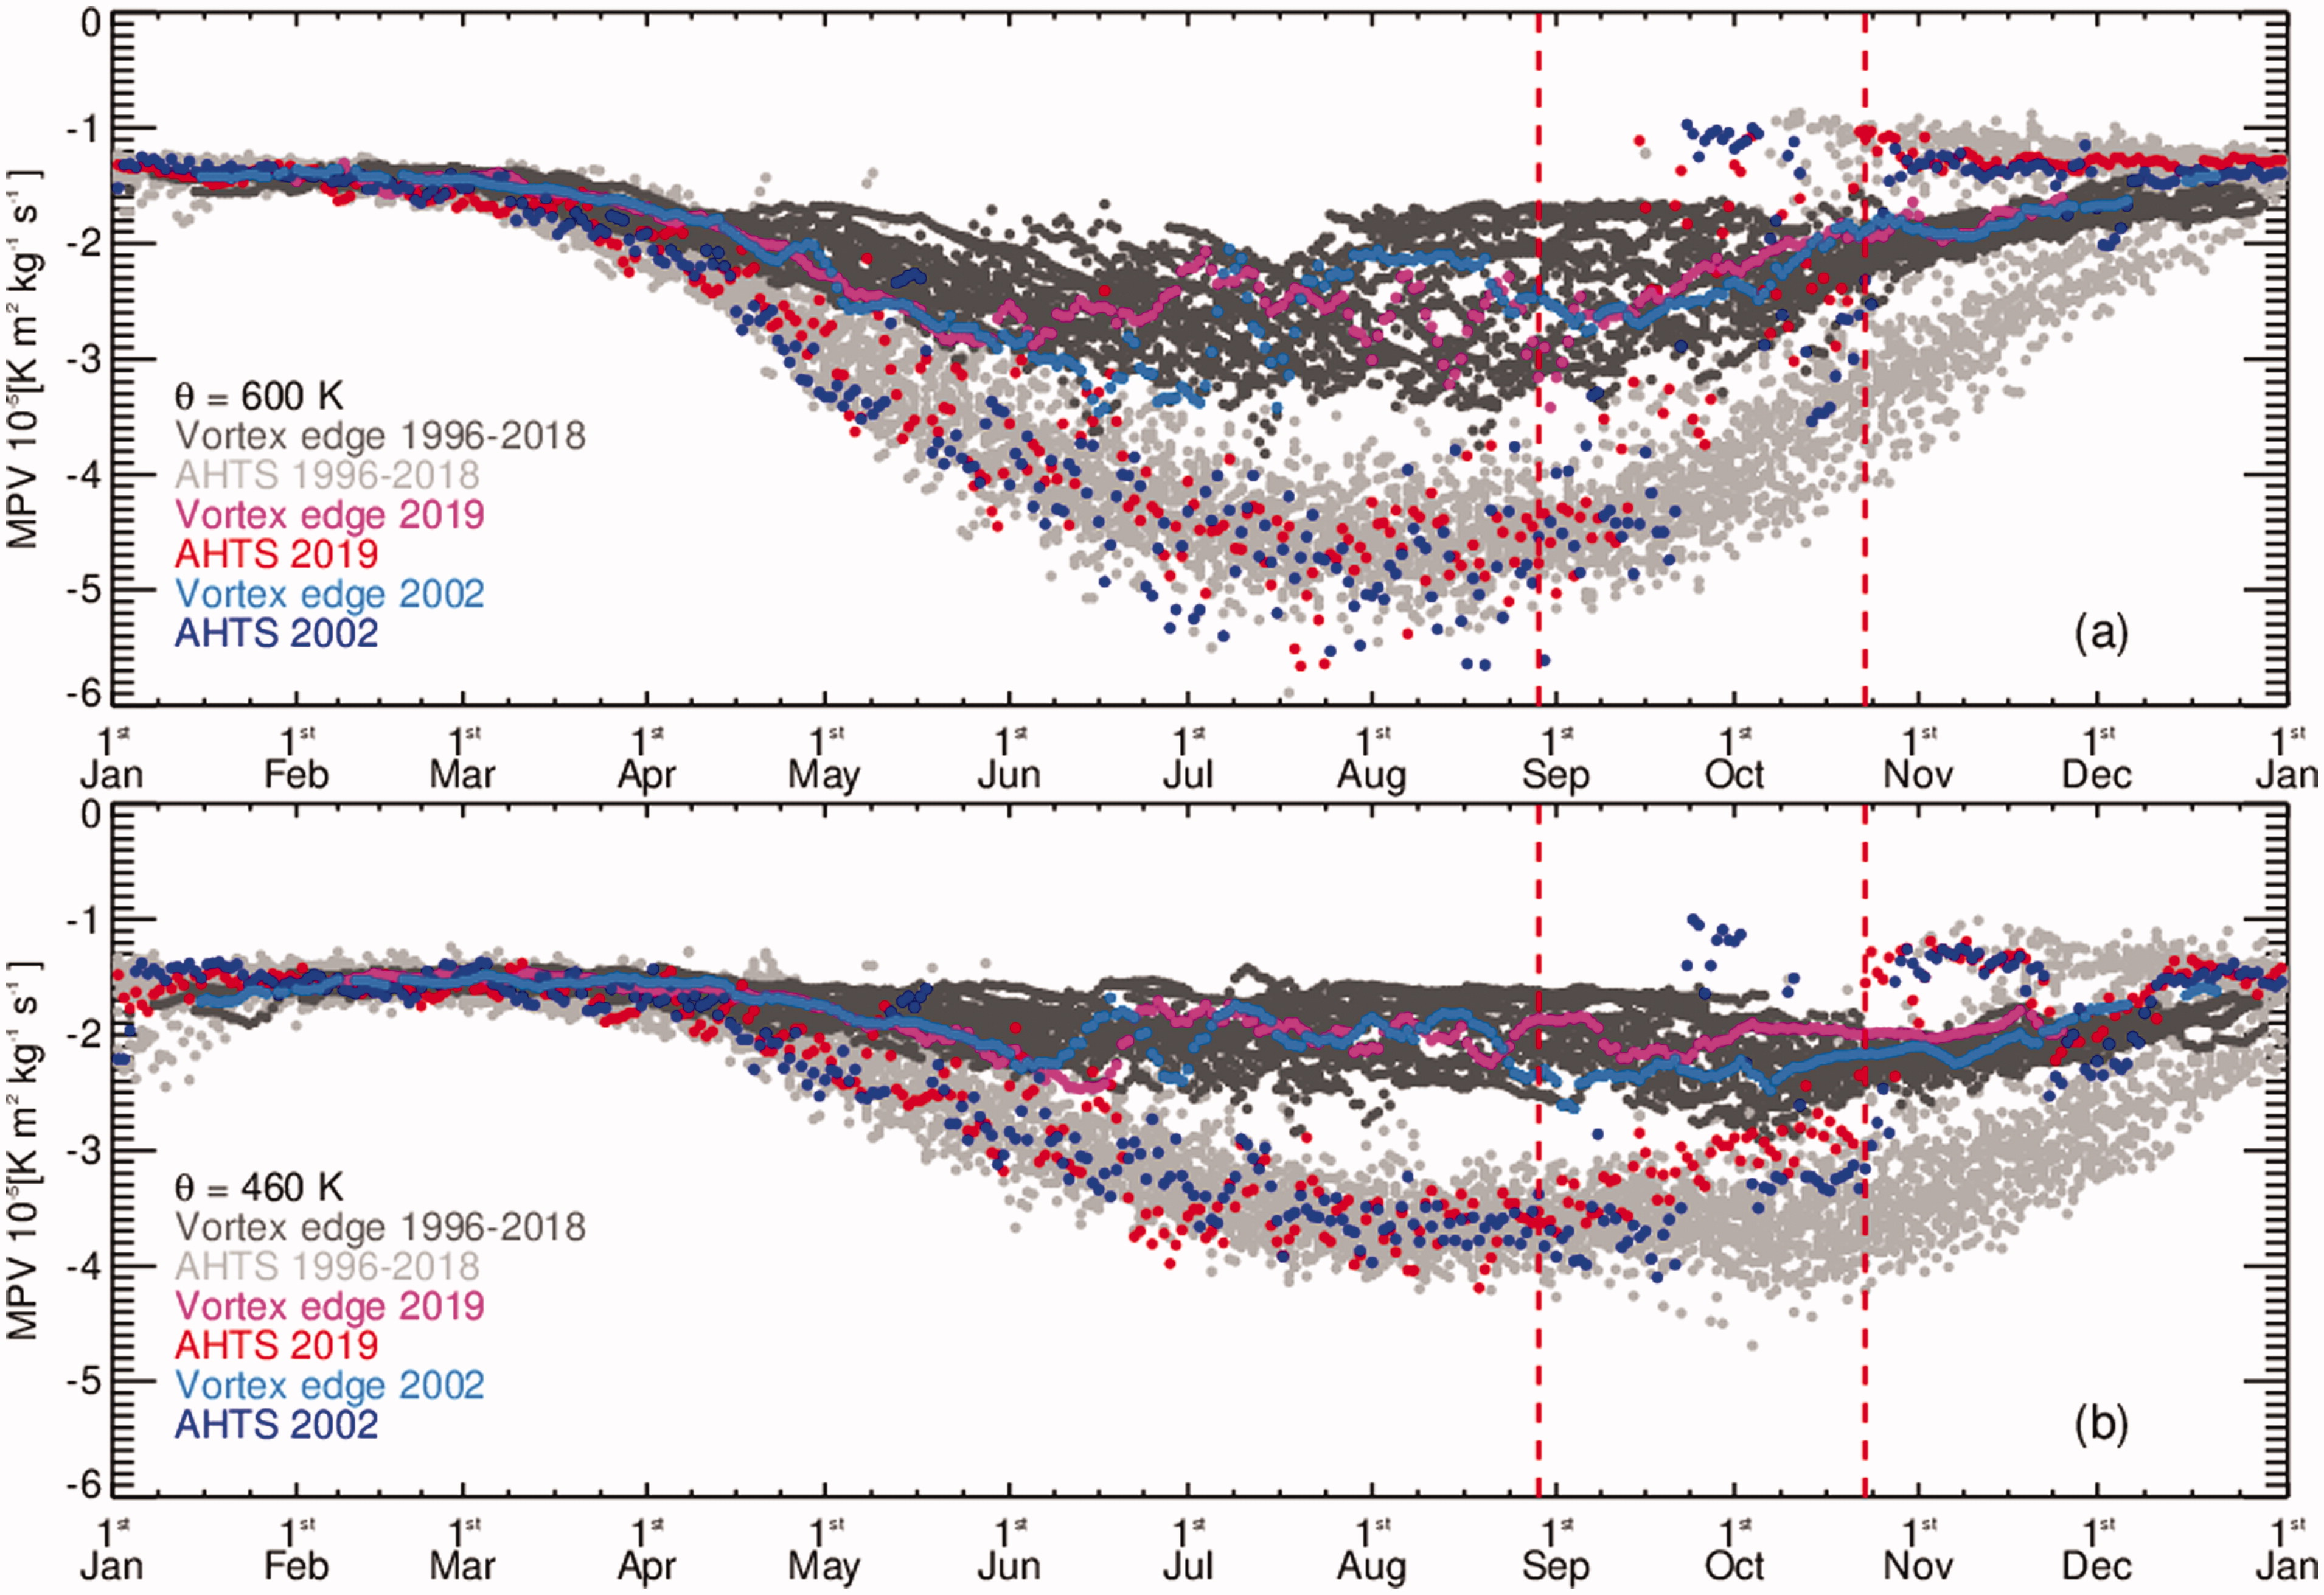
Fig. 3.
MERRA2 MPV at AHTS and the SH polar vortex edge at (a) 600 K and (b) 460 K isentropic levels over the years 1996 to 2019. Years 2002 and 2019 are highlighted.
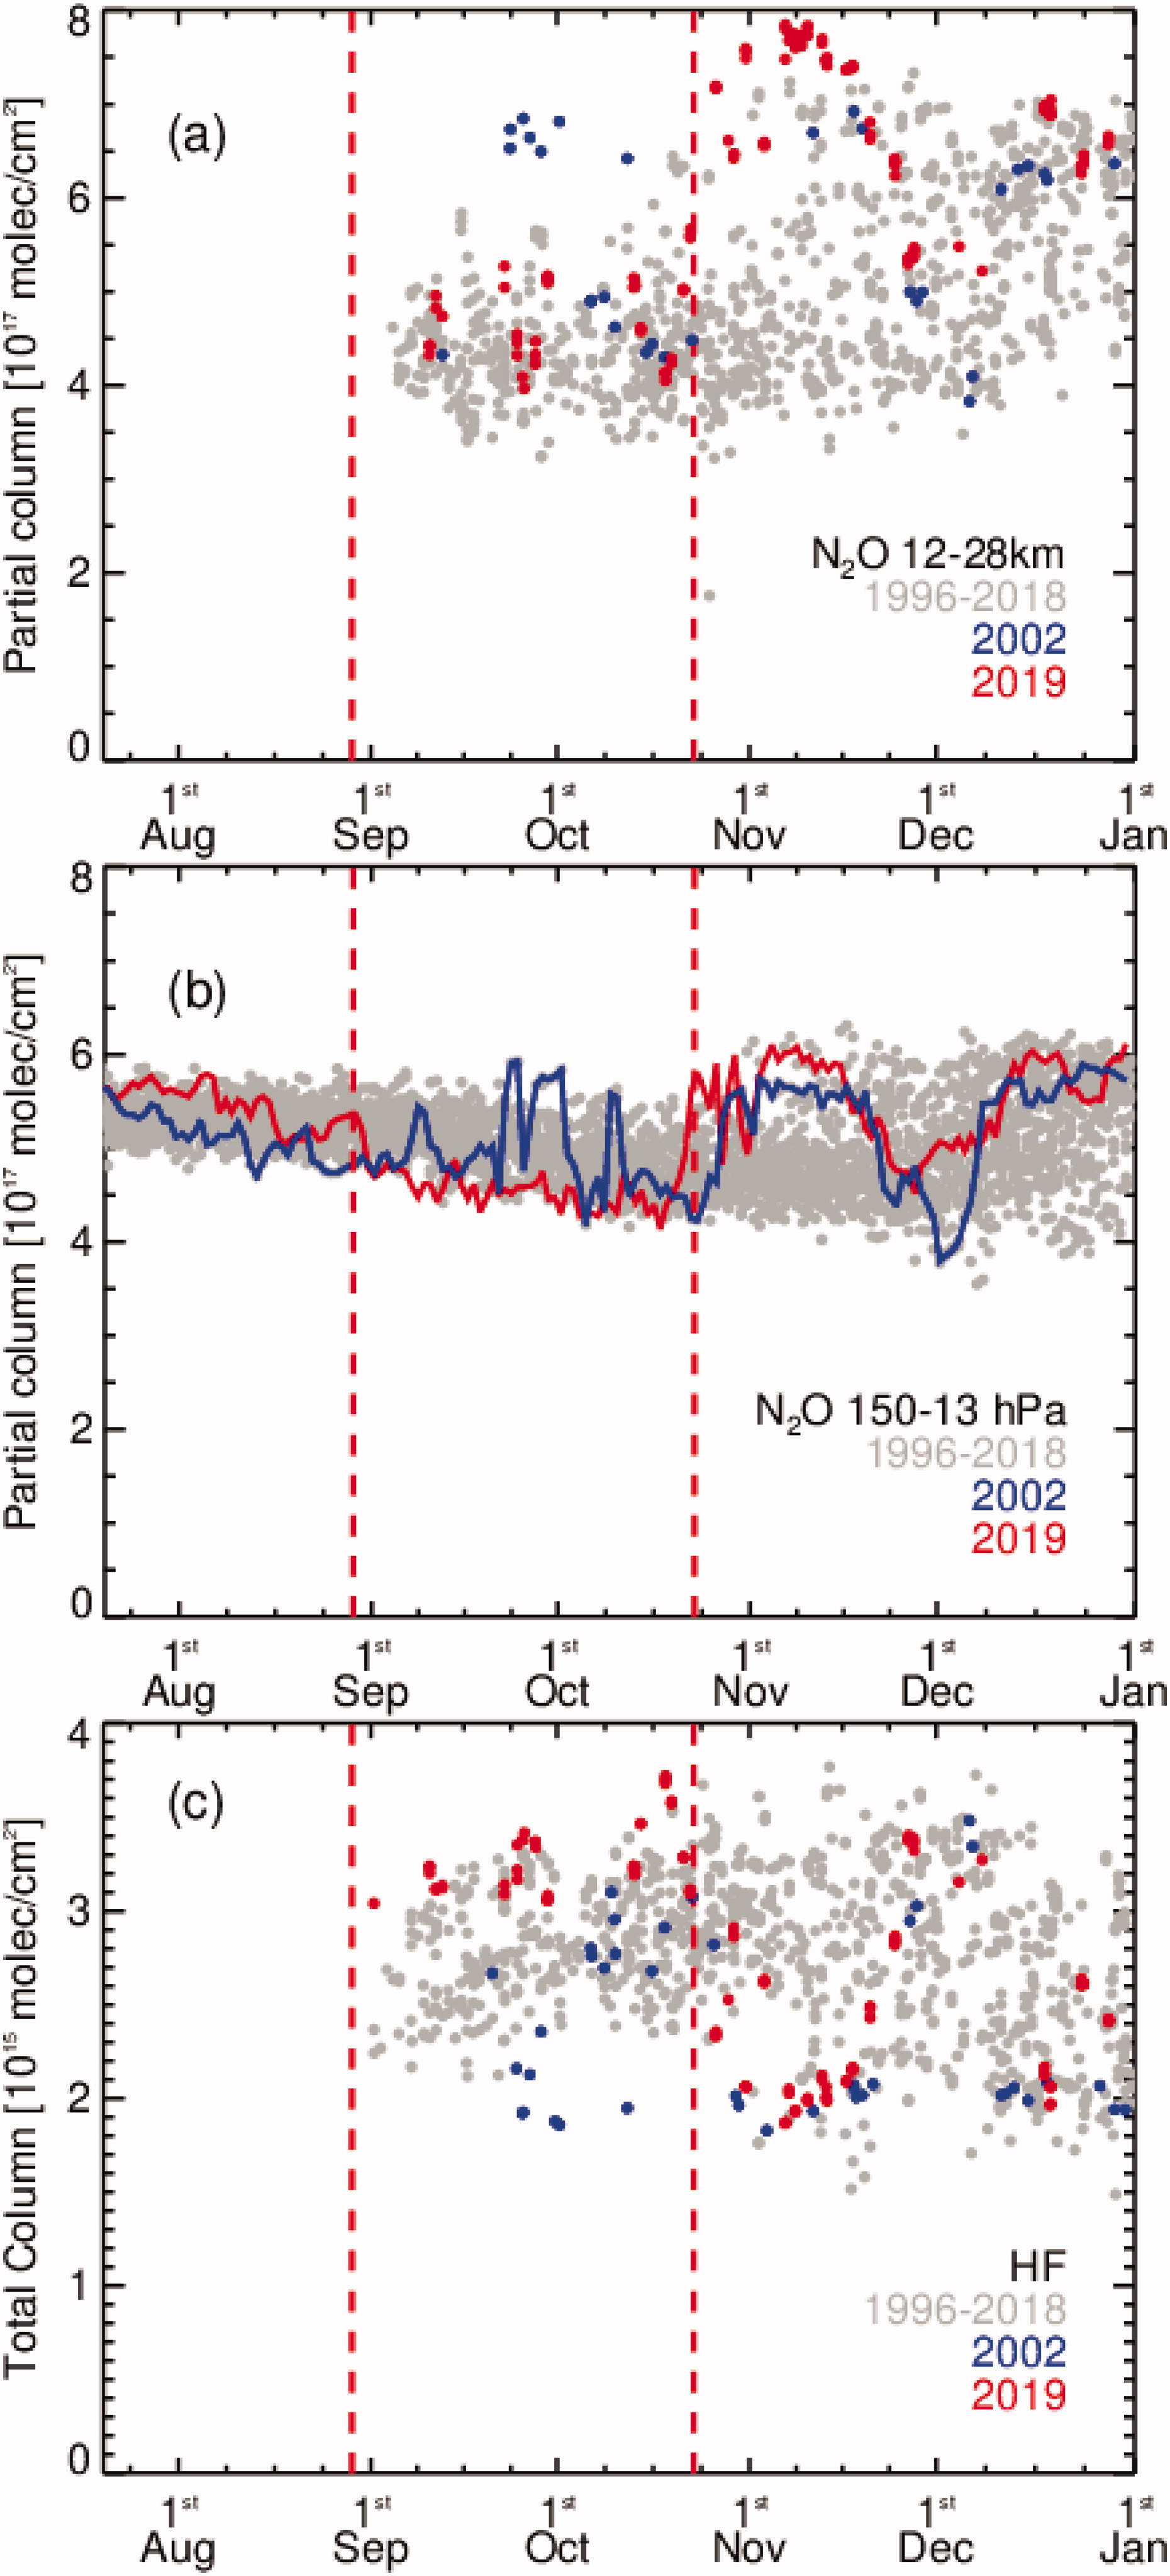
Fig. 4.
(a) N2O lower to mid stratosphere partial column (12–28 km) measured at AHTS. (b) GMI N2O partial column (150 to 13 hPa, ∼12.5–28km) over AHTS. (c) HF total column measured at AHTS.
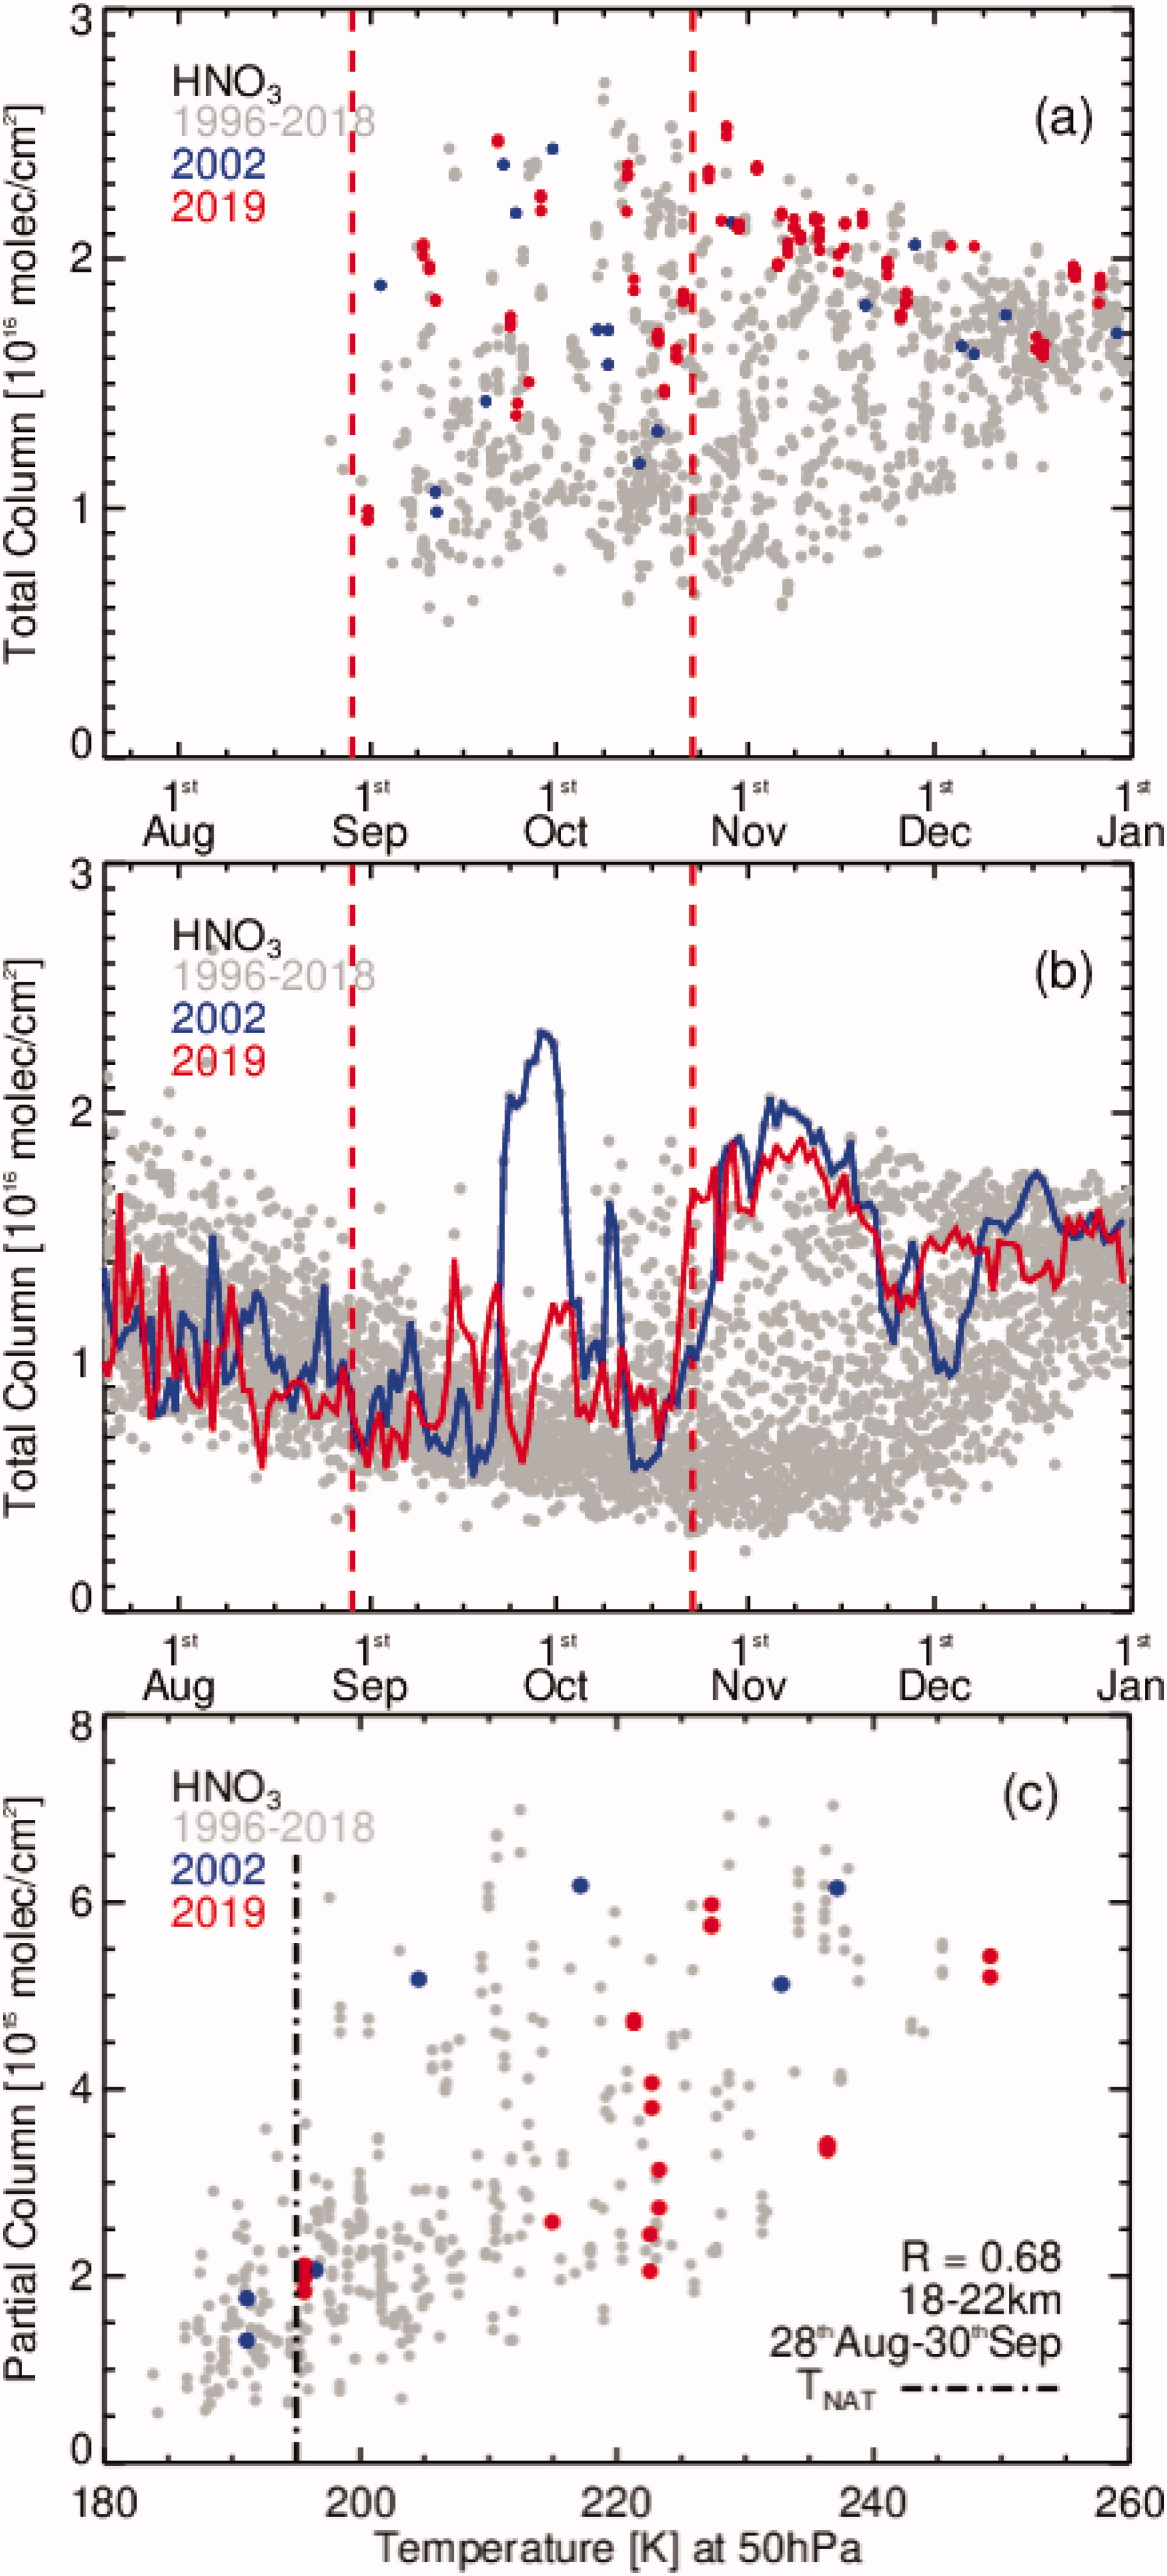
Fig. 5.
(a) HNO3 total column measurement at AHTS. (b) GMI HNO3 total column simulations over AHTS. (c) Scatter plot of measured HNO3 partial columns (18–22 km) against NCEP 50 hPA temperature from 28th August (the start of the SSW) until the end of September. NAT formation temperature is ∼195 K at 50 hPa.
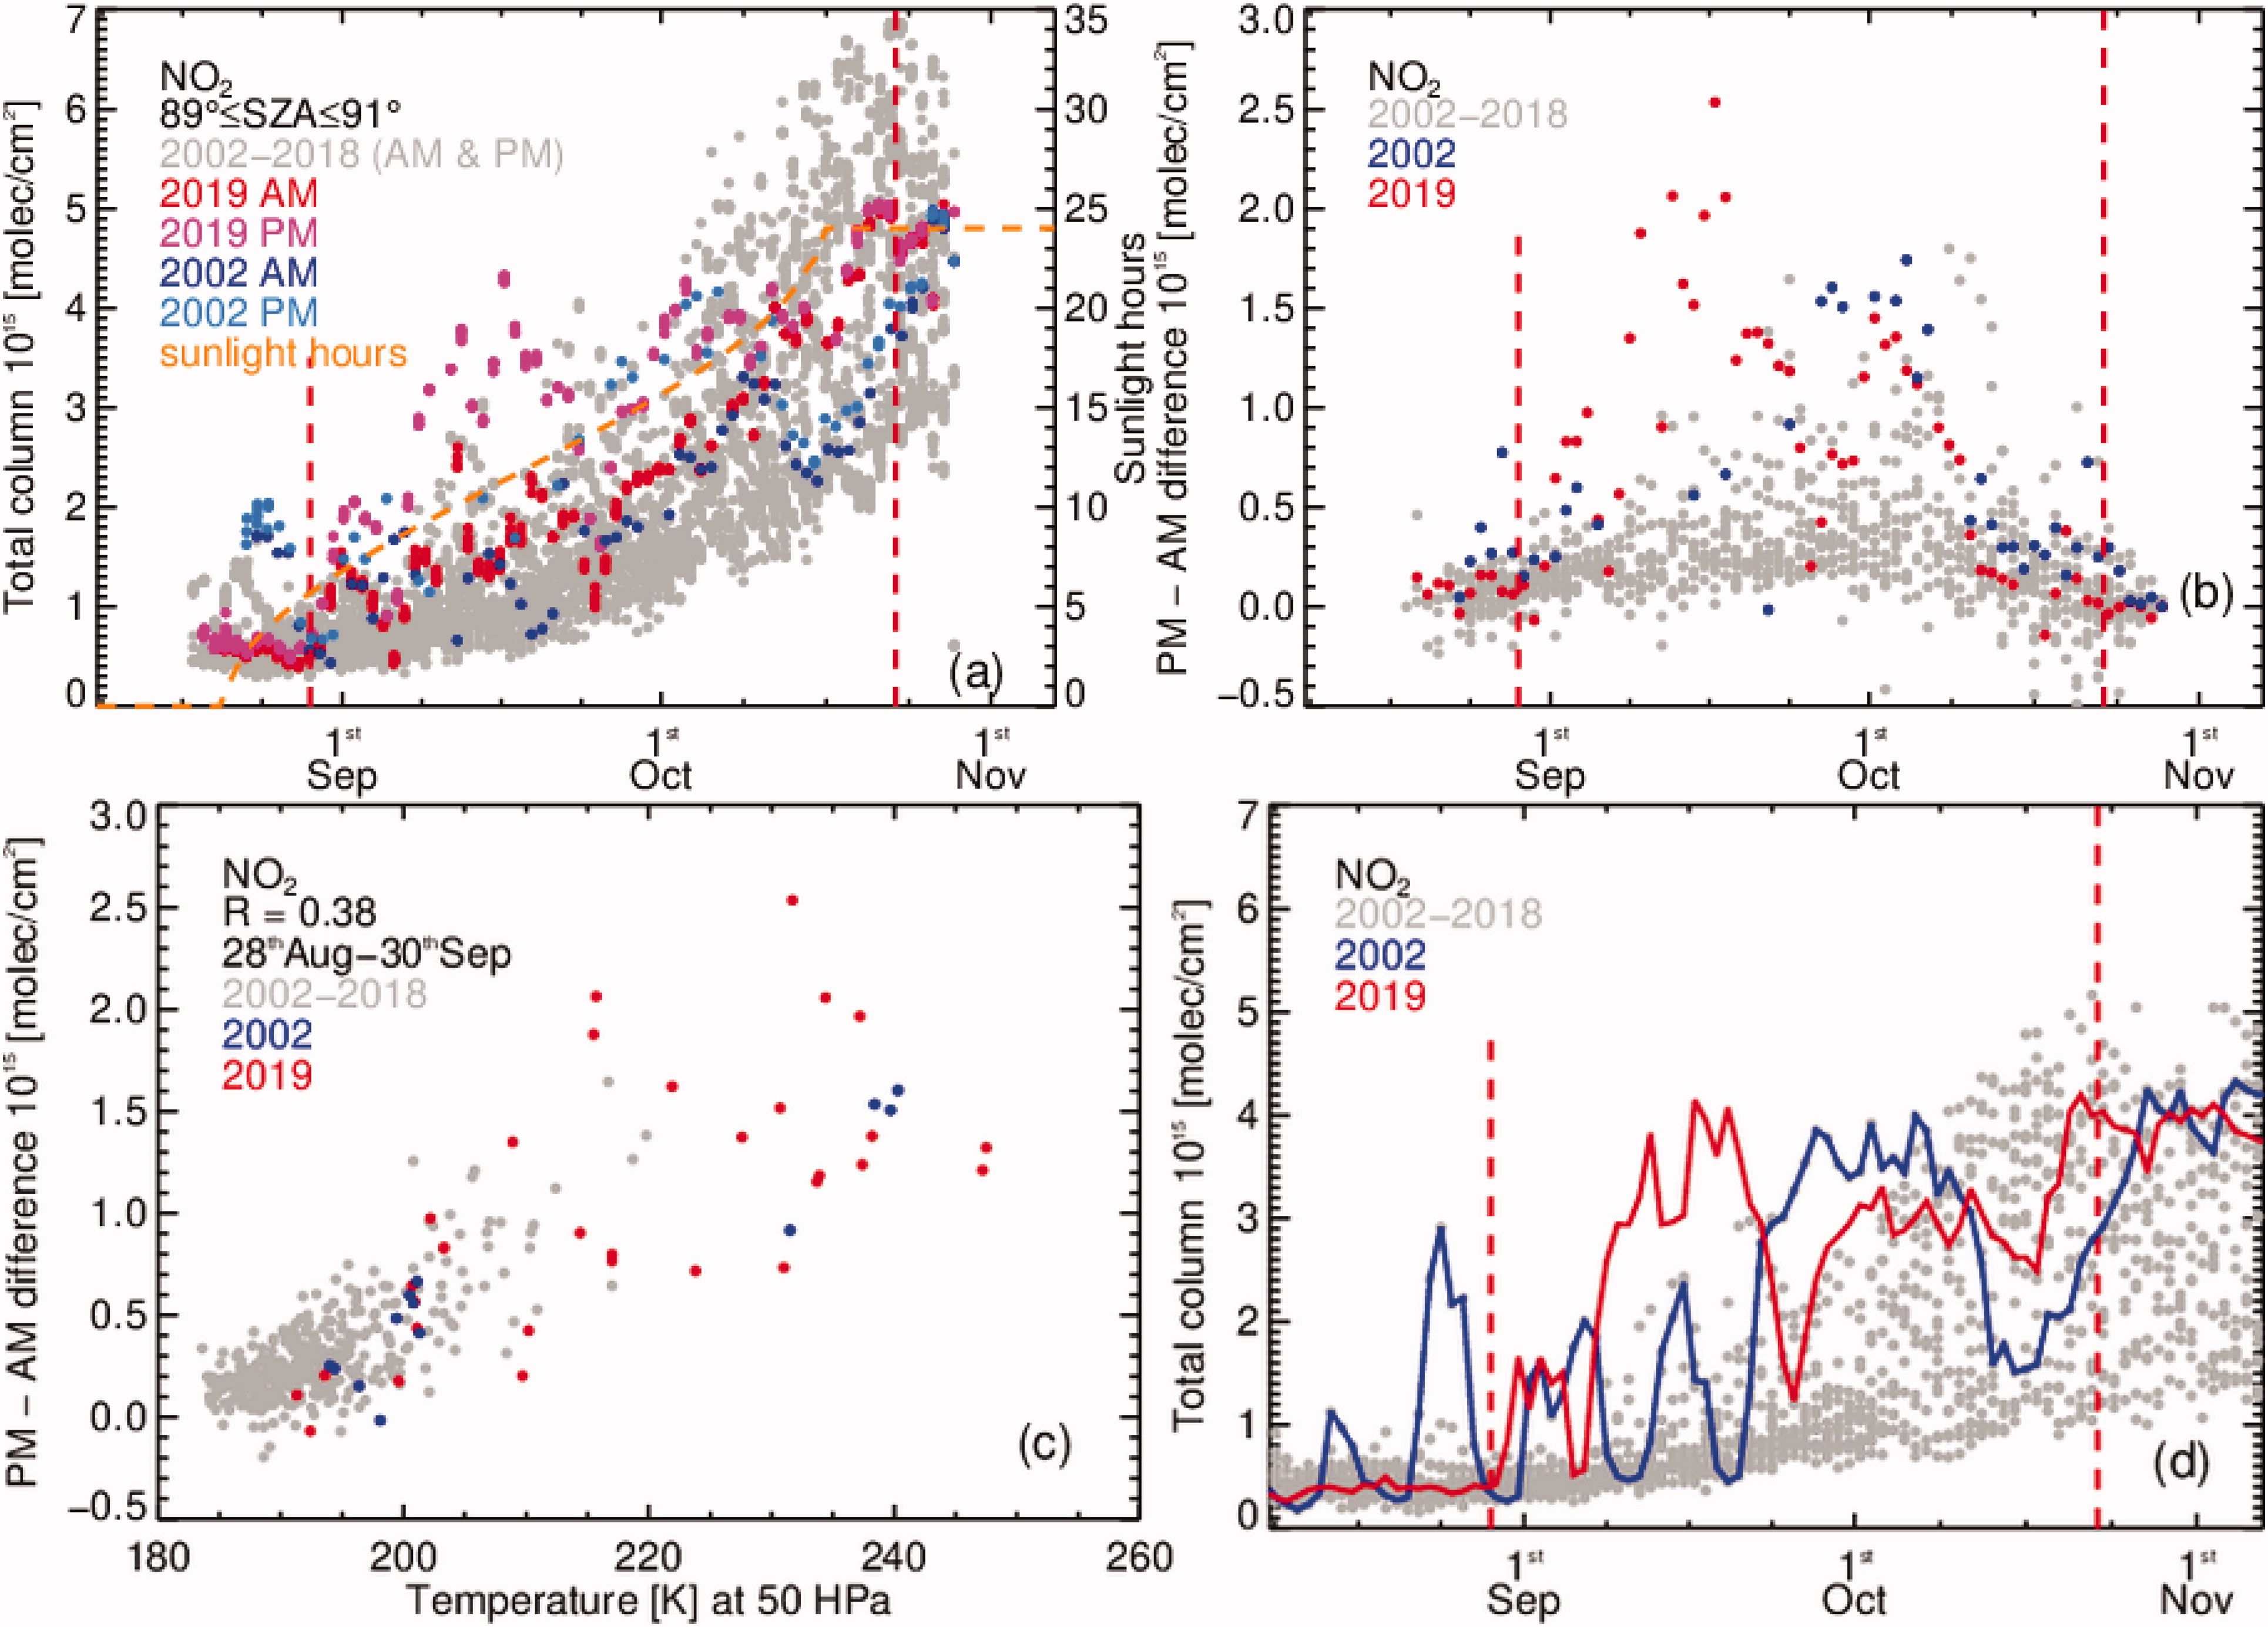
Fig. 6.
(a) NO2 total column zenith sky measurement at AHTS. Measurements are segregated into sunrise (AM) and sunset (PM). Overlaid is sunlight hours per day defined as sunrise to sunset viewed from a 20 km tangent altitude. (b) Difference between the PM and AM measurements in springtime. (c) Difference between the PM and AM measurements correlated to temperature at 50 hPA, over the period 28th August to 30th September (d) GMI total column NO2 over AHTS at 1200 local time (NZST).
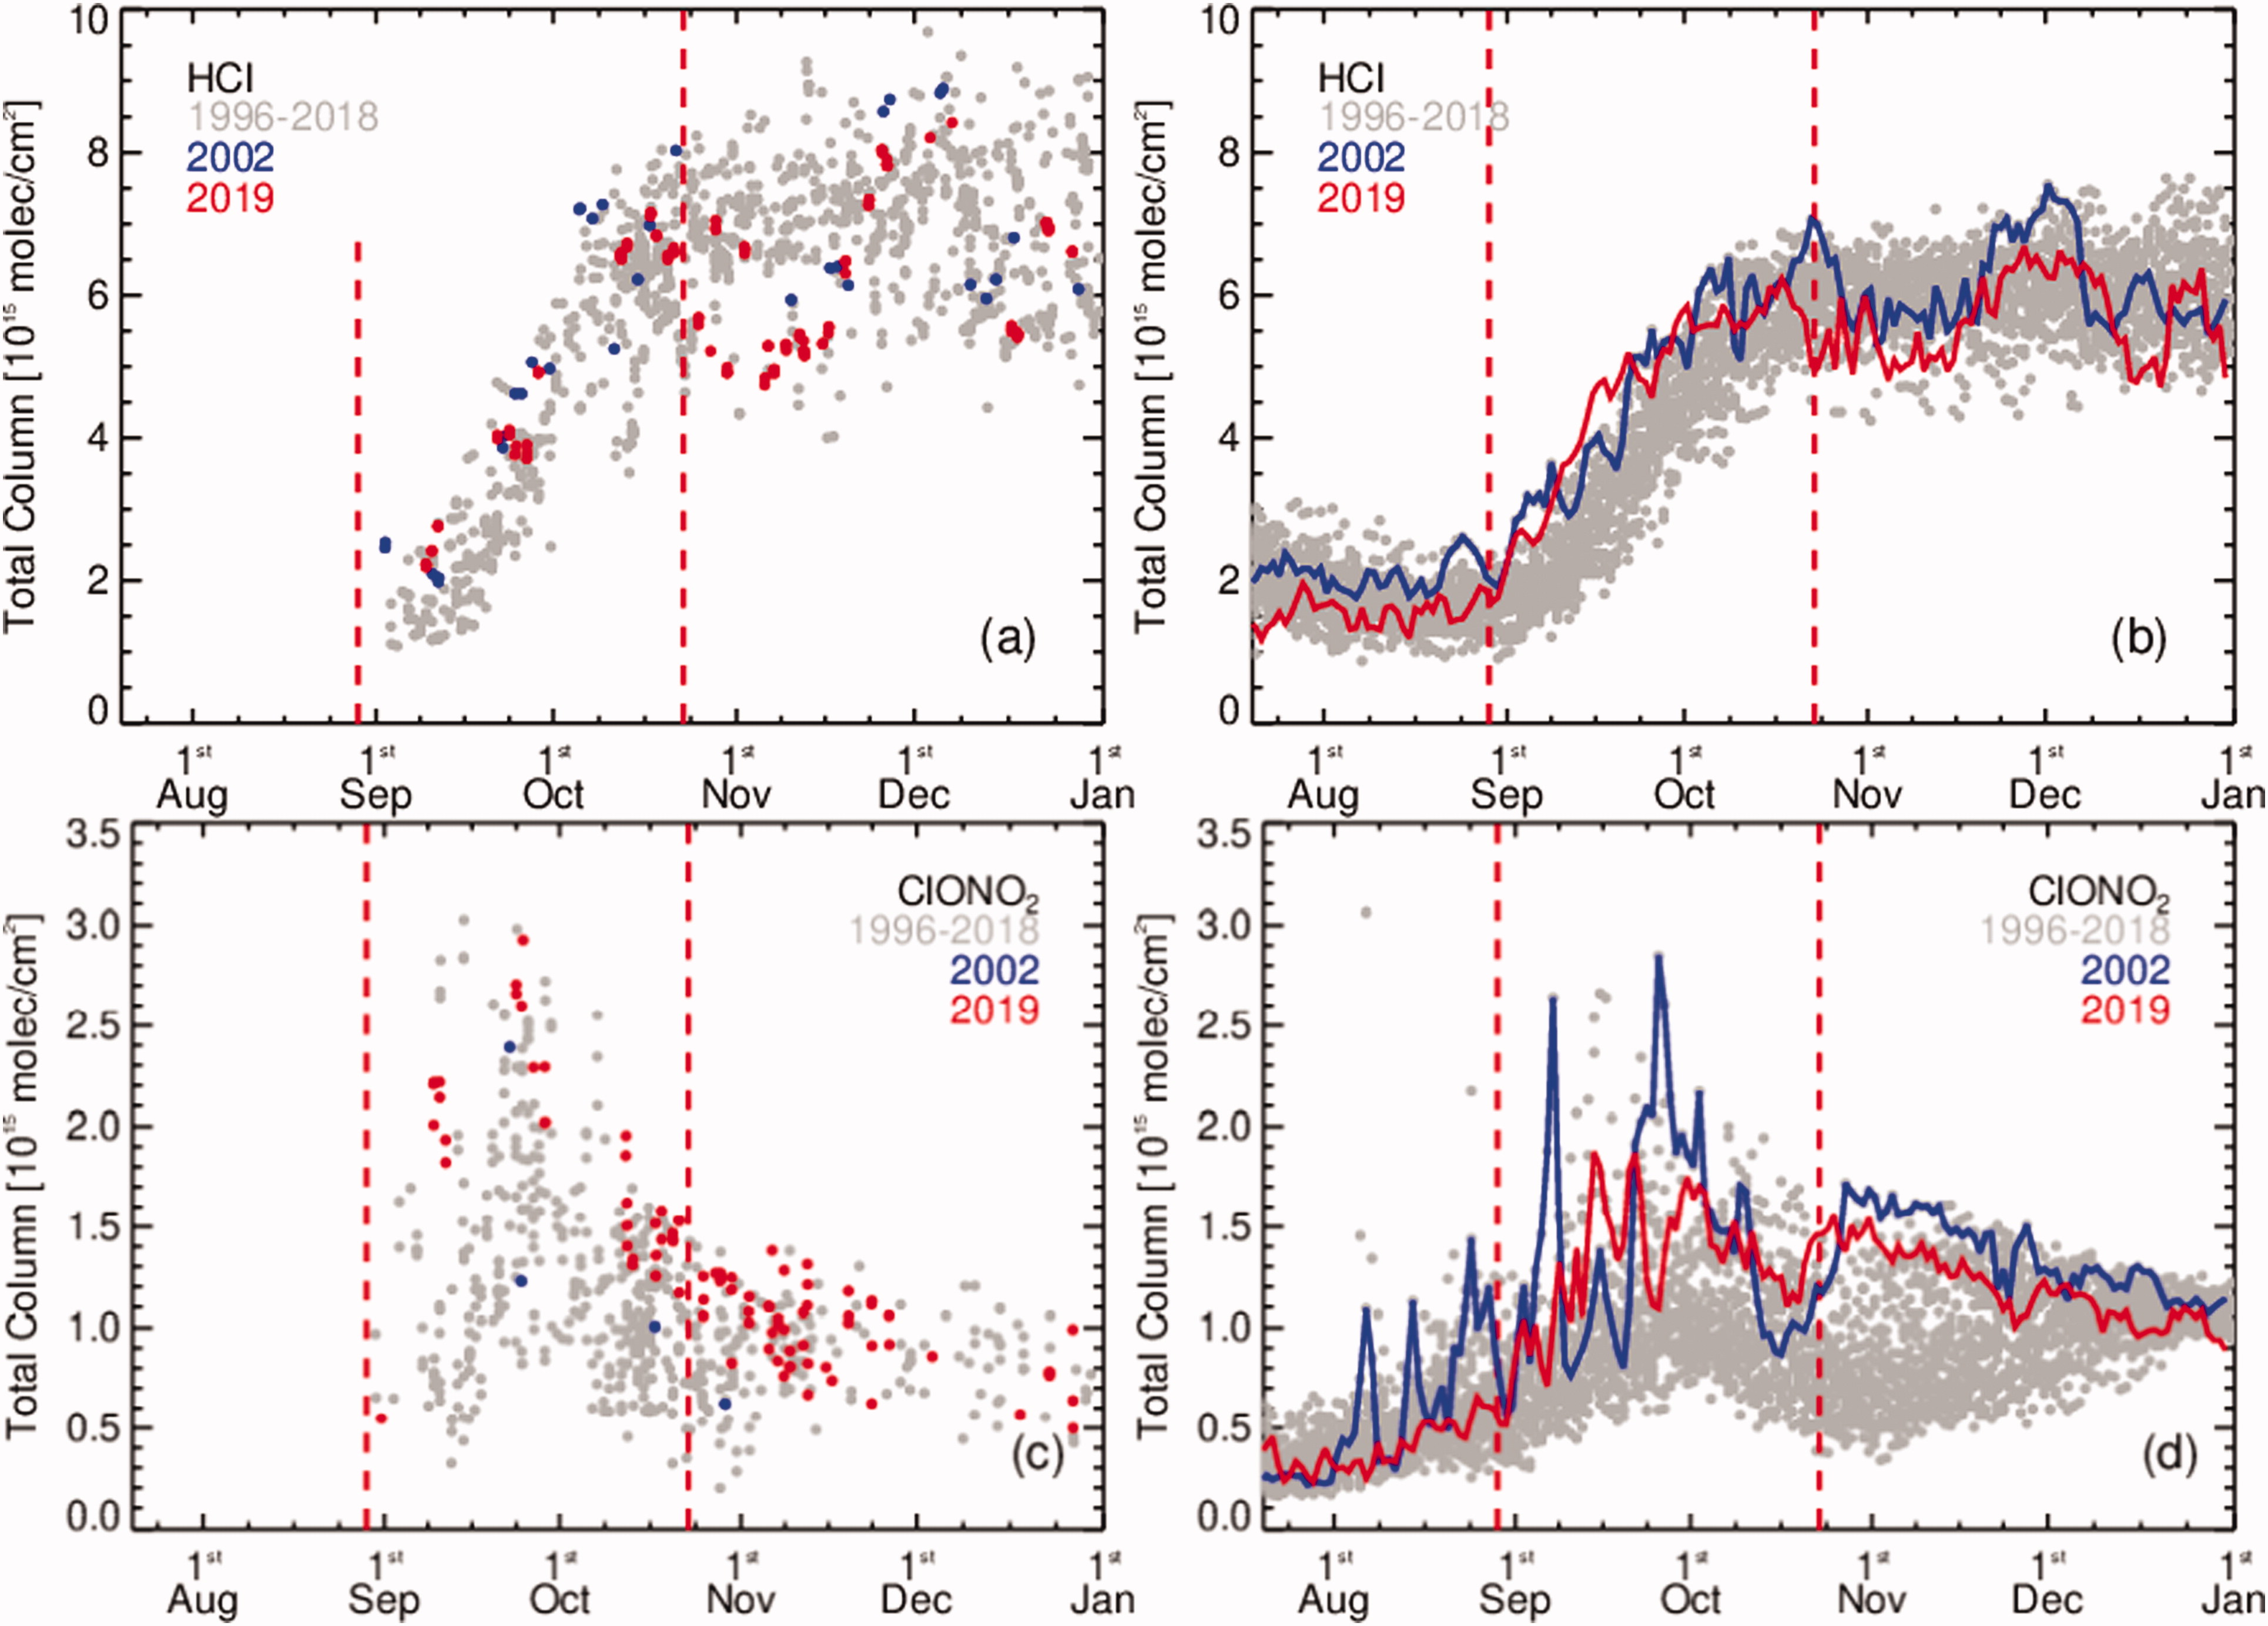
Fig. 7.
(a) HCl total column measured at AHTS. (b) GMI total column HCl over AHTS. (c) ClONO2 total column measured at AHTS. (d) GMI total column ClONO2 over AHTS.
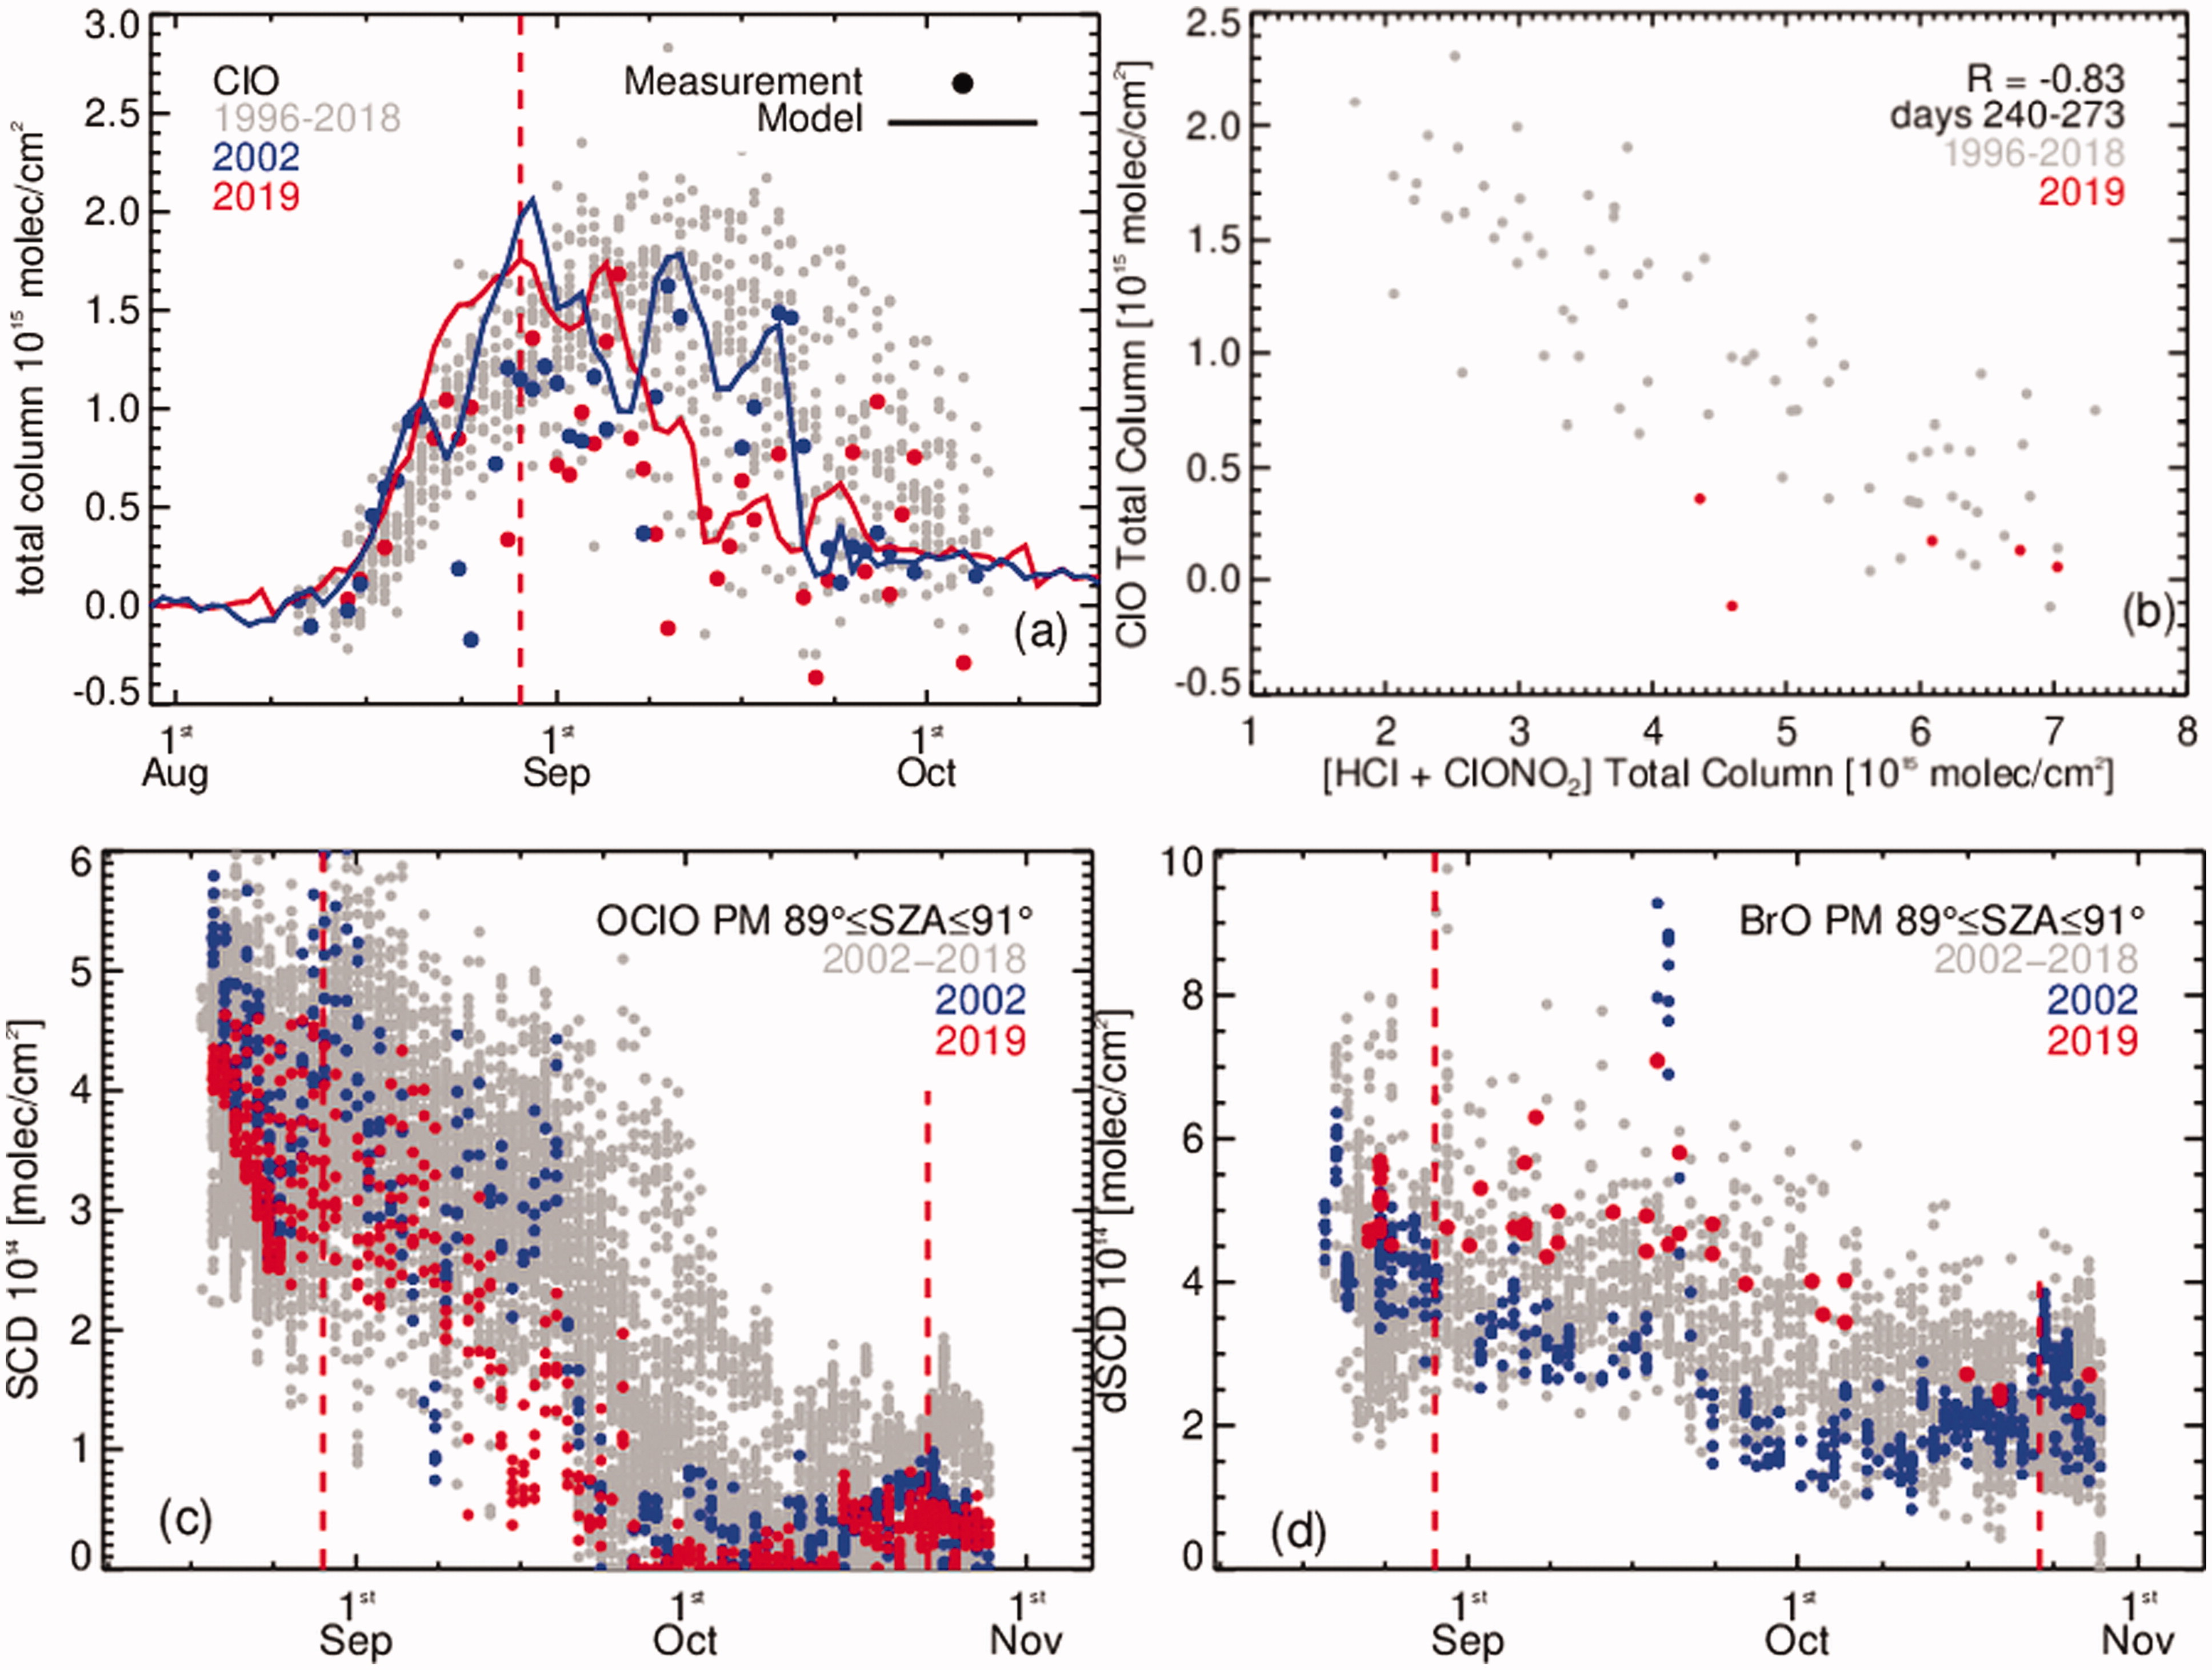
Fig. 8.
(a) ClO total column (day minus night) measurements and model simulations over AHTS. (b) Scatter plot of combined HCl and ClONO2 total columns against ClO total column for the period 28th August to 30th September, within the polar vortex. In 2002 there is no such coincidence datasets within the vortex. (c) OClO slant column densities measured over AHTS. (d) BrO differential slant column densities measured over AHTS.
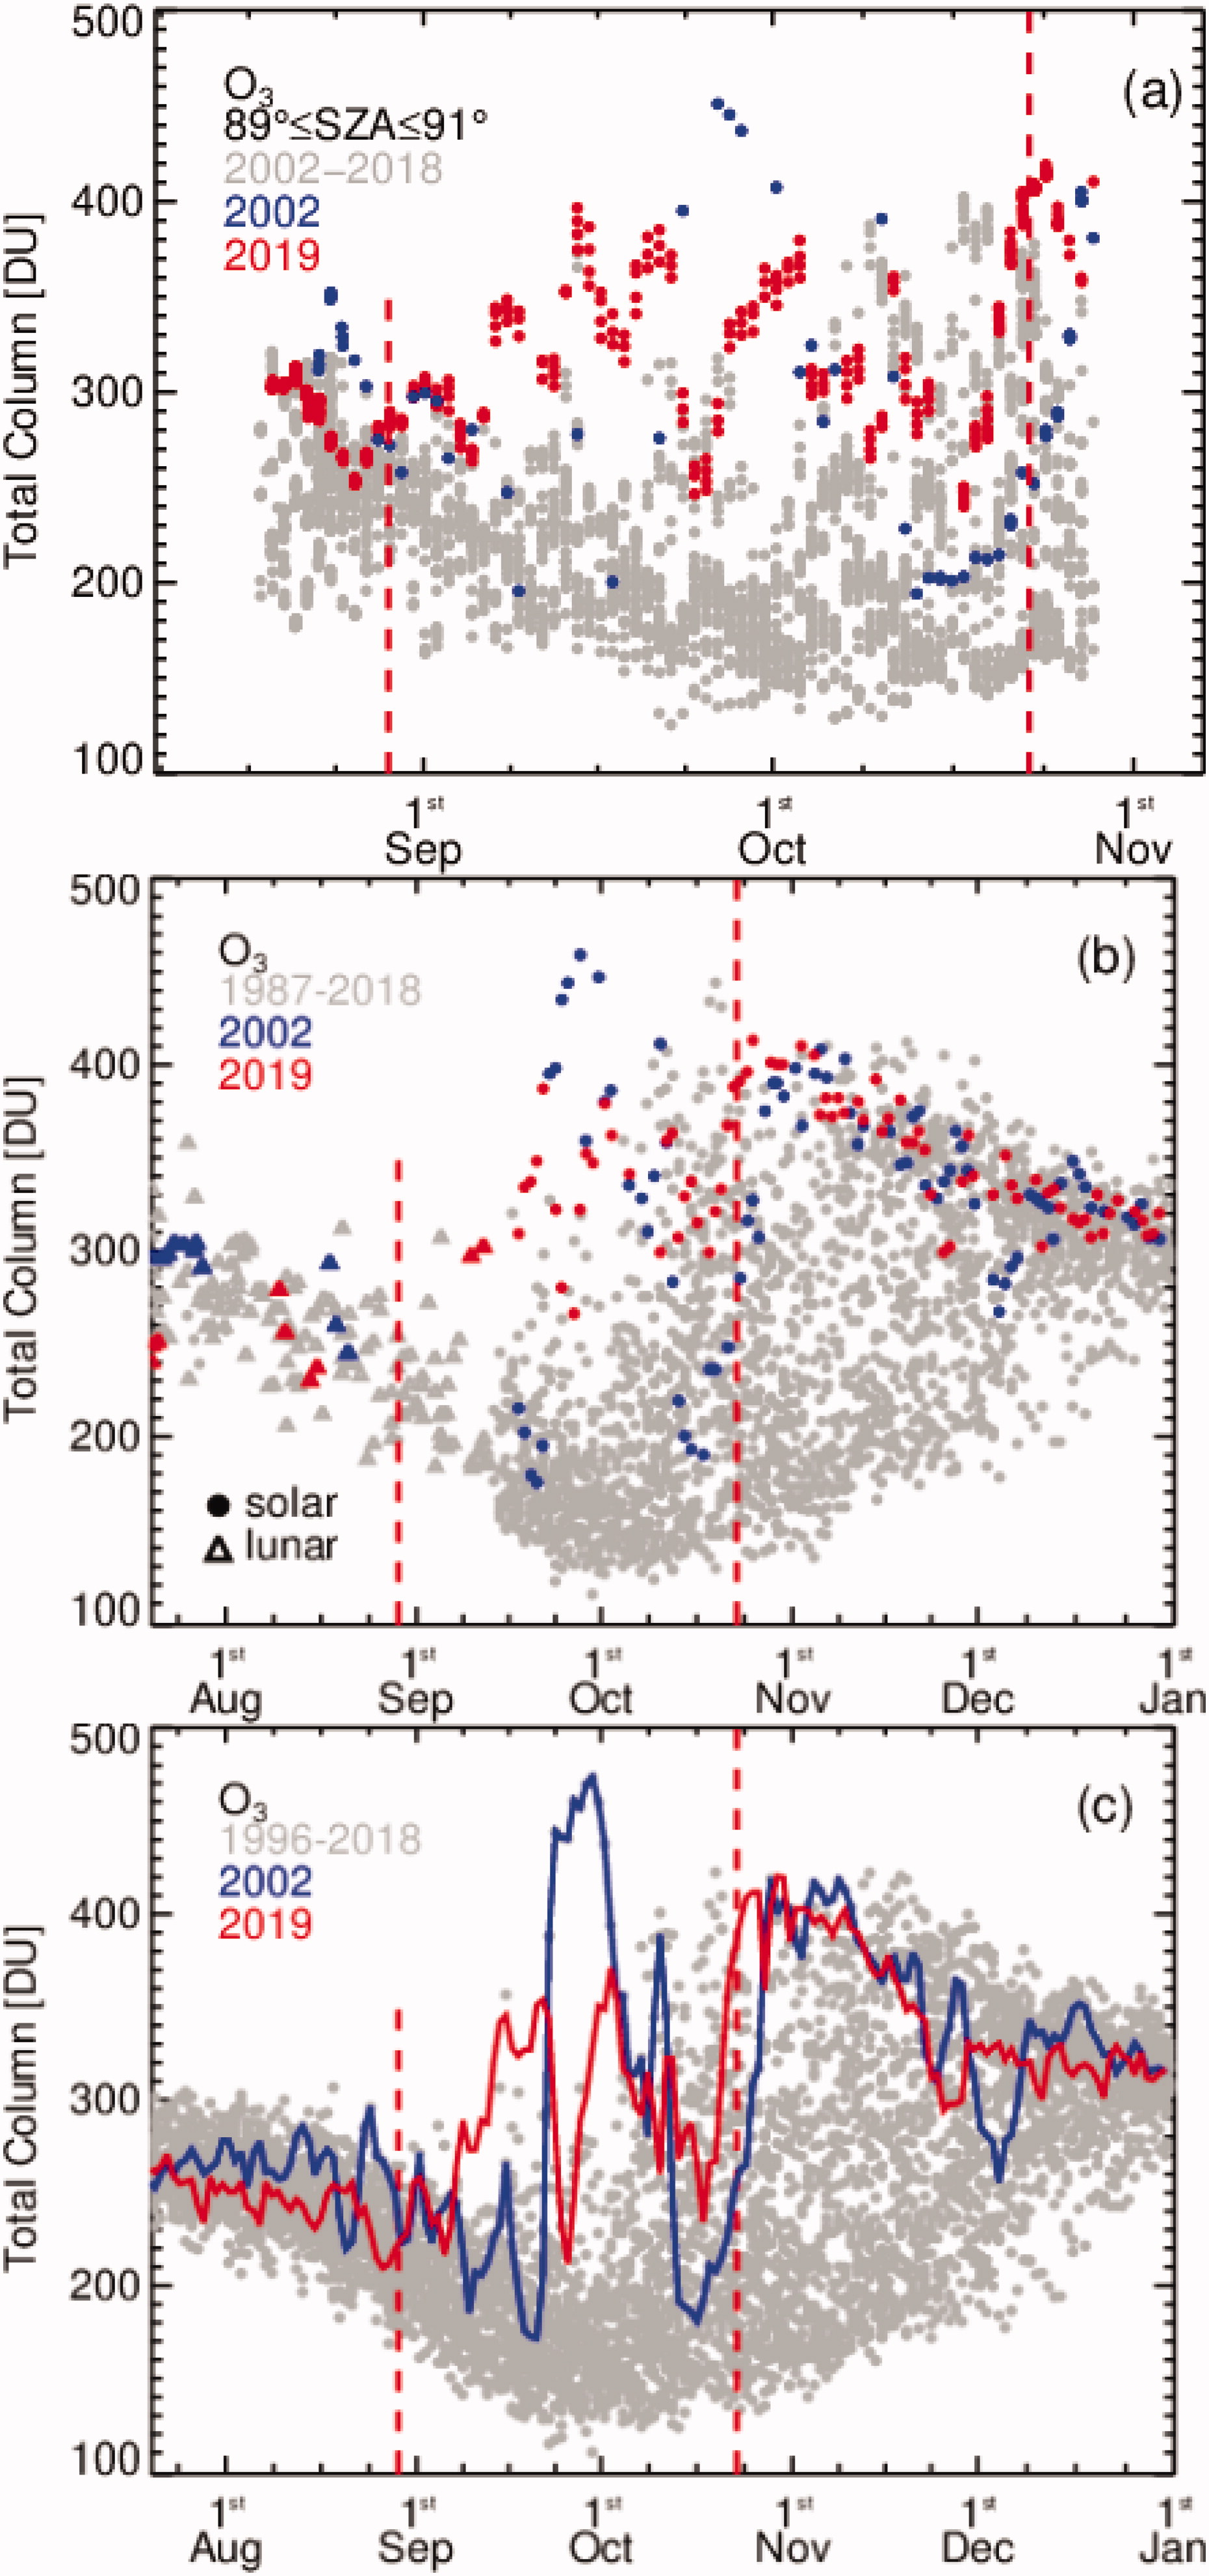
Fig. 9.
(a) ADAS2 zenith sky total column ozone measurements over AHTS. (b) Dobson total column ozone measurements over AHTS. (c) GMI total column ozone over AHTS.