
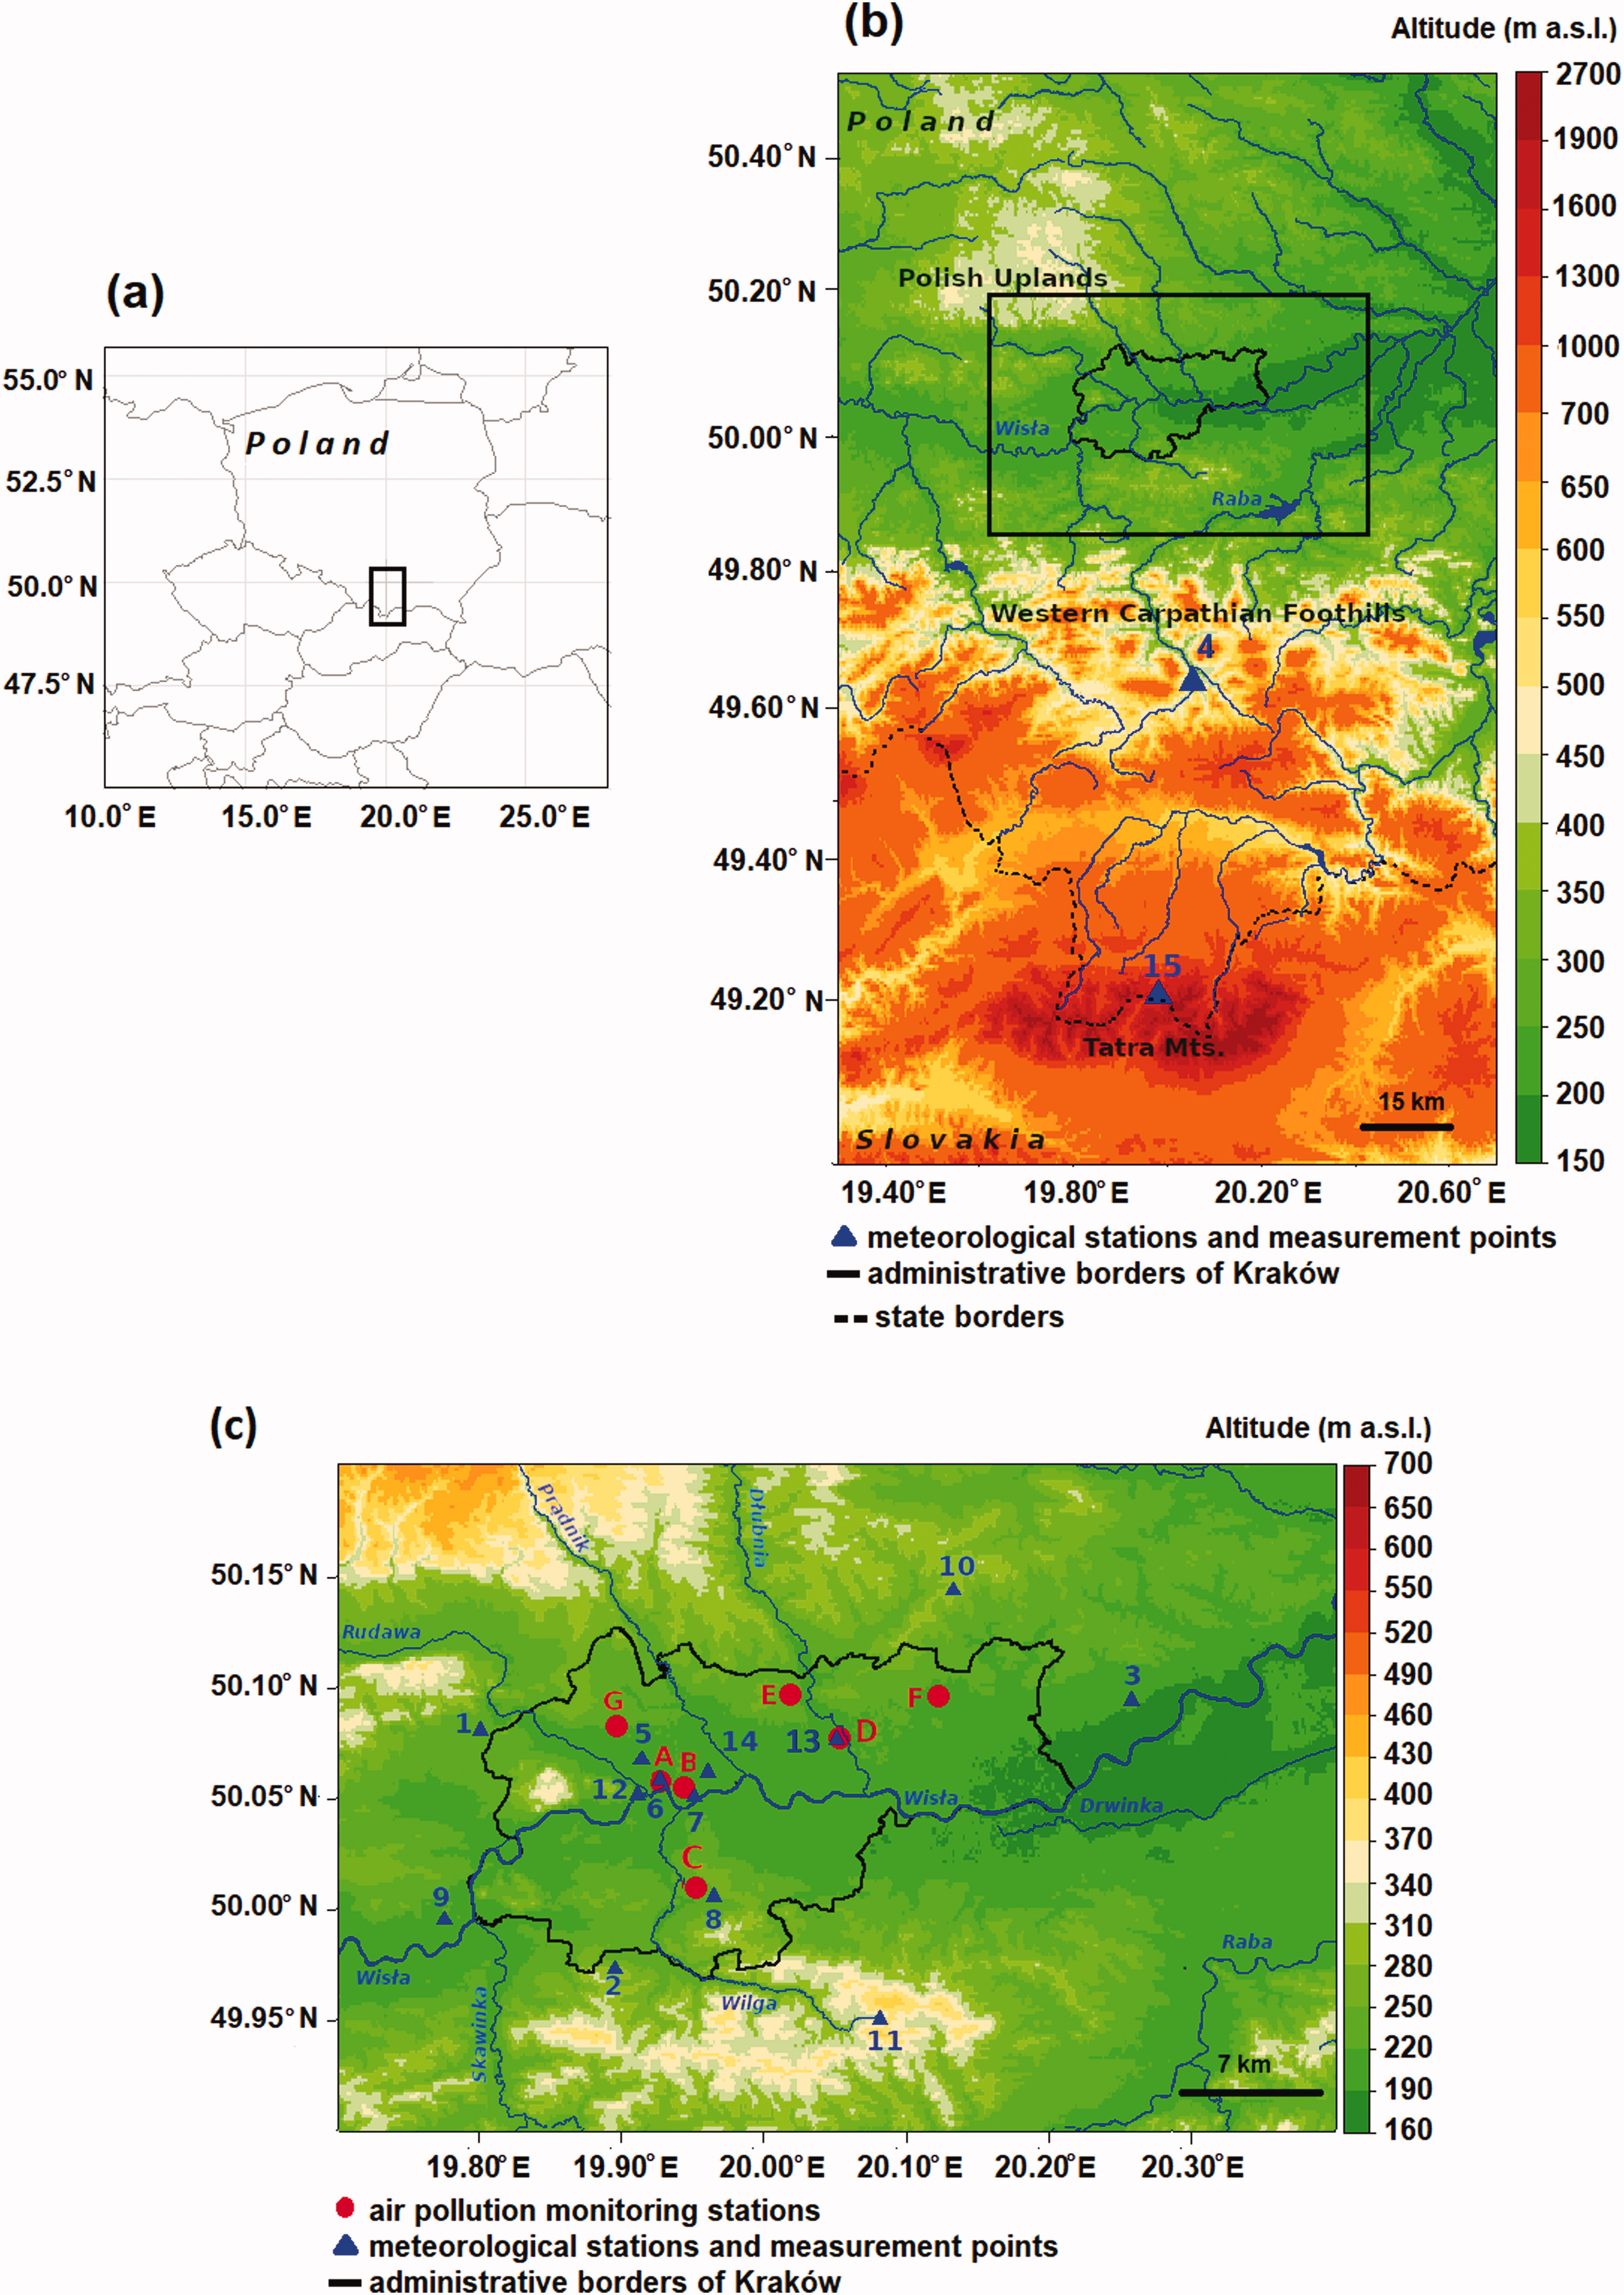
Fig. 1.
Location of the region studied: a. in Central Europe, b. in southern Poland, c. at the junction of the Wisła valley, Polish Uplands and the Western Carpathian Foothills.
Key: numbers and letters as in Tables 1 and 2. Topographic data used in Fig. 1 comes from the Shuttle Radar Topography Mission database provided by National Aeronautics and Space Administration (https://www2.jpl.nasa.gov/srtm/).
Table 2.
Location of air pollution stations in Kraków.
valley bottomDBulwarowa St.50.0820.05195Valley bottomEPiastów district50.1020.02239Valley slopeFWadów district50.1020.12218Valley bottomGZłoty Róg St.50.0819.90218Valley slope
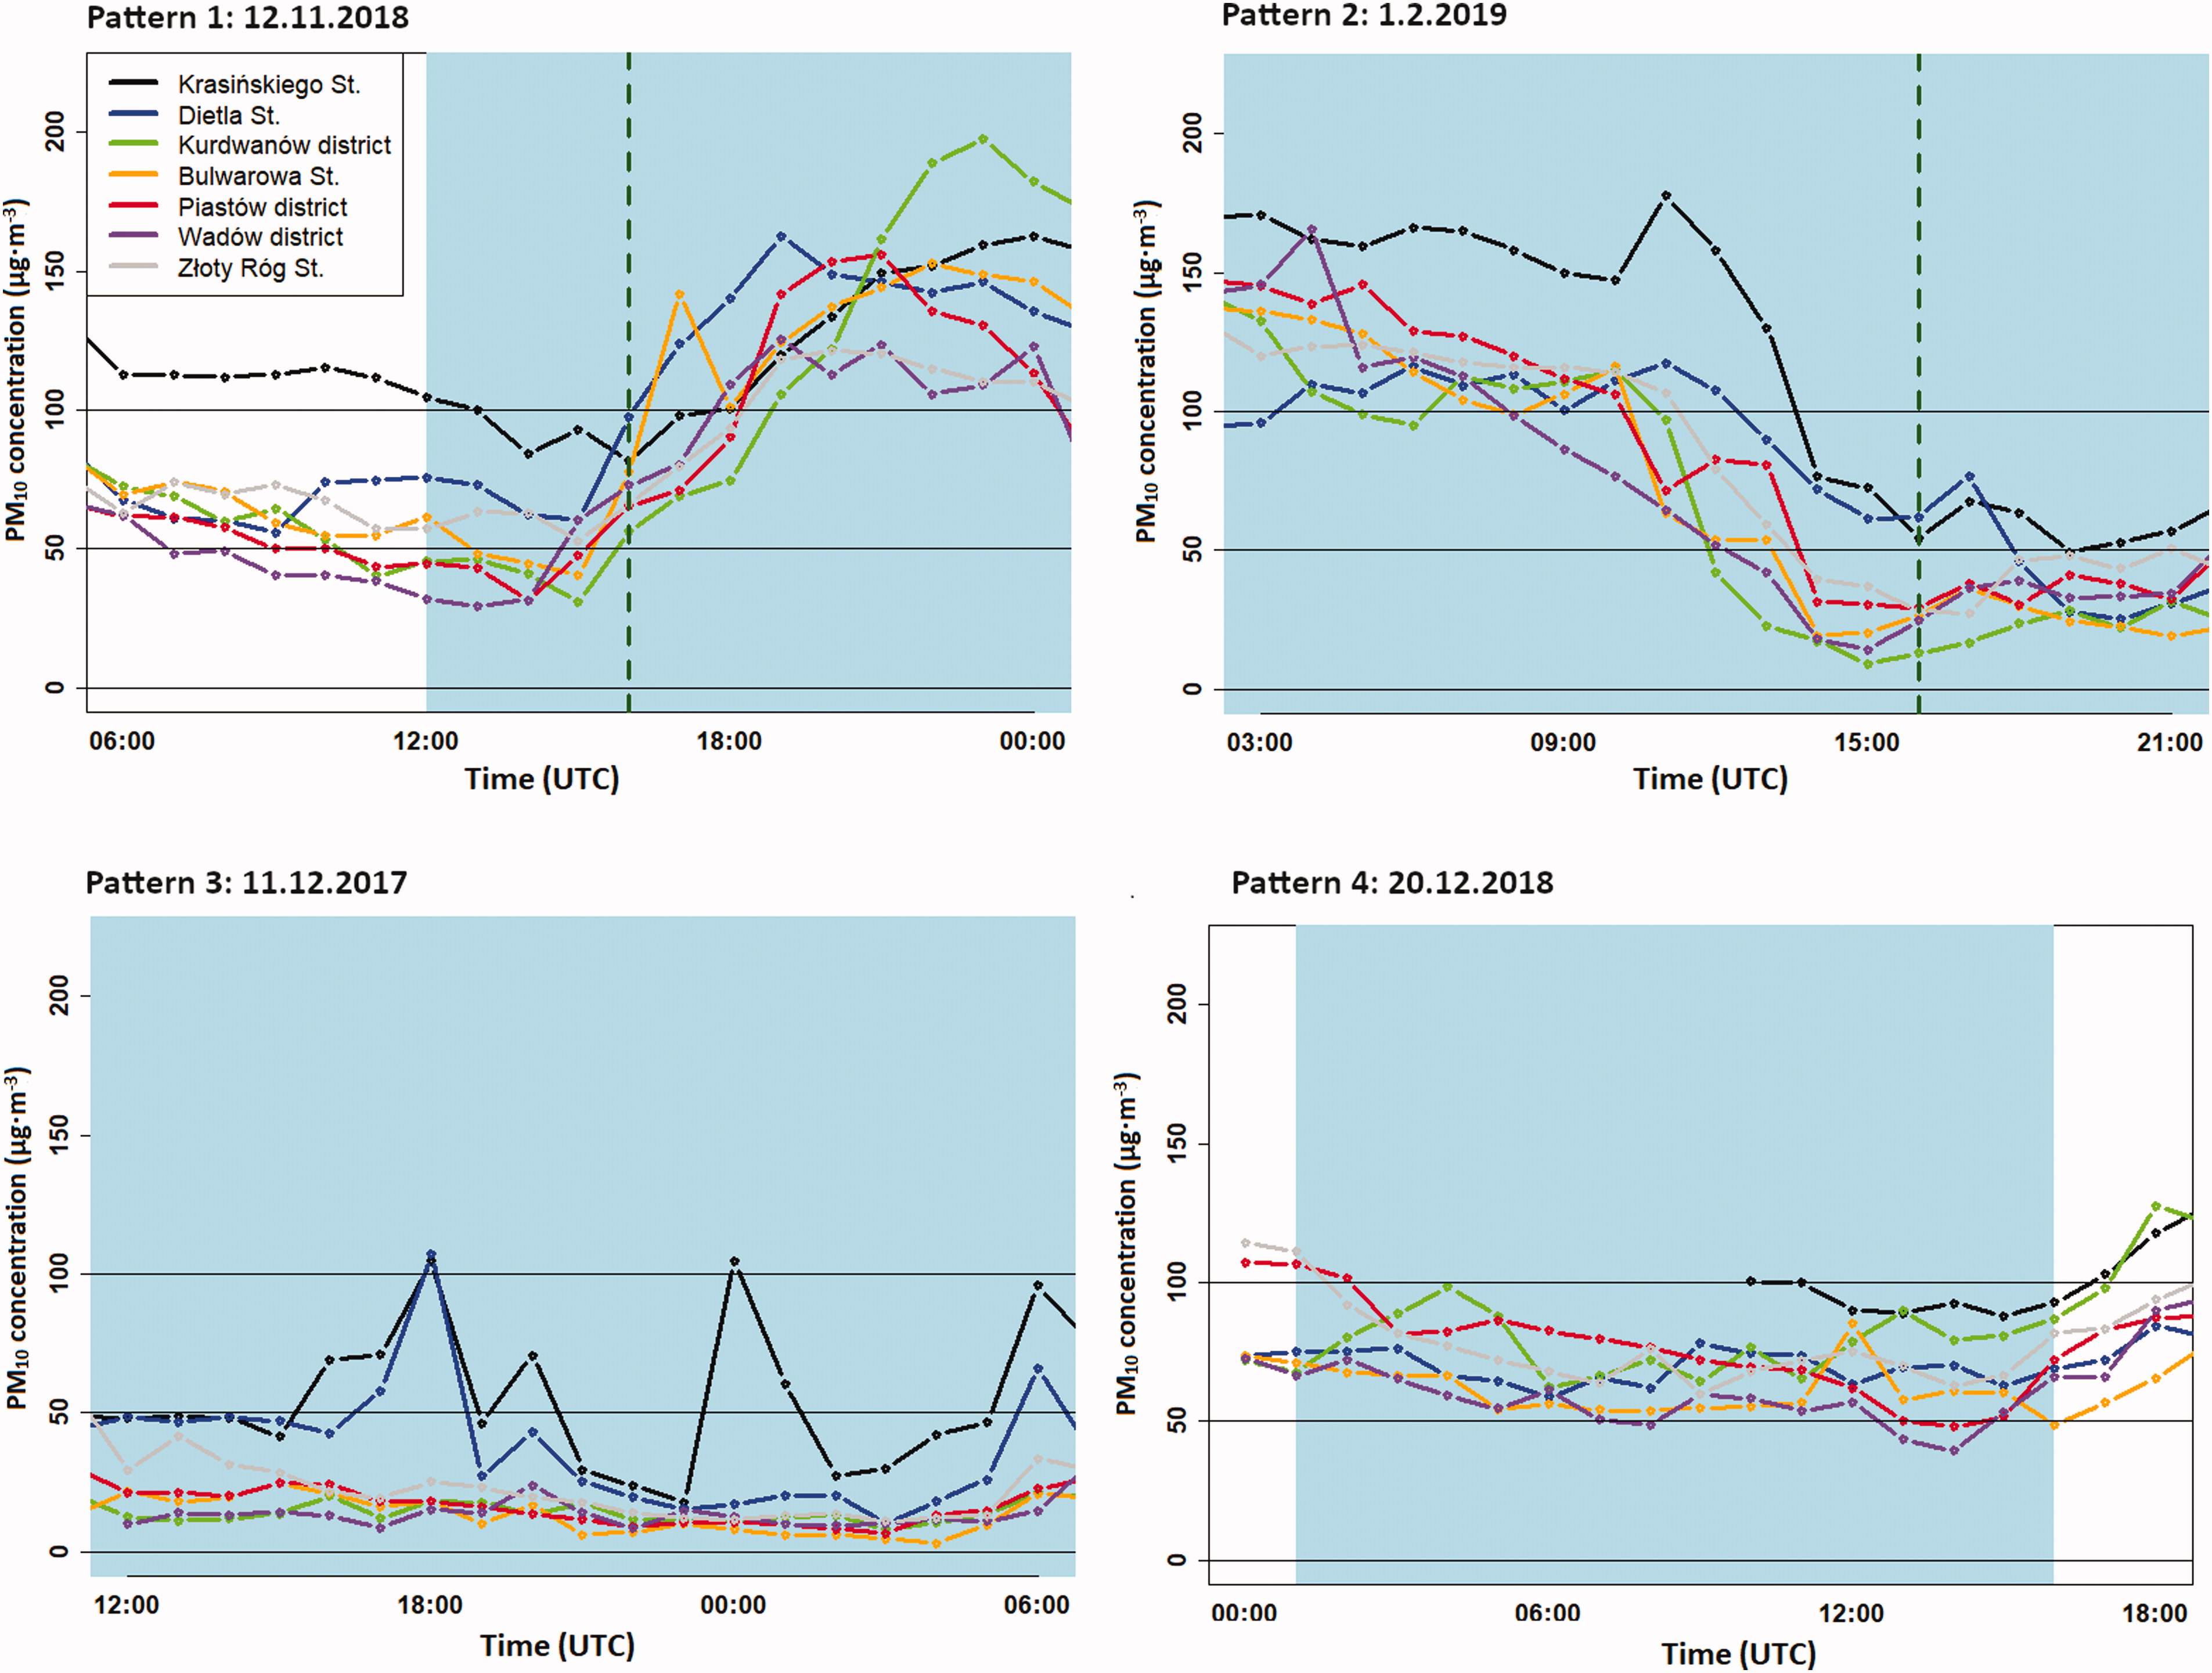
Fig. 2.
Examples of the four spatial-temporal patterns of PM10 concentration.
Key: blue background: foehn period; green dashed line: occurrence of altocumulus lenticularis cloud.
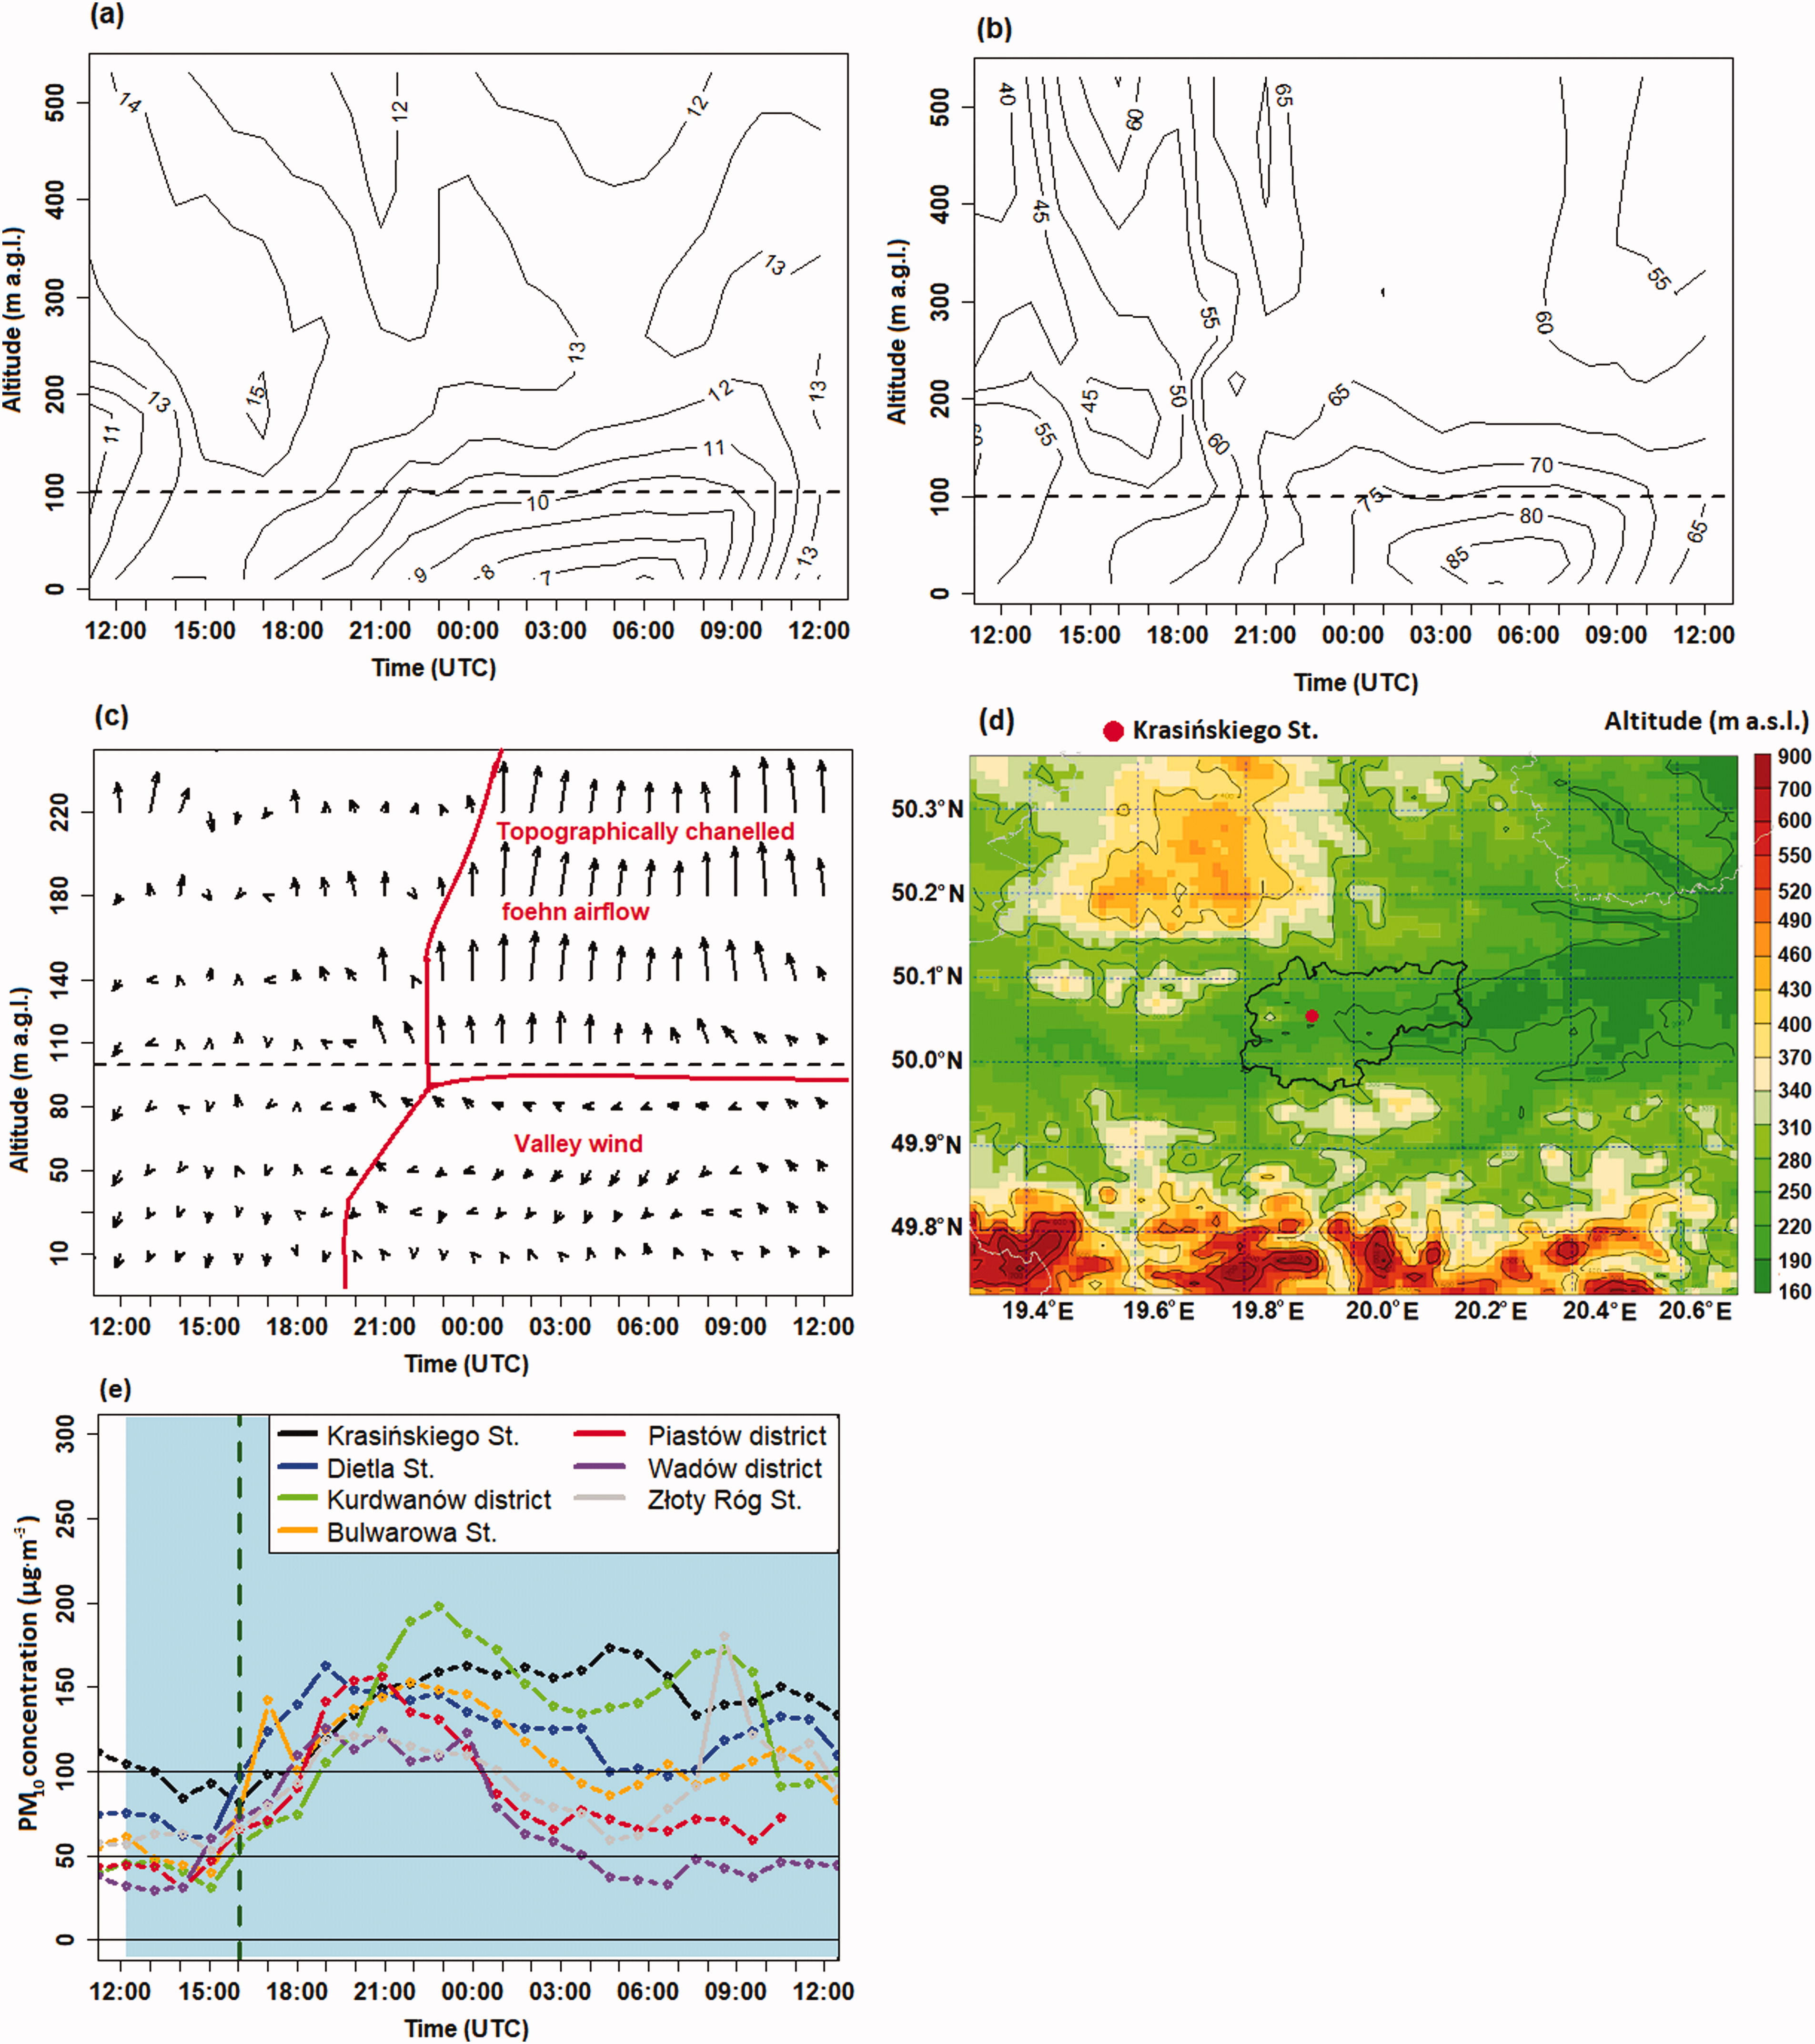
Fig. 3.
Vertical profiles of a. air temperature (°C); b. relative humidity (%); c. wind components for the location of PM10 monitoring station in Krasińskiego St; d. location of station in Krasińskiego St on a topographic map from the AROME model; e. spatial-temporal patterns of PM10 concentration on 12/13.11.2018.
Key: horizontal dashed black line for Fig. 3a-c: the Wisła valley height; blue background for Fig. 3e: foehn period; green dashed line for Fig. 3e: occurrence of altocumulus lenticularis cloud.
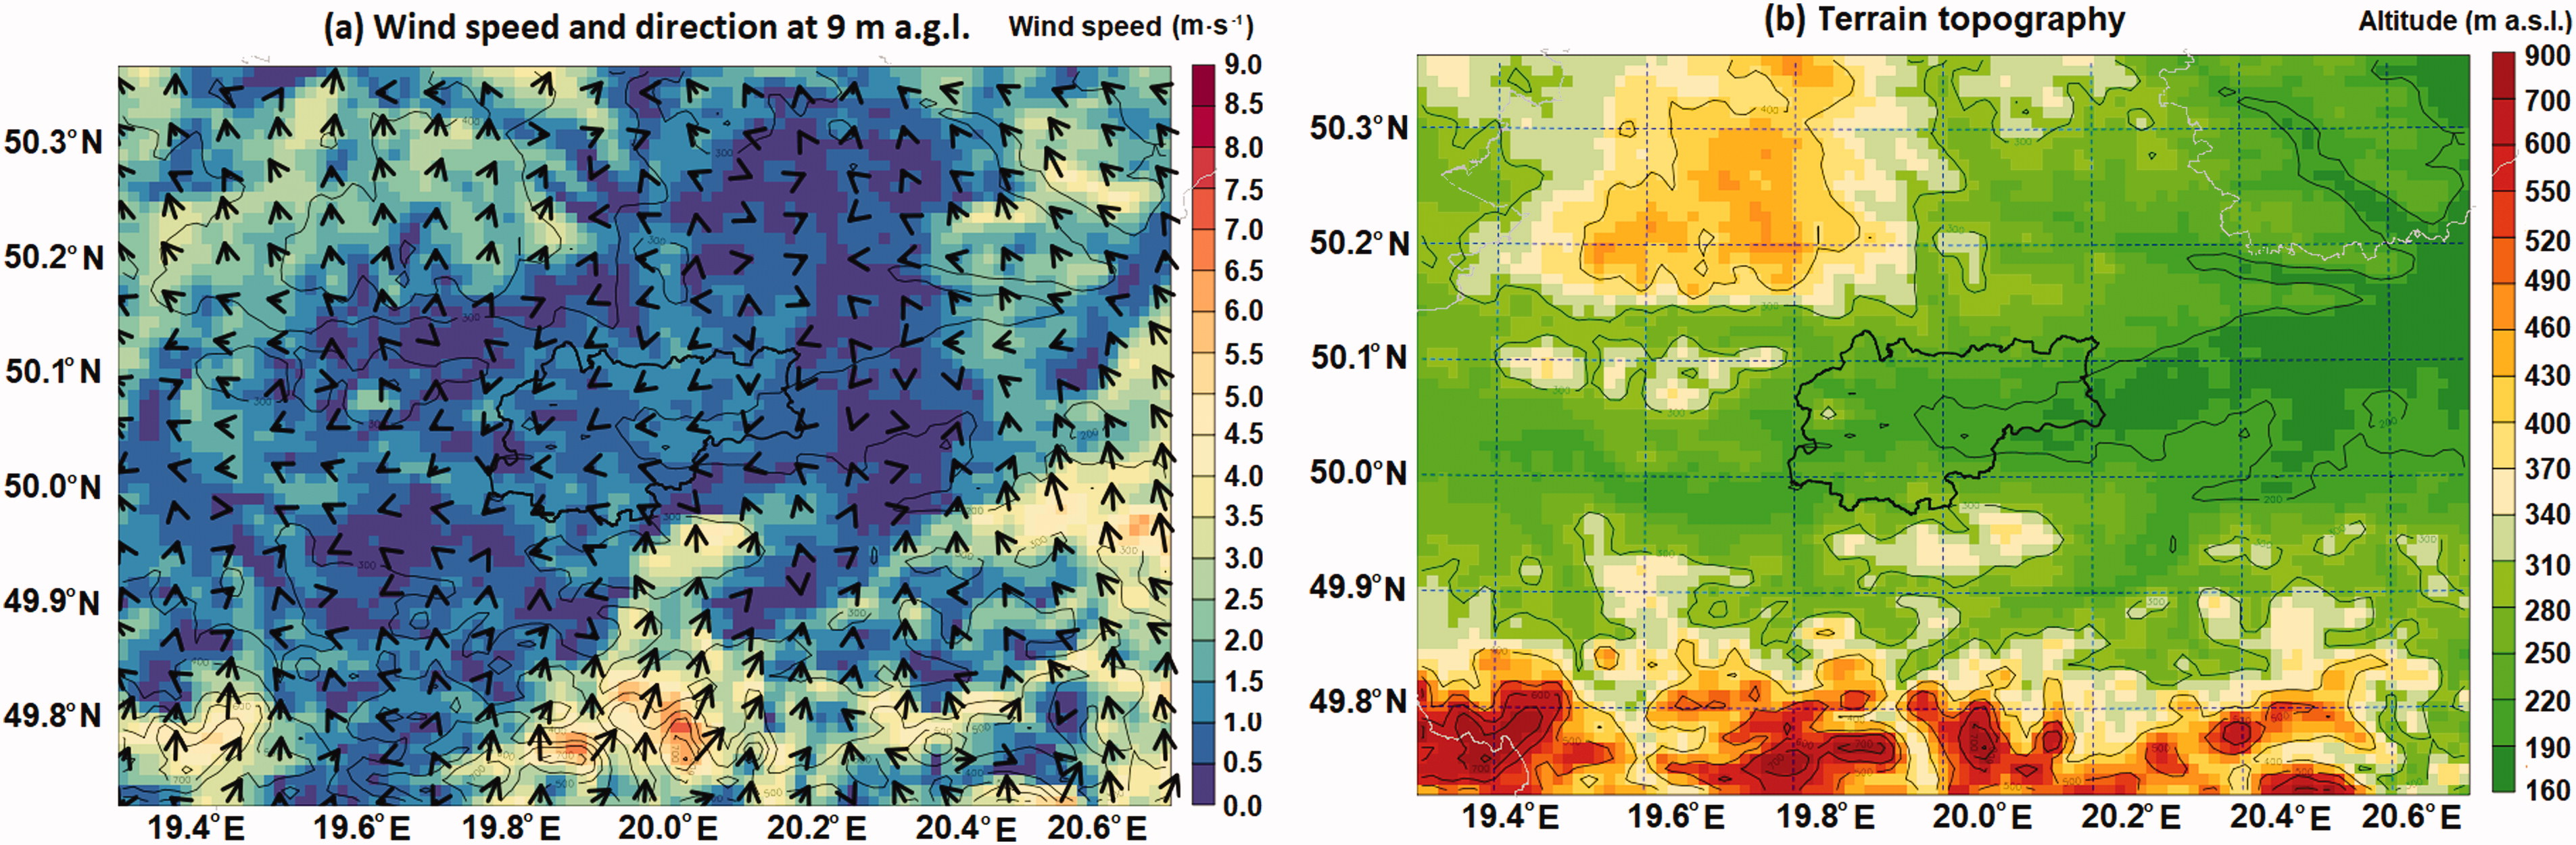
Fig. 4.
Predicted wind speed and wind direction at 9 m a.g.l. from the AROME model at 19 UTC (a) (12.11.2018), and topographic map of terrain (b).
Key: thin lines: elevation; thick line: administrative borders of Kraków.
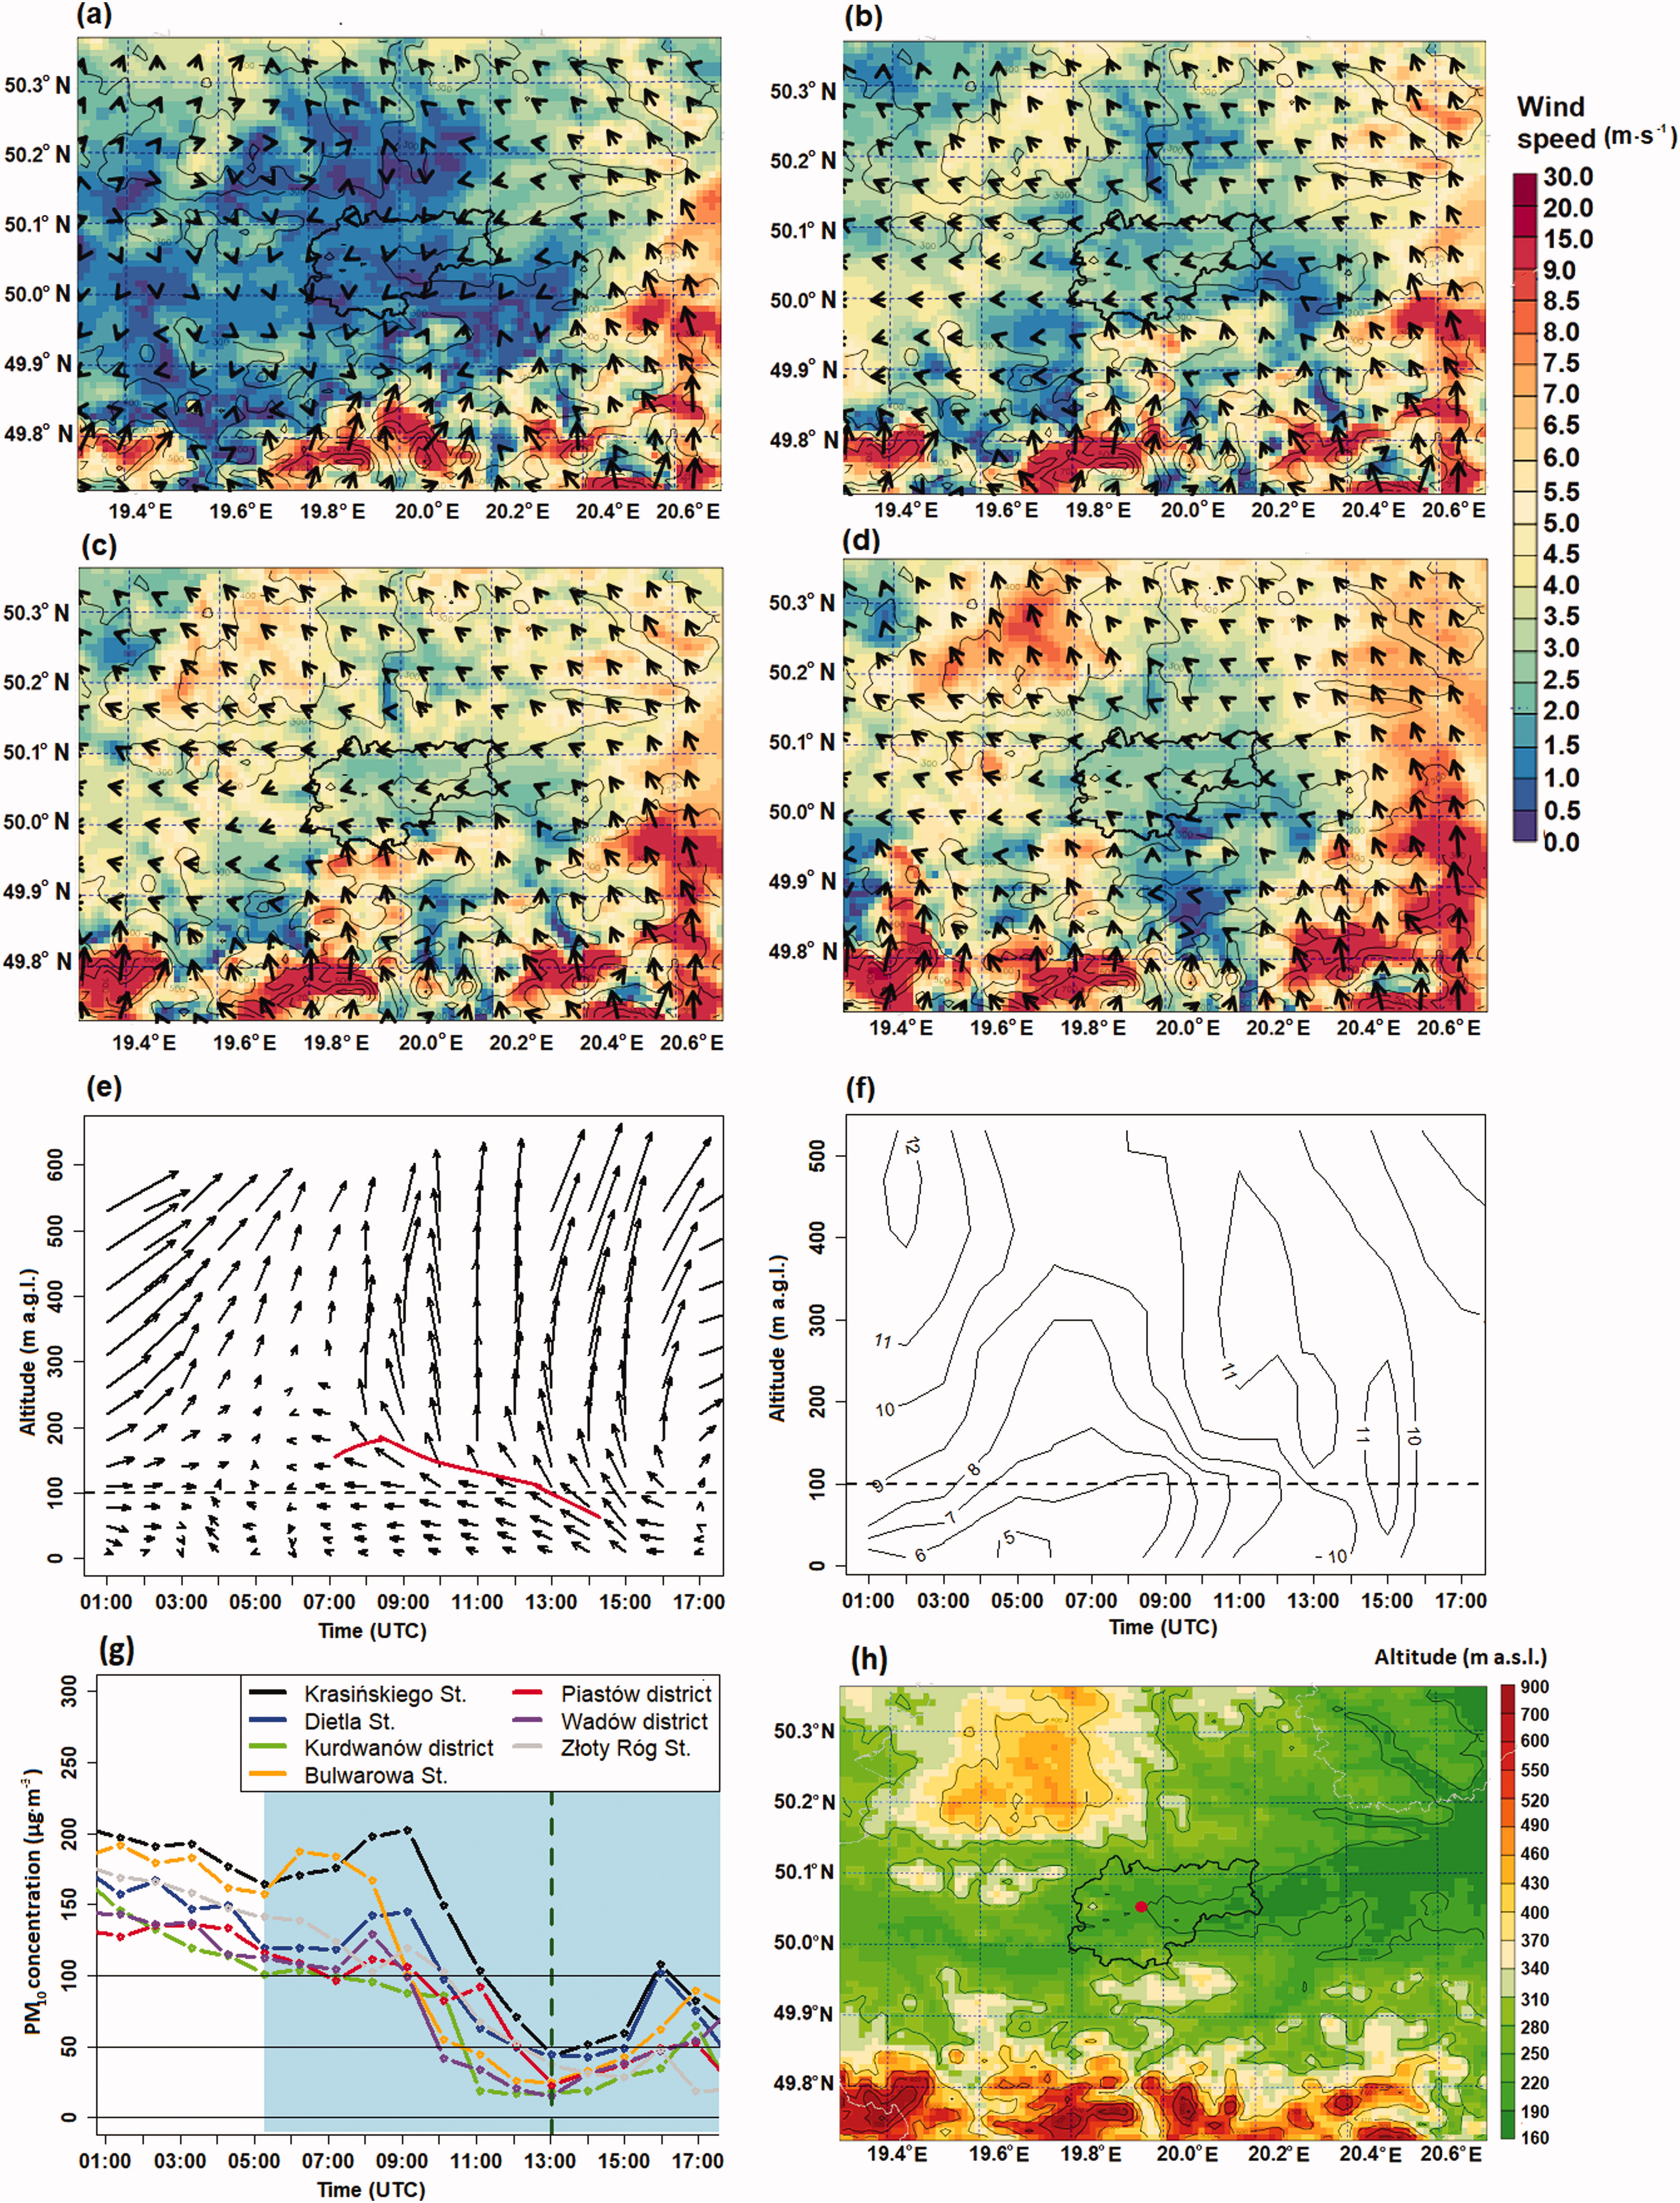
Fig. 5.
Spatial patterns of wind speed and direction at 50 m a.g.l. at 6 UTC (a), 8 UTC (b) 9UTC (c), and 11 UTC (d) in Kraków and nearby, and changes of wind components (e) and air temperature (°C) (f) in vertical profiles for the location of PM10 monitoring station in Krasińskiego St, from the AROME model on 25.11.2017, spatial-temporal patterns of PM10 concentrations on 25.11.2017 (g), and the location of the station in Krasińskiego St on a topographic map from the AROME model (h).
Key: black dashed line in Fig. 5e-f: Wisła valley height; red line in Fig. 5e: topographically channeled foehn flow in the valley; blue background in Fig. 5g: foehn period; green dashed line in Fig. 5g: occurrence of altocumulus lenticularis cloud.
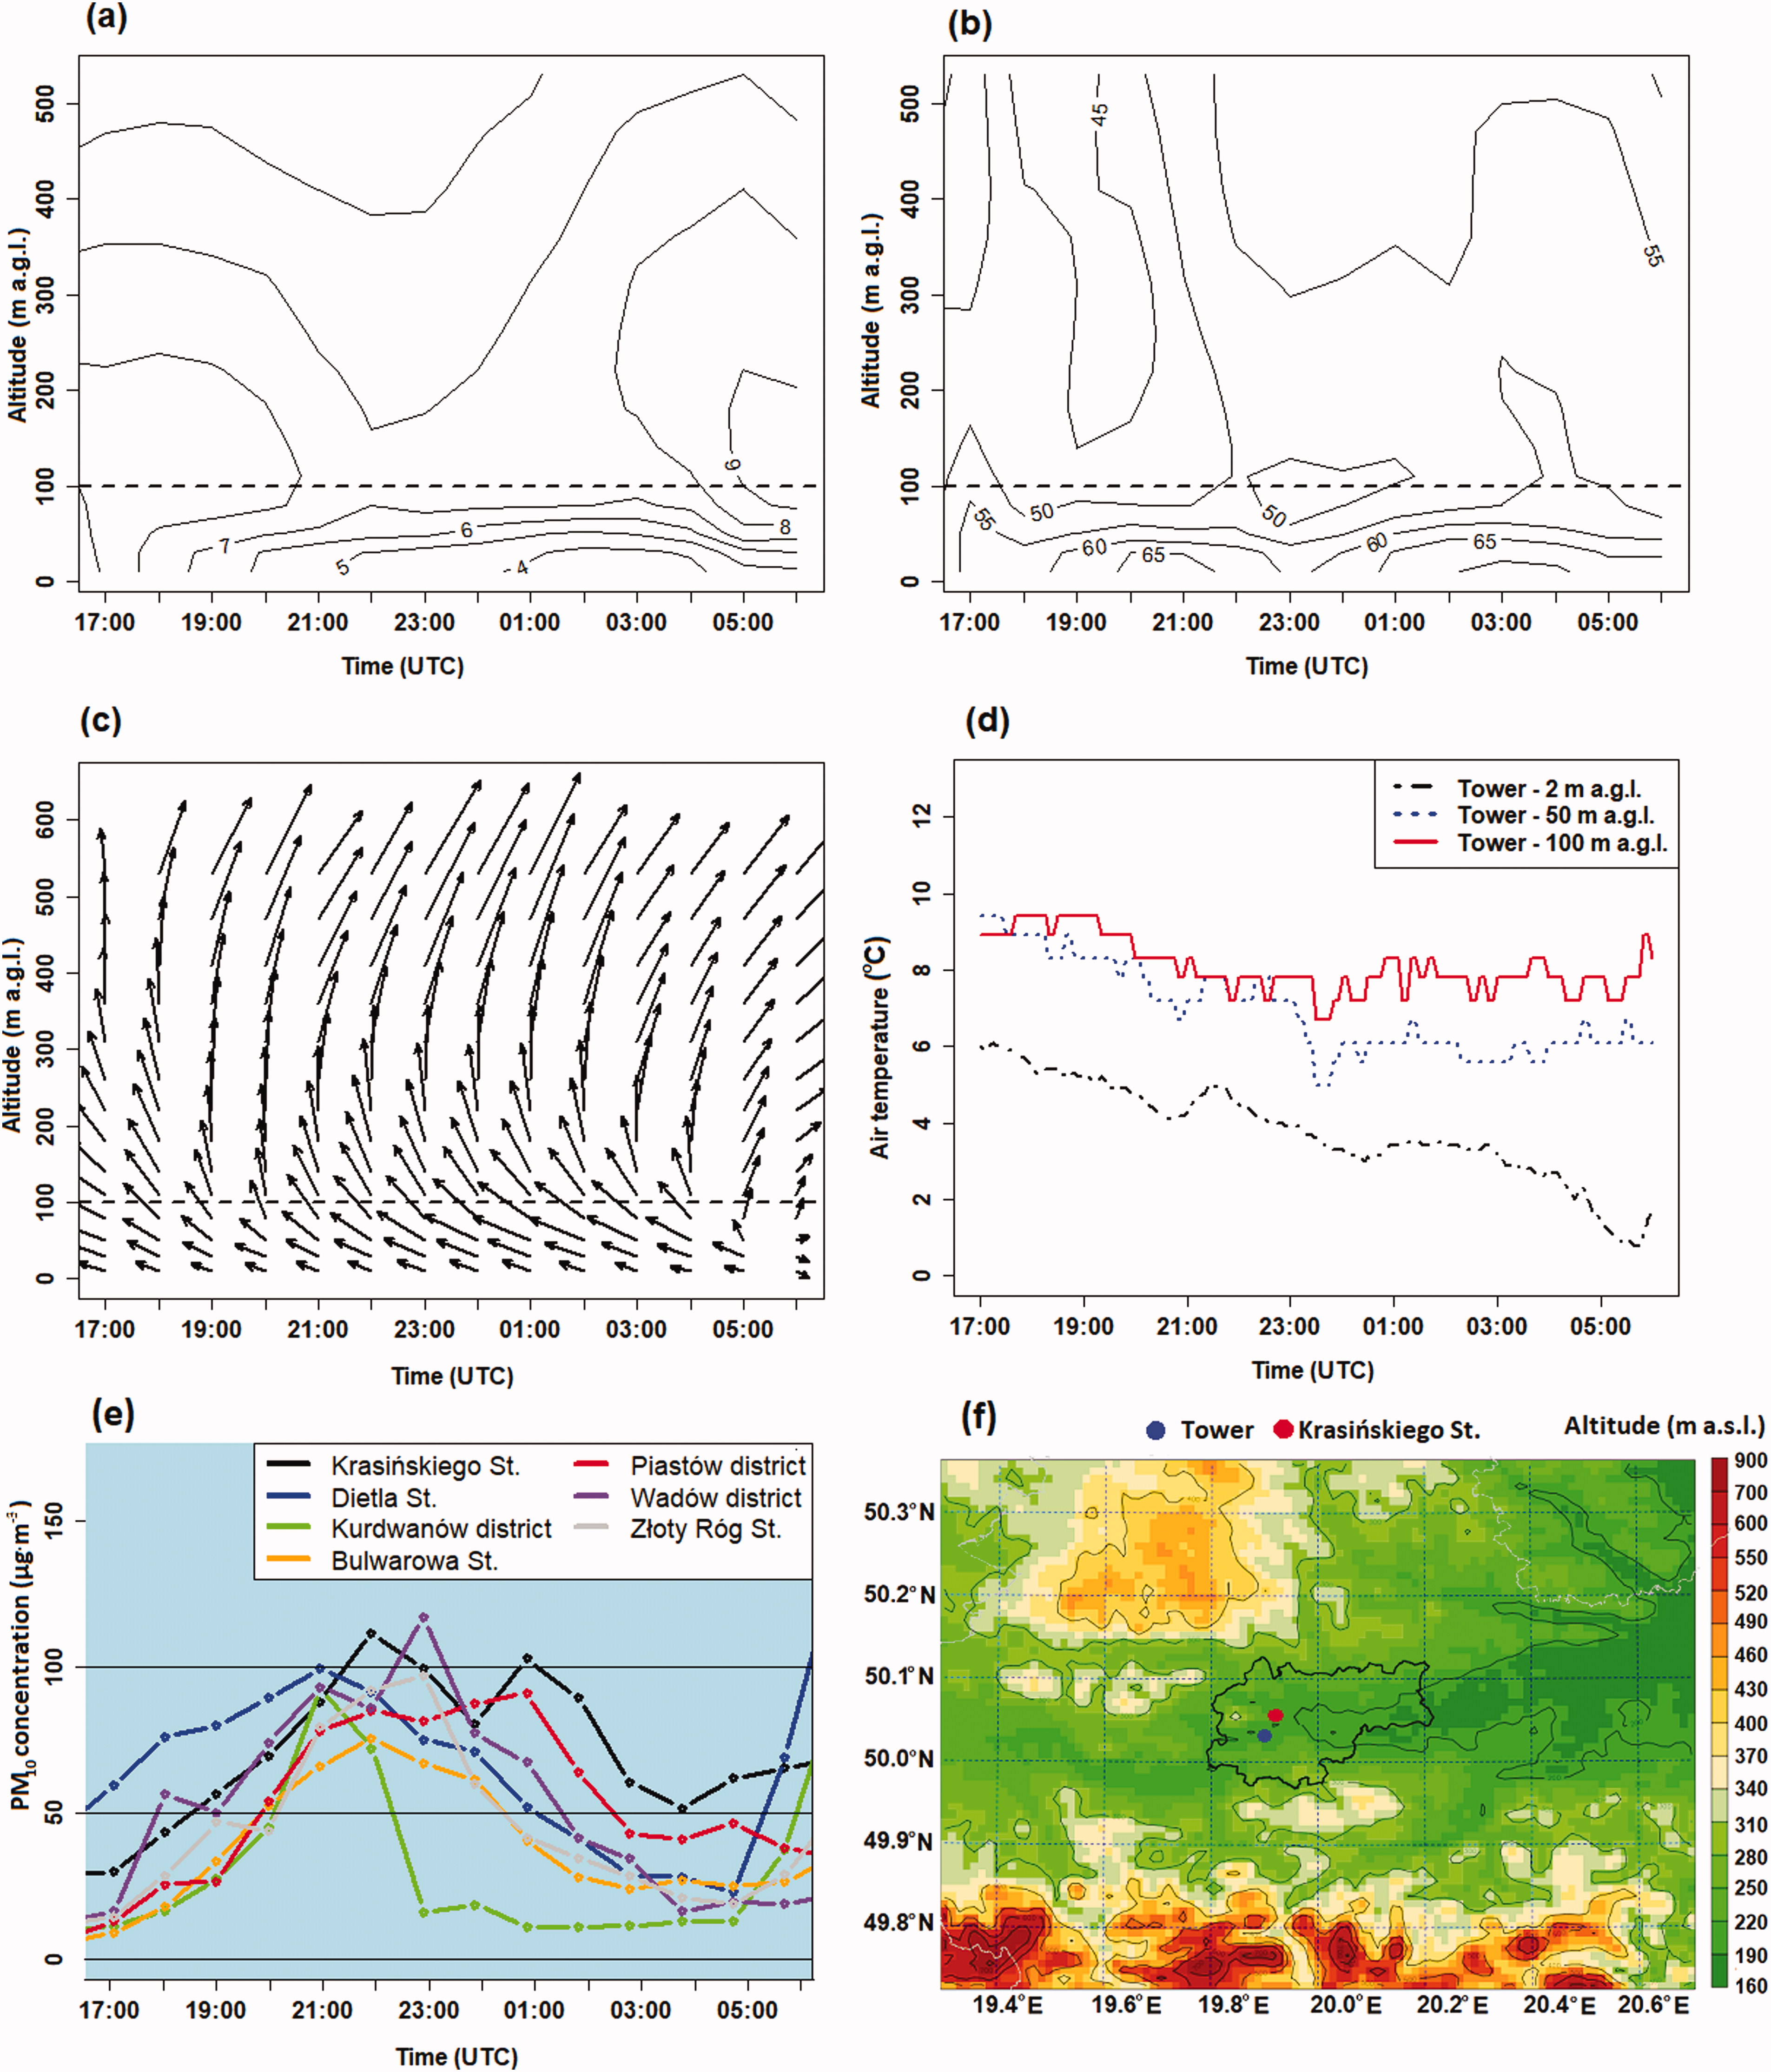
Fig. 6.
Vertical profiles of a. air temperature (°C), b. relative humidity (%), and c. wind components for the PM10 monitoring station in Krasińskiego St, from the AROME model on 6/7.3.2019, and d. air temperature measurements from the telecommunication mast at three altitudes. Spatial-temporal patterns of PM10 concentration on 6/7.3.2019 (e). Location of the station in Krasińskiego St and the telecommunication mast (marked Tower) on a topographic map, from the AROME model (f).
Key: dashed line in Fig 6a-c: Wisła valley height; blue background in Fig. 6e: foehn period.
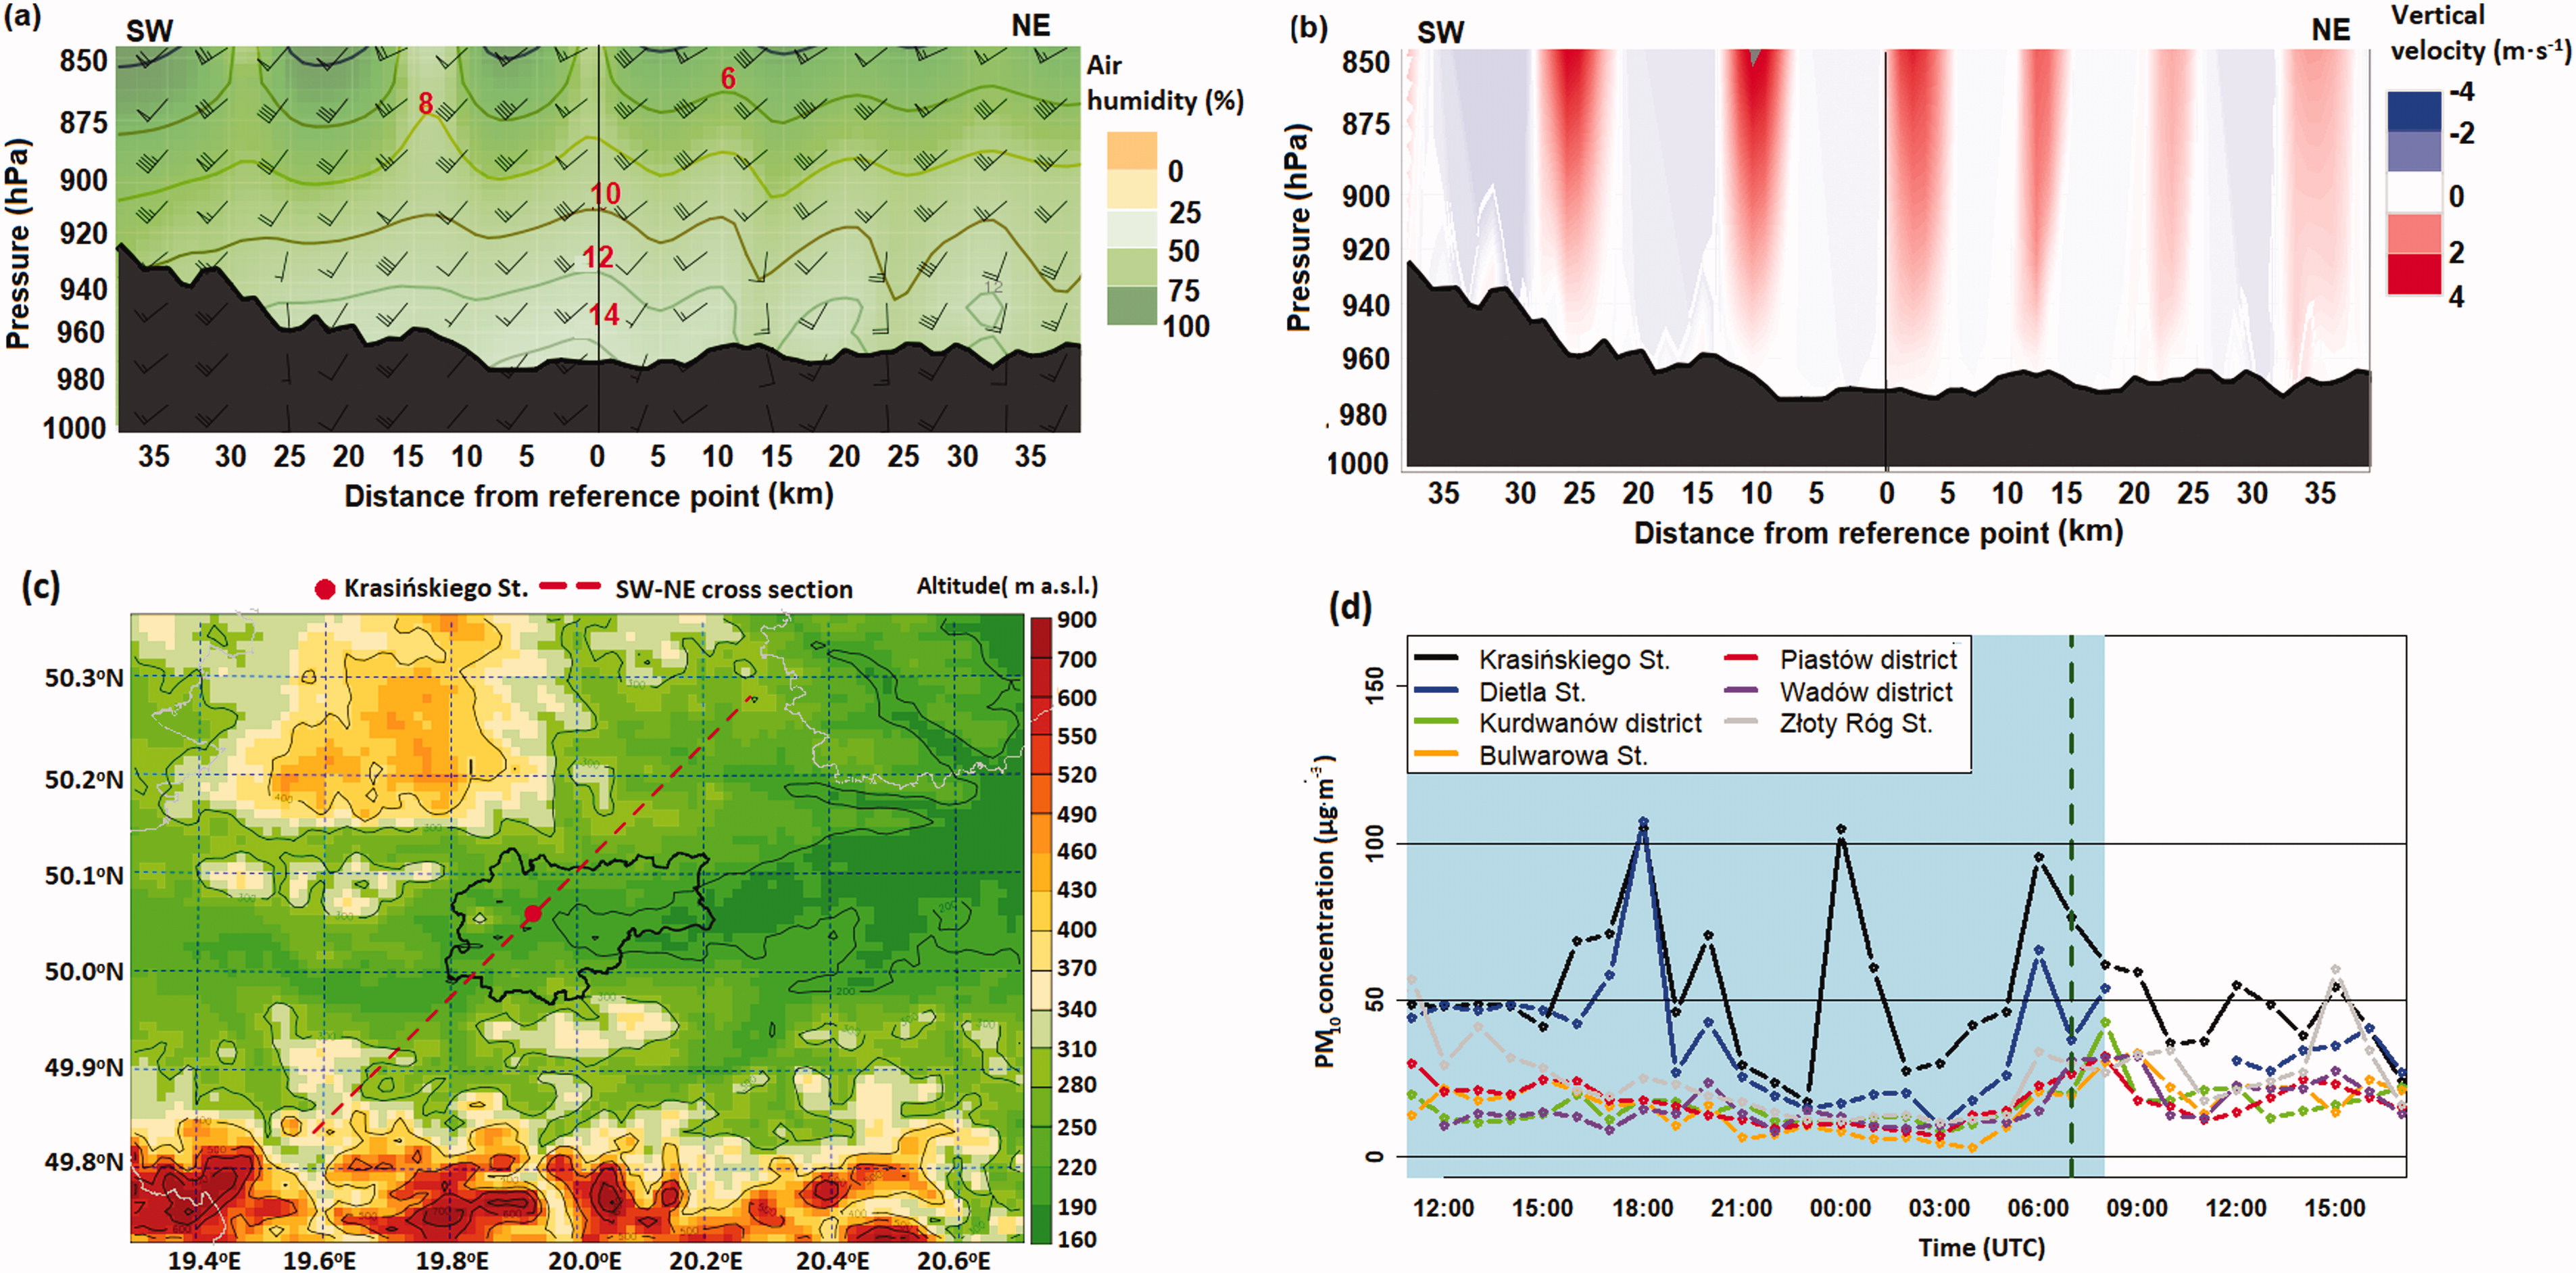
Fig. 7.
Spatial pattern of a. air temperature (contour lines), relative humidity (background) and wind speed (in knots) and direction (graphical symbols) in the SW-NE cross section through Kraków and nearby, and b. vertical velocity at 7 UTC on 12.12.2017. Location of the station in Krasińskiego St (reference point at Fig. 7a-b) and the extent of the cross section presented on Fig. 7a-b on a topographic map, from the AROME model (c). Spatial-temporal patterns of PM10 concentrations on 11/12.12.2017 (d).
Key: reference point with distance 0: Krasińskiego St; the red and blue colour scales at cross section of vertical velocity in Fig. 7b indicates upward and downward movements, respectively; blue background in Fig. 7d: foehn period; green dashed line in Fig. 7d: occurrence of altocumulus lenticularis cloud.
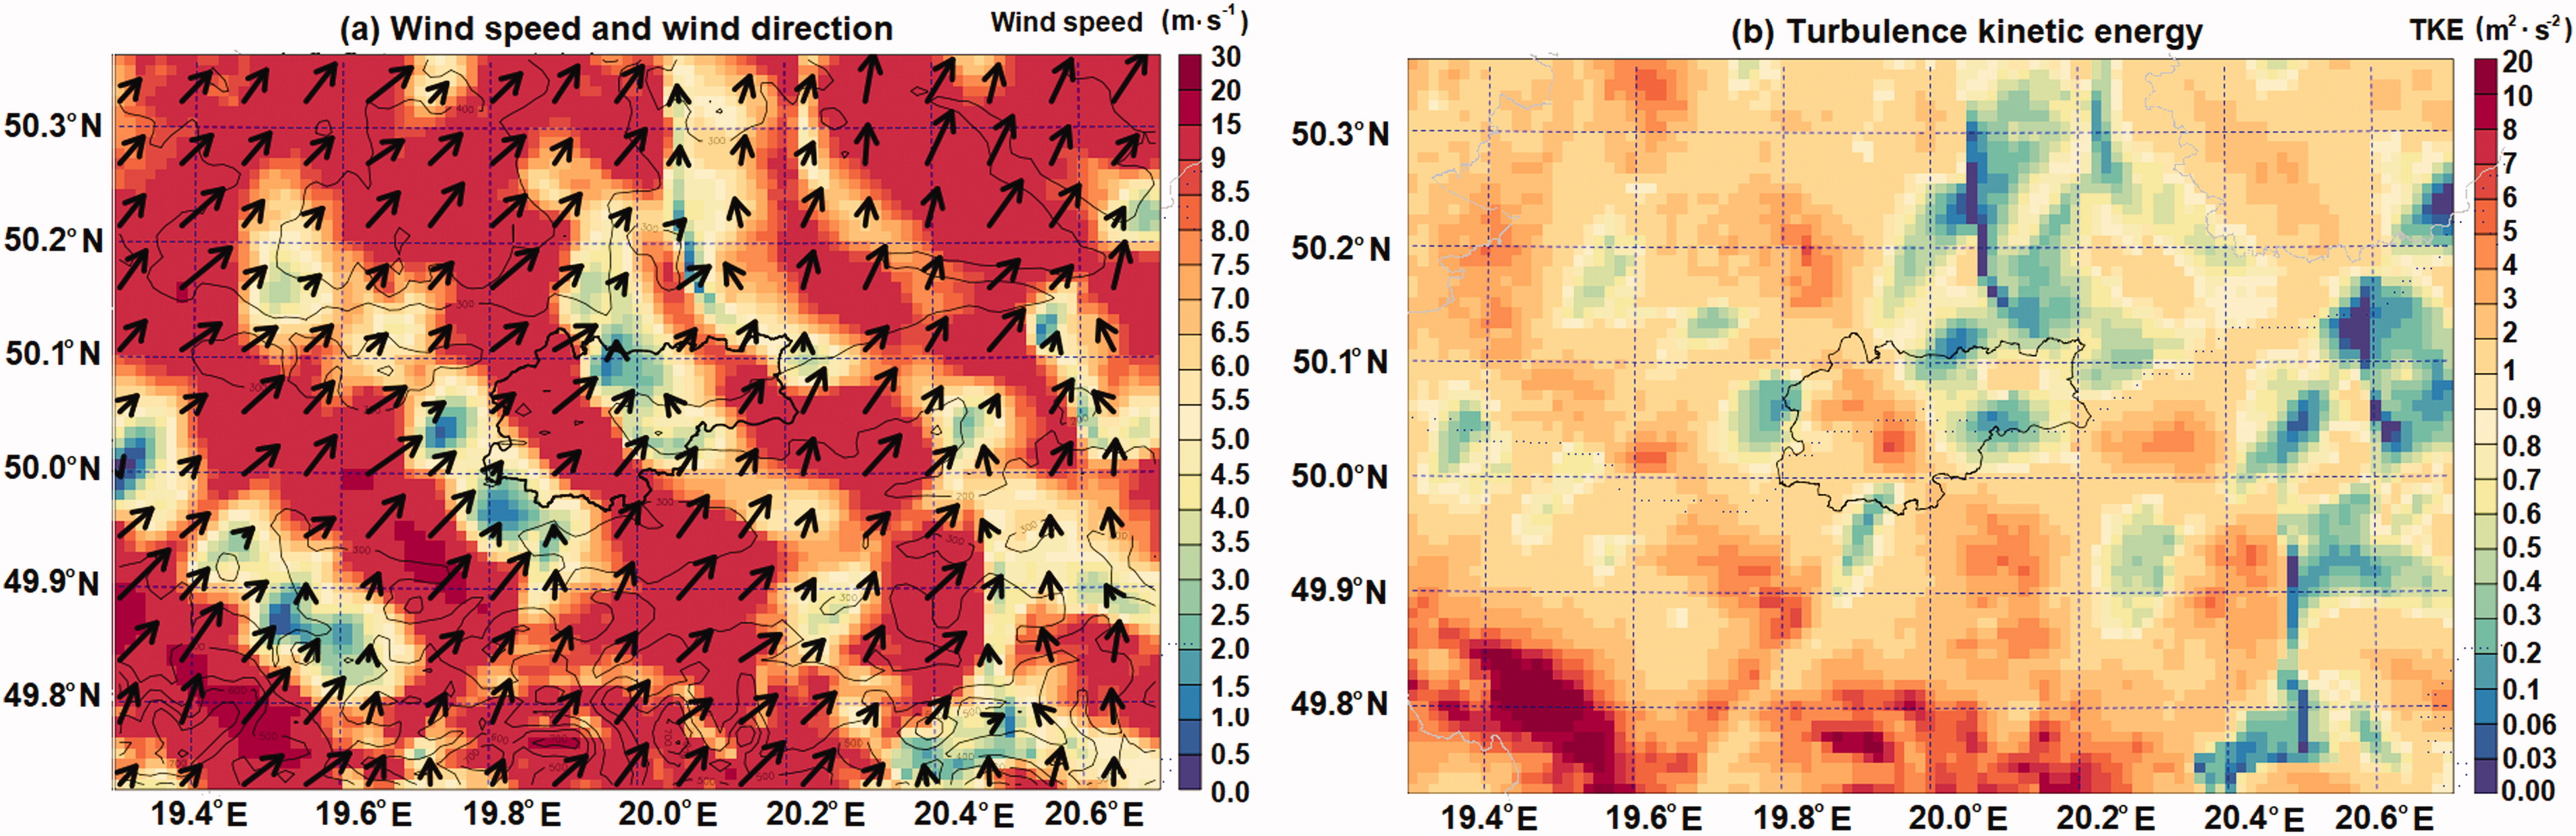
Fig. 8.
Spatial patterns of a. wind components, and b. turbulent kinetic energy (TKE) at 30 m a.g.l. at 7 UTC on 12.12.2017.
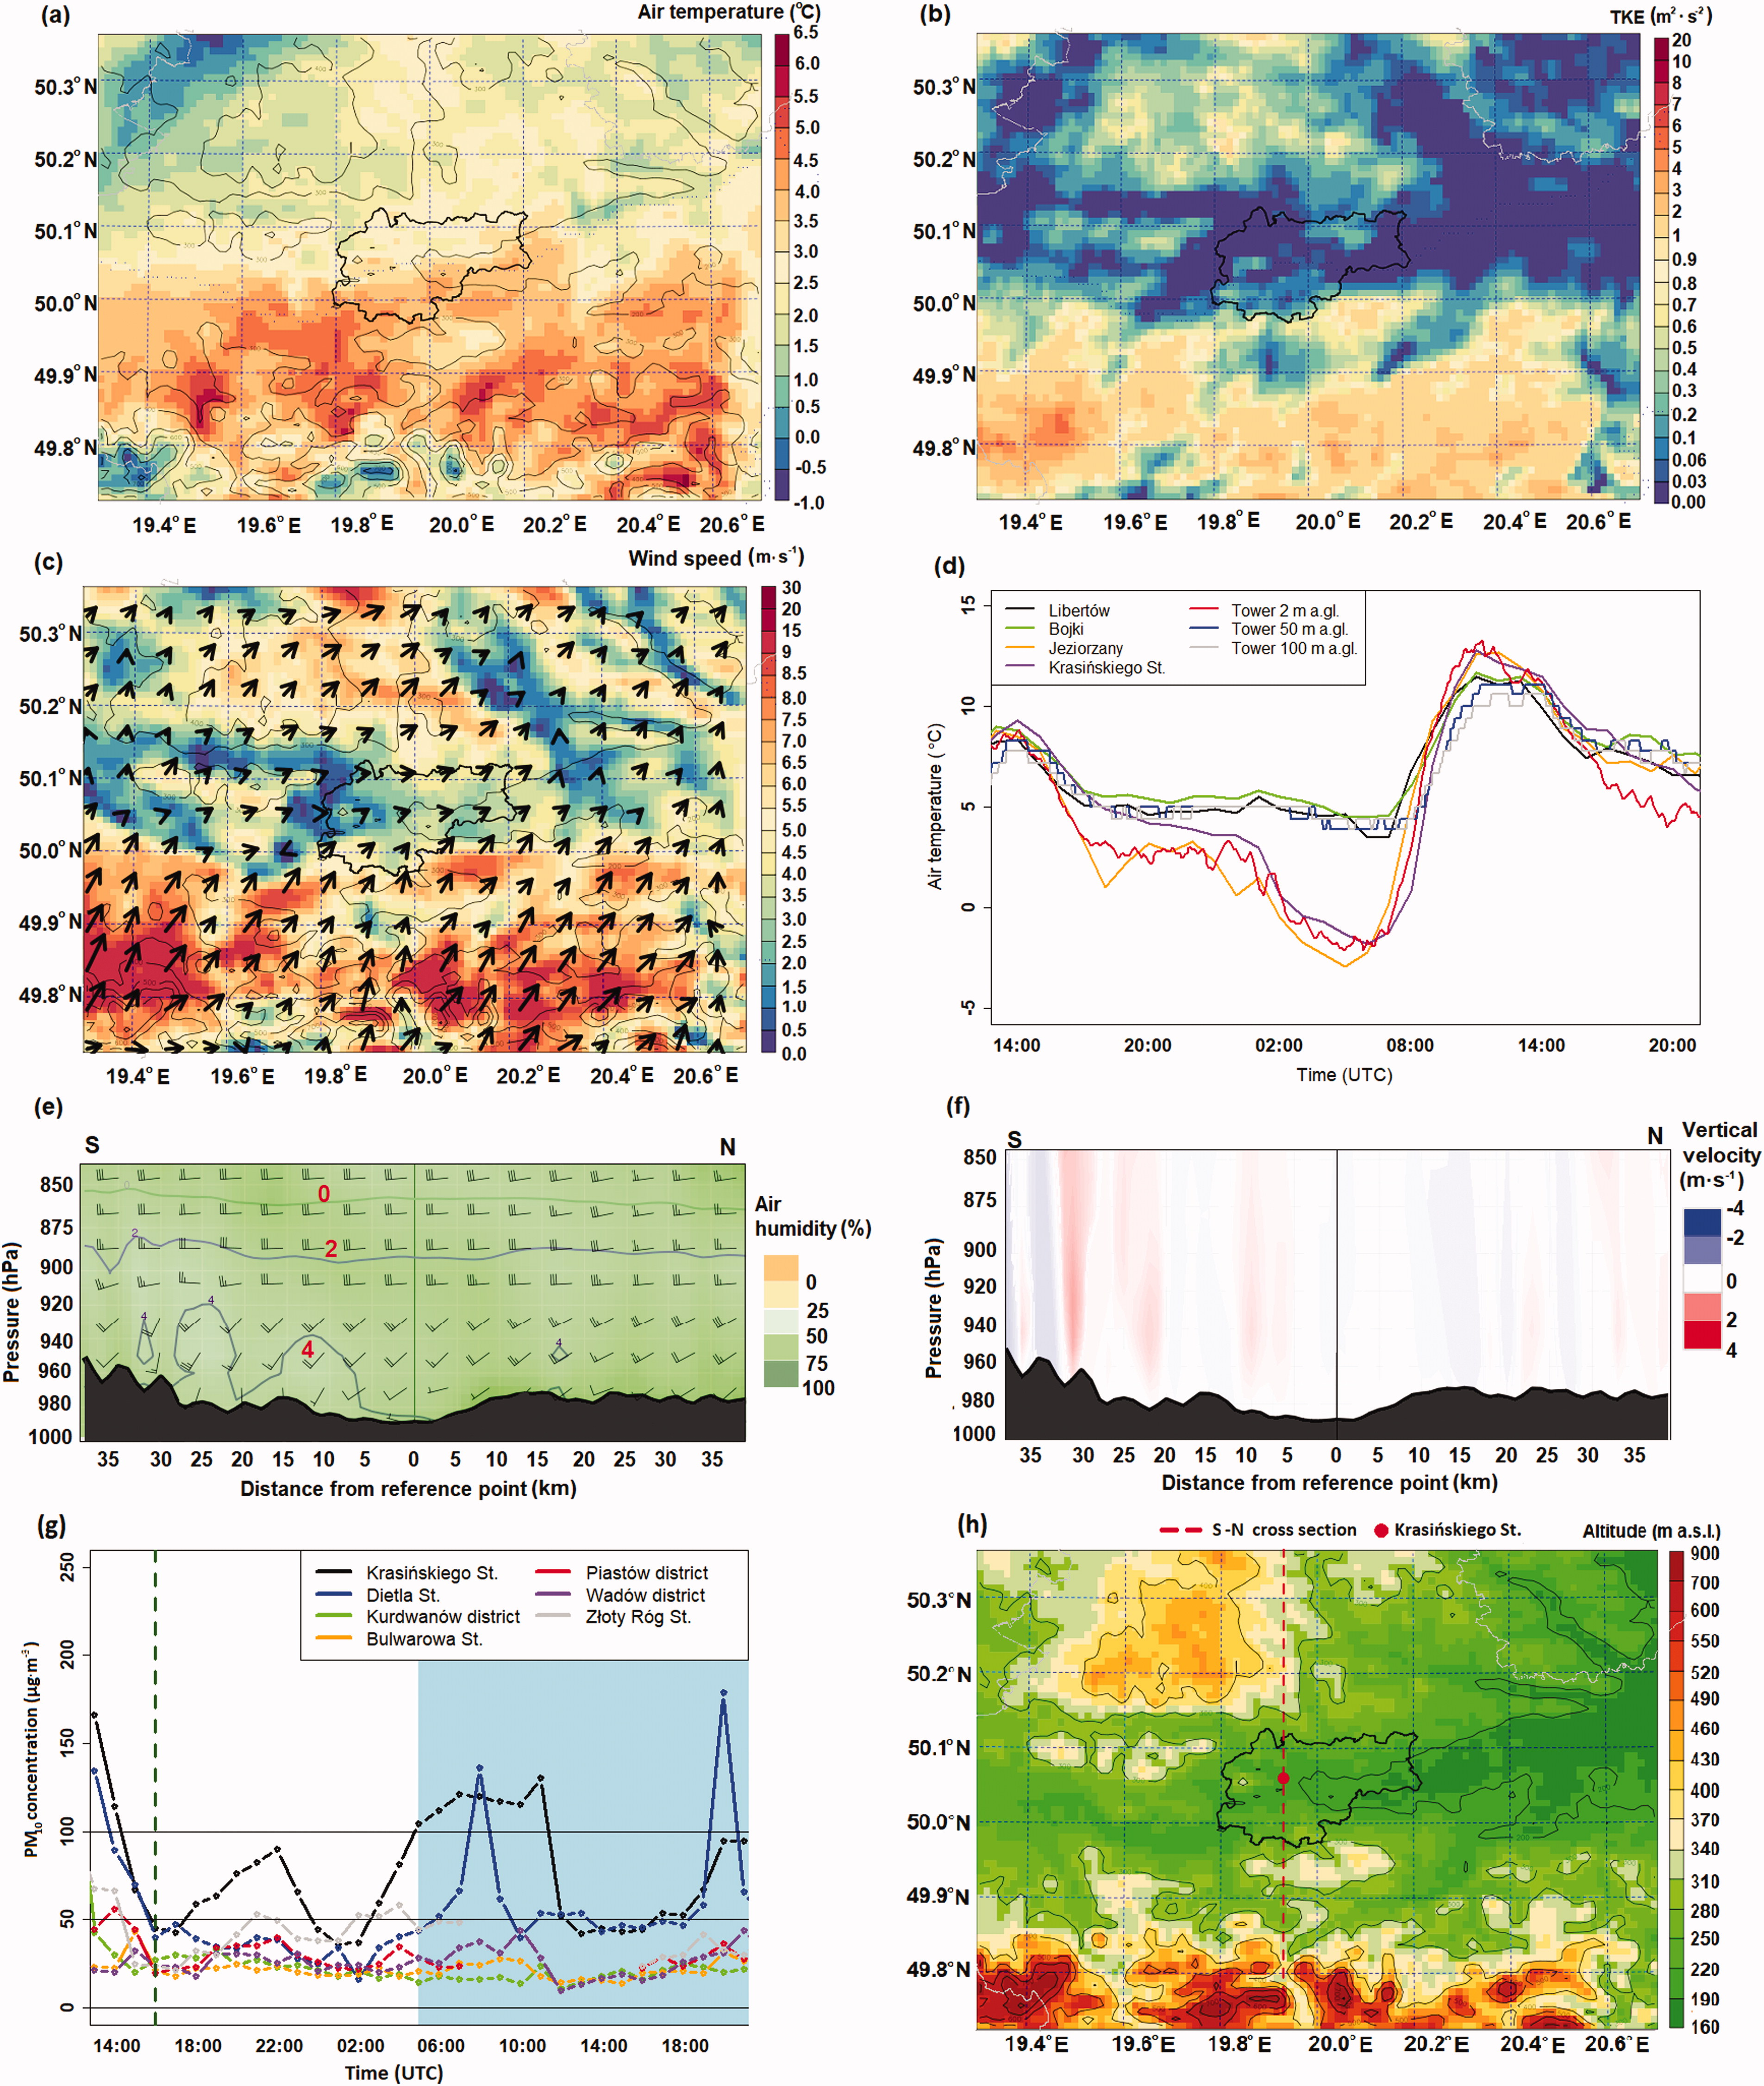
Fig. 9.
Spatial pattern of a. air temperature; b. turbulent kinetic energy parameter (TKE), and c. wind components at altitude 30 m a.g.l. at 4 UTC (10.02.2019), in Kraków and nearby; d. air temperature measurements from ground stations on 9-10.02.2019; S-N cross sections of e. air temperature (contour lines), relative humidity (background), and wind speed (in knots) and direction (graphical symbols), and f. vertical velocity, at 4 UTC (10.02.2019). Spatial-temporal patterns of PM10 concentrations on 9/10.02.2019 (g). Location of station in Krasińskiego St (reference point at Fig. 9e-f) and cross section S-N presented at Fig. 9e-f on a topographic map, from the AROME model (h).
Key: reference point with distance 0 in Fig. 9e and f: Krasińskiego St; the red and blue colour scales at cross section of vertical velocity at Fig. 9f indicates upward and downward movements, respectively; blue background in Fig. 9g: foehn period; green dashed line in Fig. 9g: occurrence of altocumulus lenticularis cloud.
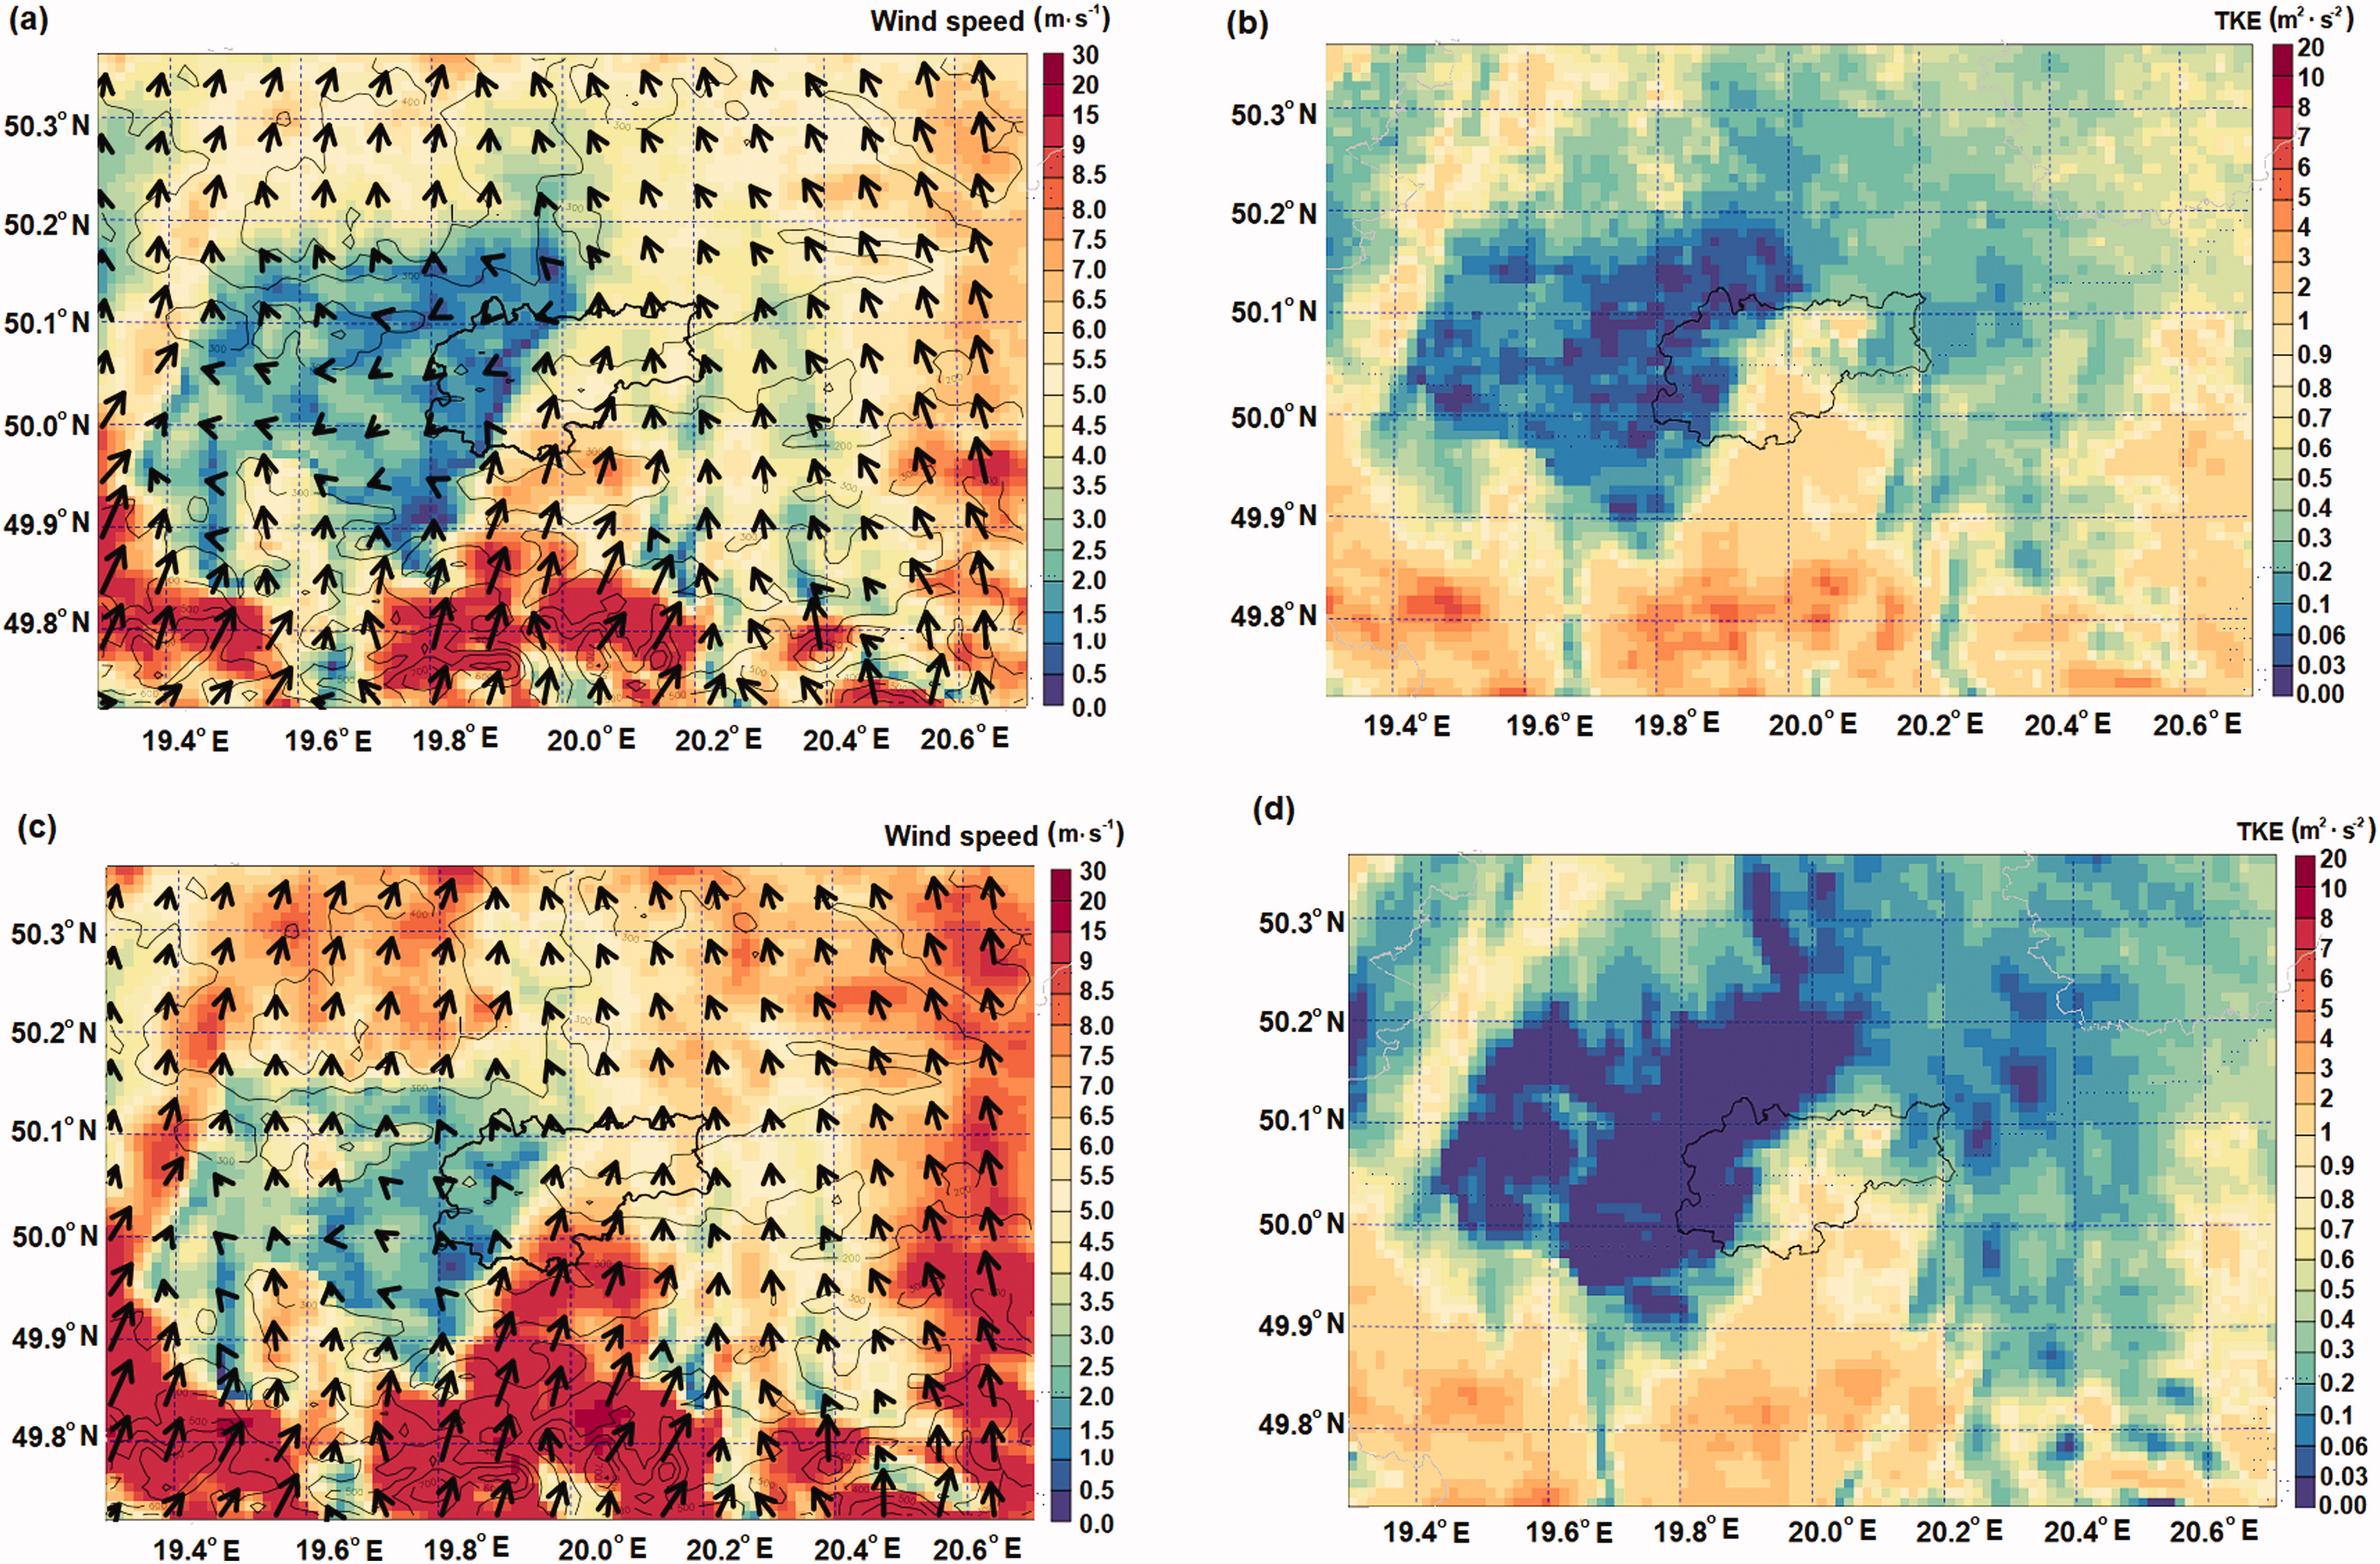
Fig. 10.
Spatial patterns of wind speed and direction a. at 30 m a.g.l. and c. 110 m a.g.l.; turbulent kinetic energy parameter (TKE) at b. 30 m a.g.l. and d. 110 m a.g.l. at 11 UTC on 10.2.2019.
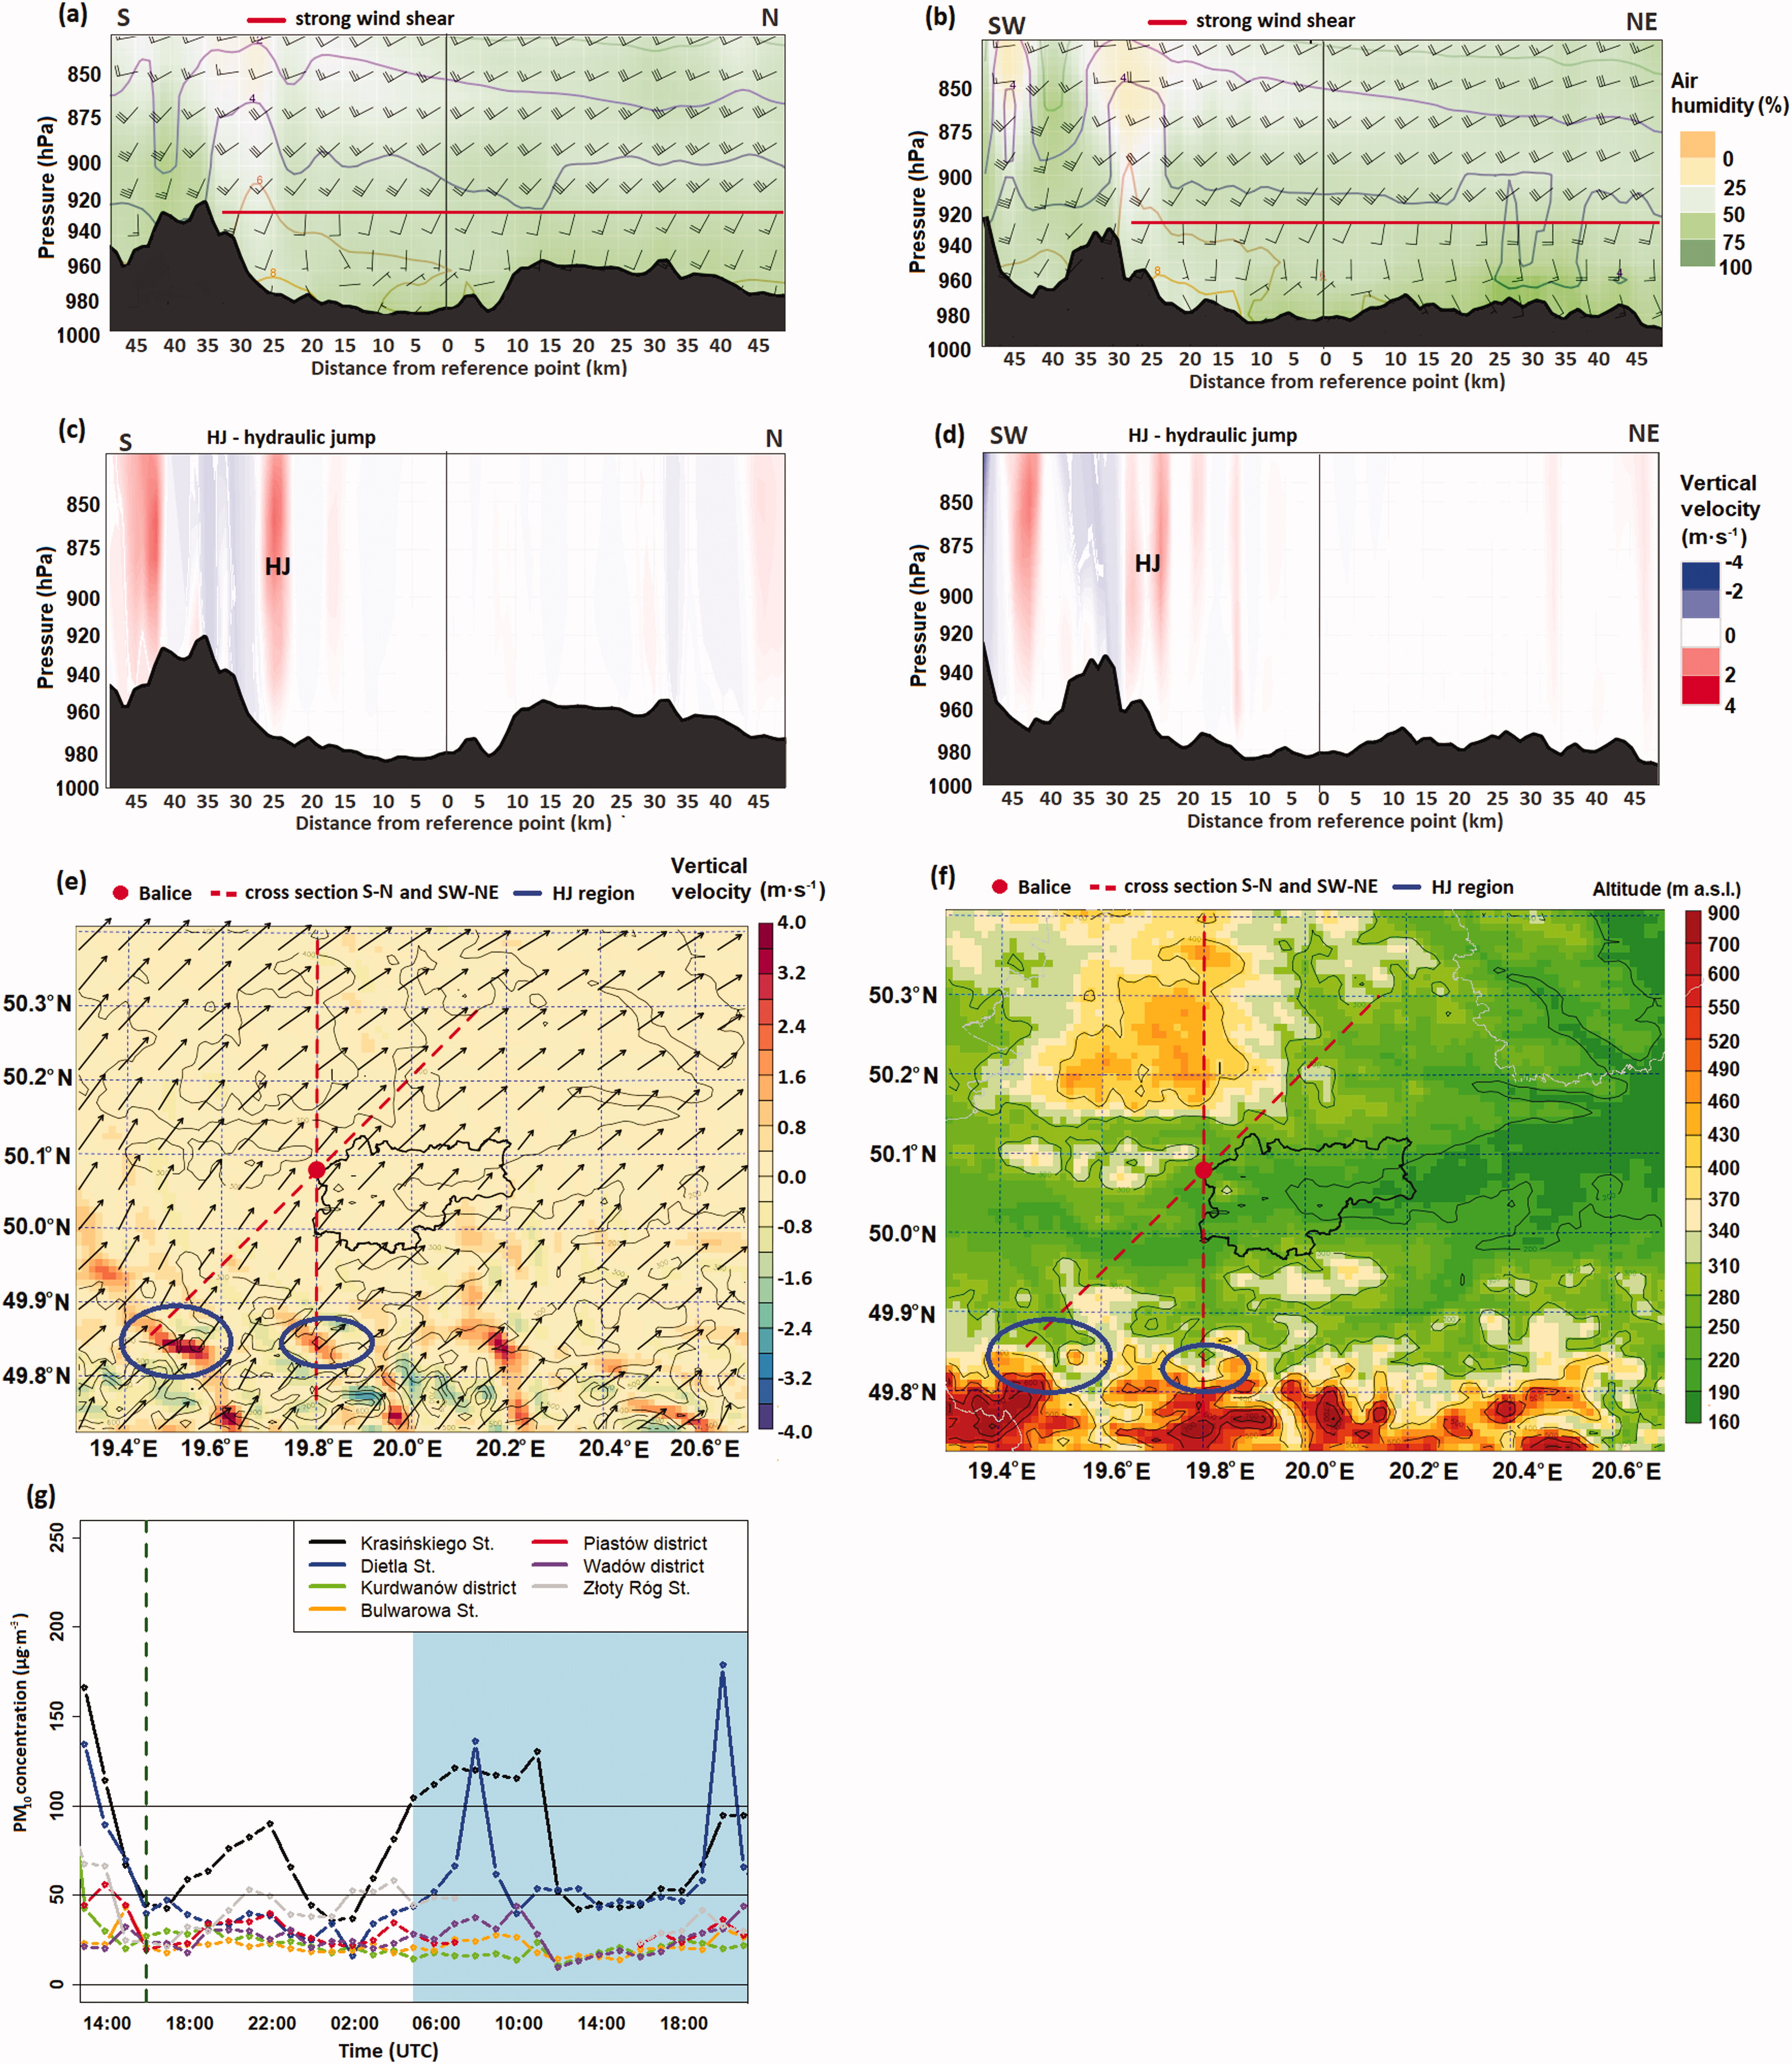
Fig. 11.
Spatial pattern of a. air temperature (contour lines), relative humidity (background) and wind speed (in knots) and direction (graphical symbols) in the S-N cross section through Kraków and nearby, and c. vertical velocity at 11 UTC on 10.02.2019; SW-NE cross section of b. air temperature (contour lines), relative humidity (background) and wind speed (in knots) and direction (graphical symbols), and d. vertical velocity at 11 UTC (10.02.2019). Spatial map of vertical velocity at 800 m a.g.l. with arrows presenting horizontal wind at this altitude (e). Blue circles in Fig. 11e-f present location of hydraulic jumps identified at S-N and SW-NE cross sections (Fig. 11c and d). Location of Balice station (reference point in Fig. 11a-d) and cross sections presented in Fig. 11a-d at topographic map, from the AROME model (f). Spatial-temporal patterns of PM10 concentrations on 10.02.2019 (g).
Key: reference point with distance 0 in Fig. 11a-d: Balice; the red and blue colour scales at cross section of vertical velocity in Fig. 11c-d indicates upward and downward movements, respectively; blue background in Fig. 11g: foehn period.
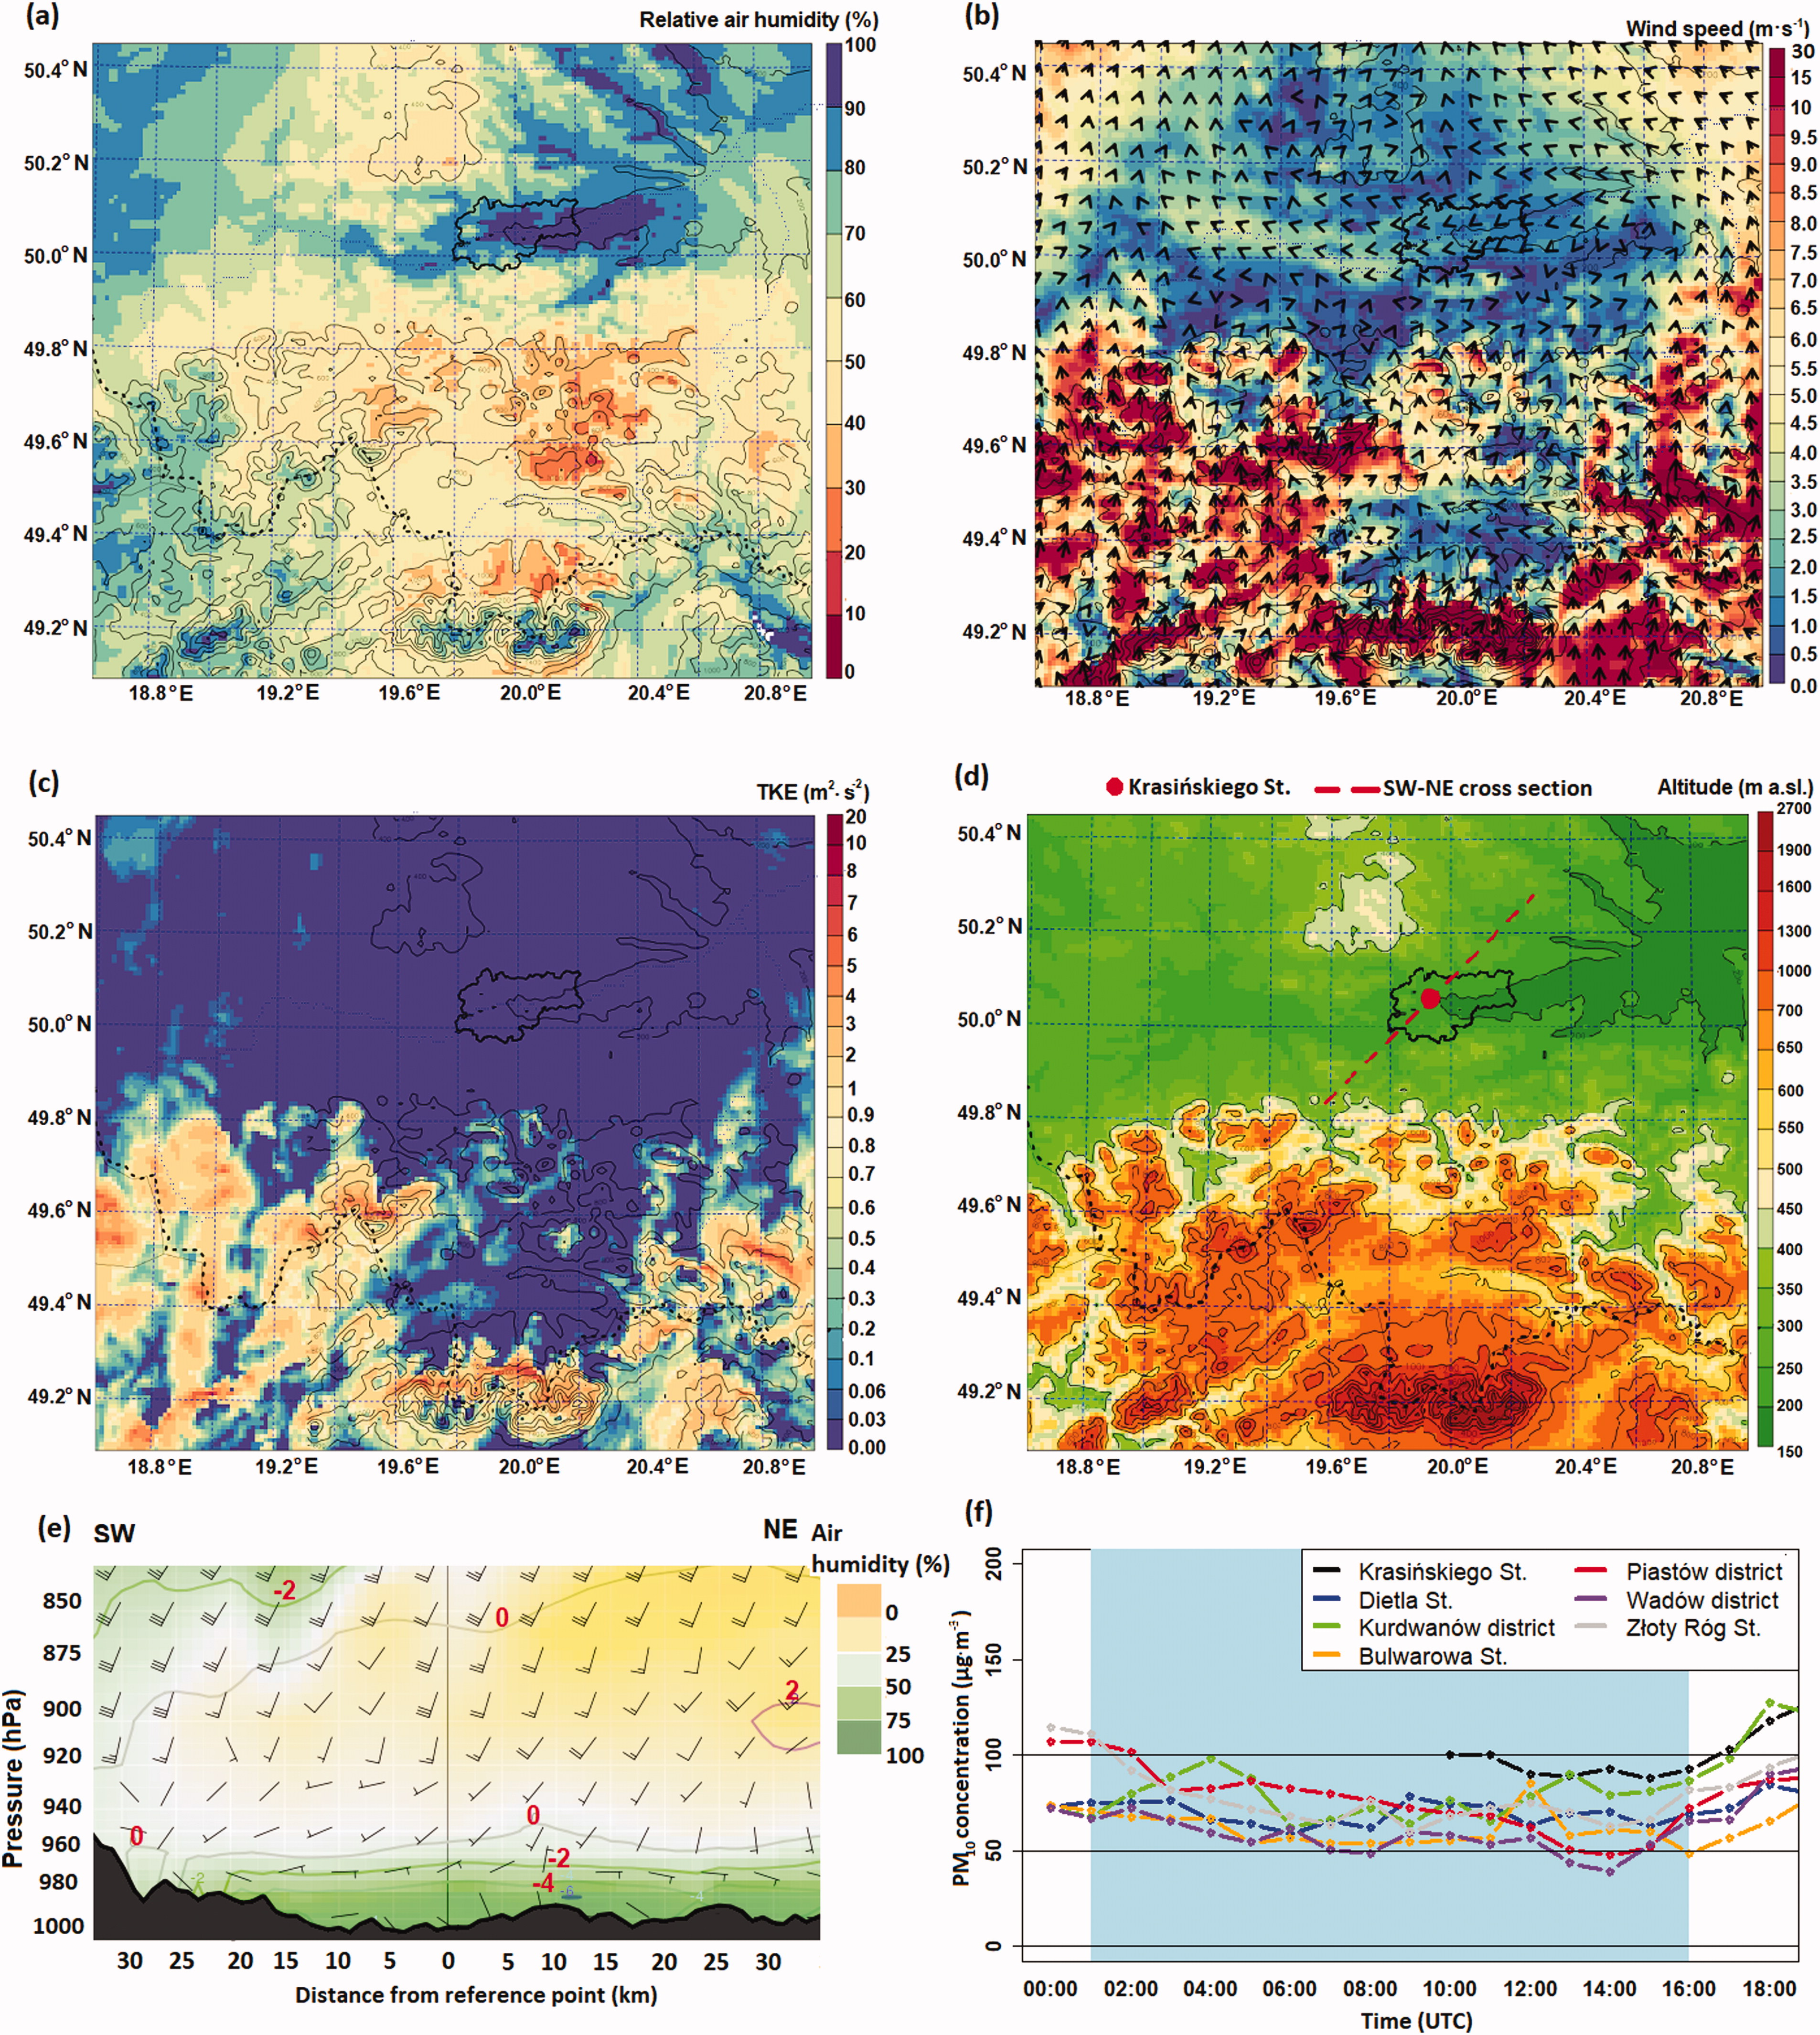
Fig. 12.
Spatial pattern of relative air humidity (a), wind speed and direction (b) and turbulence kinetic energy at 110 m a.g.l. (c), topographic map of this terrain (d) and cross section of air temperature (temperature isolines), relative humidity (background) and wind (in knots) (e) for station Krasińskiego St at 6 UTC (20.12.2018). Spatial-temporal patterns of PM10 concentrations on 20.12.2018 (f).
Key: blue background in Fig. 12f: foehn period.
[i] Explanations: pattern 1 - increase of PM10 concentration at all stations, pattern 2 - decrease of PM10 concentration at all stations; pattern 3 - short-term peaks or long-term periods of high PM10 at western stations; pattern 4 - long-term periods of high PM10 concentrations at all measurement points
Table 1. Location of meteorological stations in Kraków and nearby, Kasprowy Wierch and the meteorological elements used in the research.
used1Balice50.0819.80237IMWM-NRIValley bottomV, D, T, RH2Libertów49.9719.90314IMWM-NRIHill topV, D, T, RH3Igołomia50.0920.26202IMWM-NRIValley bottomV, D, T, RH4Mszana Dolna49.6620.05440IMWM-NRIValley slopeV, D, T, RH5Reymonta St.50.0719.91220AGH USTValley bottomV, D, T, RH6Krasińskiego St.50.0619.93204JUValley bottomT7Słowackiego
Theatre50.0519.95215JUValley bottomT, RH8Bojki St.50.0119.96252JU50 m above
valley bottomT9Jeziorzany49.9919.77211JUValley bottomT, RH10Kocmyrzów50.1420.13299JUHill topT11Chorągwica49.9520.08436JUHill topT12Telecommunication mast (Tower):
2 m a.g.l.
50 m a.g.l.
100 m a.g.l.50.0519.91222
272
322JUValley bottomT, RH13Szkolne district50.0820.05205JUValley bottomT14Botanical Garden50.0519.95206JUValley bottomV, D, T, RH, cloudiness15Kasprowy Wierch49.2319.981998IMWM-NRIMountain peakV, D, T, RH