
Table 1.
Sustainability competencies and their description used in the questionnaire, based on Wiek et al. (2011).
Table 2.
Universtity degree programmes that are part of the ABS network or had a member of faculty attending the Euroflux workshop were sent the programme questionnaire and their internet pages investigated (retrieved February 2020).
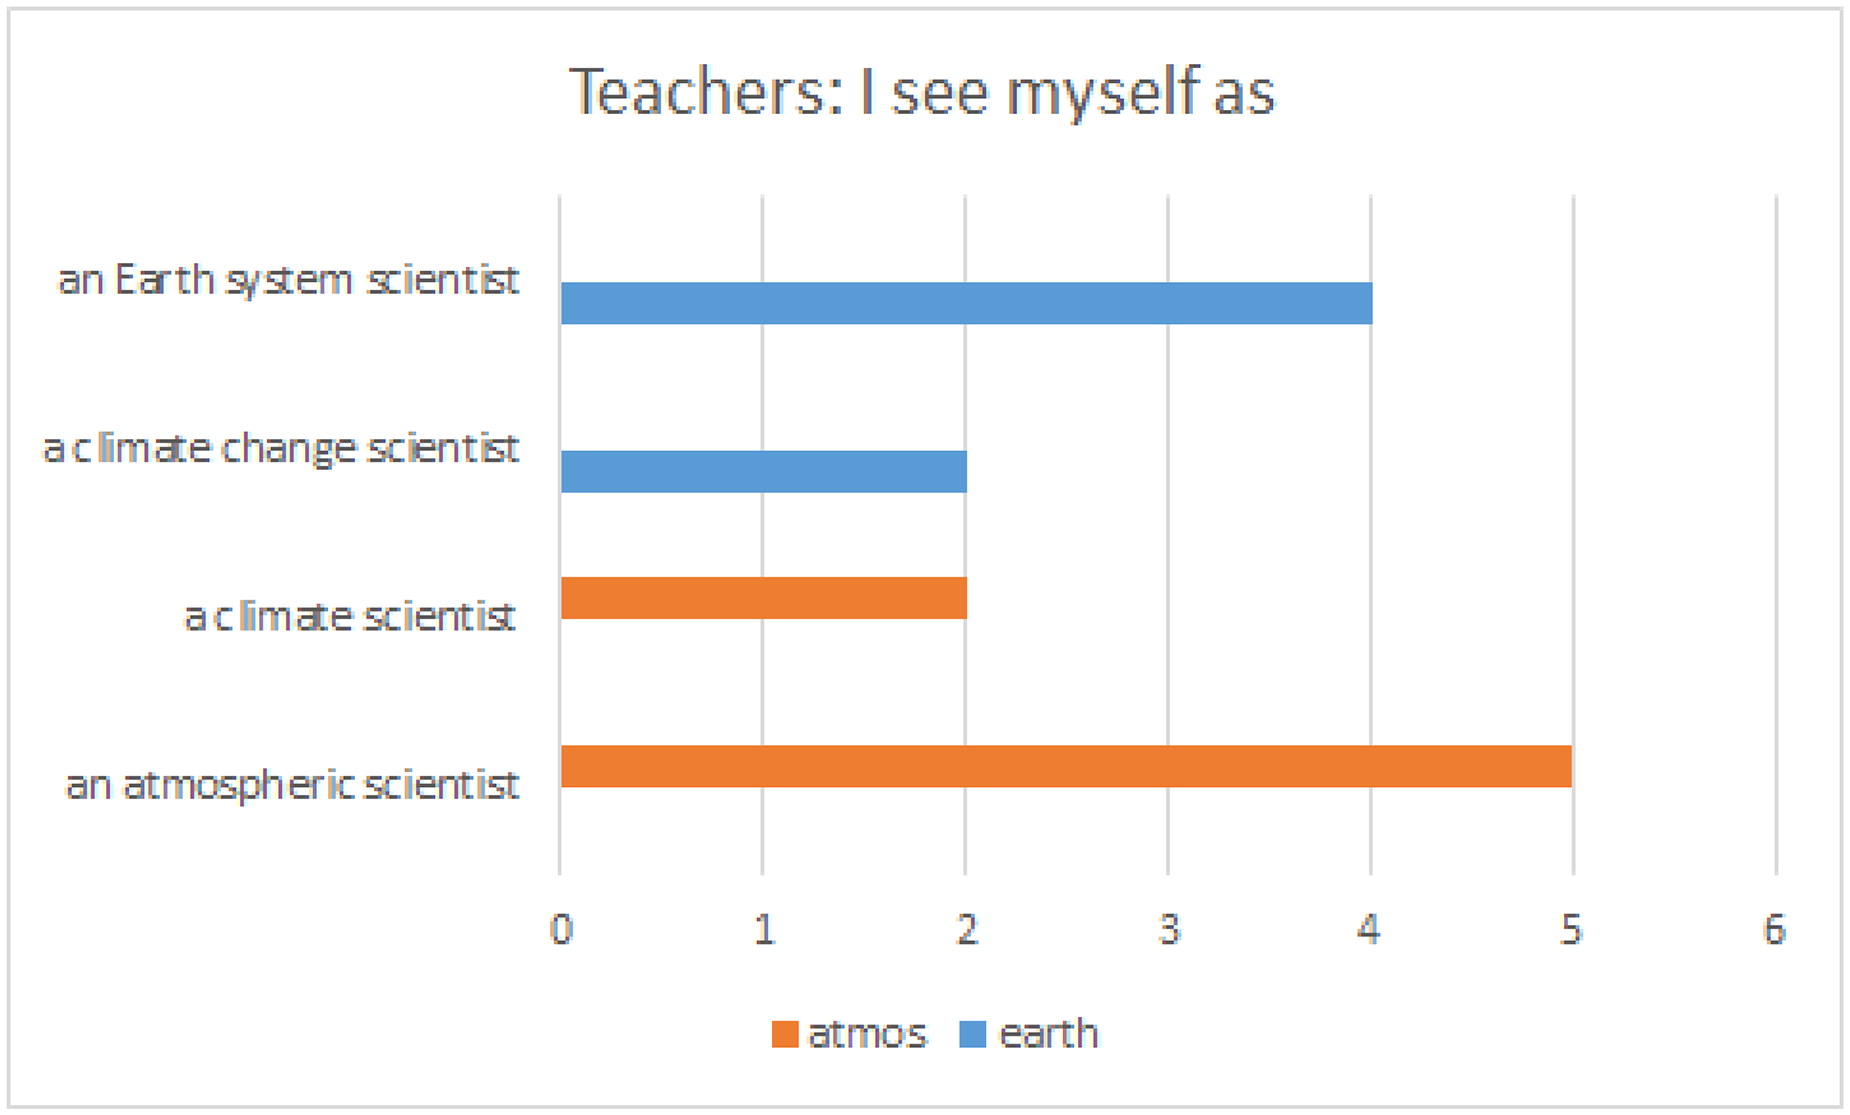
Fig. 1.
How the respondents to the teacher survey see their field of expertise. Colours indicate if the respondents were classified as atmospheric (atmos) or Earth system scientists (earth). X-axis is the number of answers. The respondents were able to select multiple options.
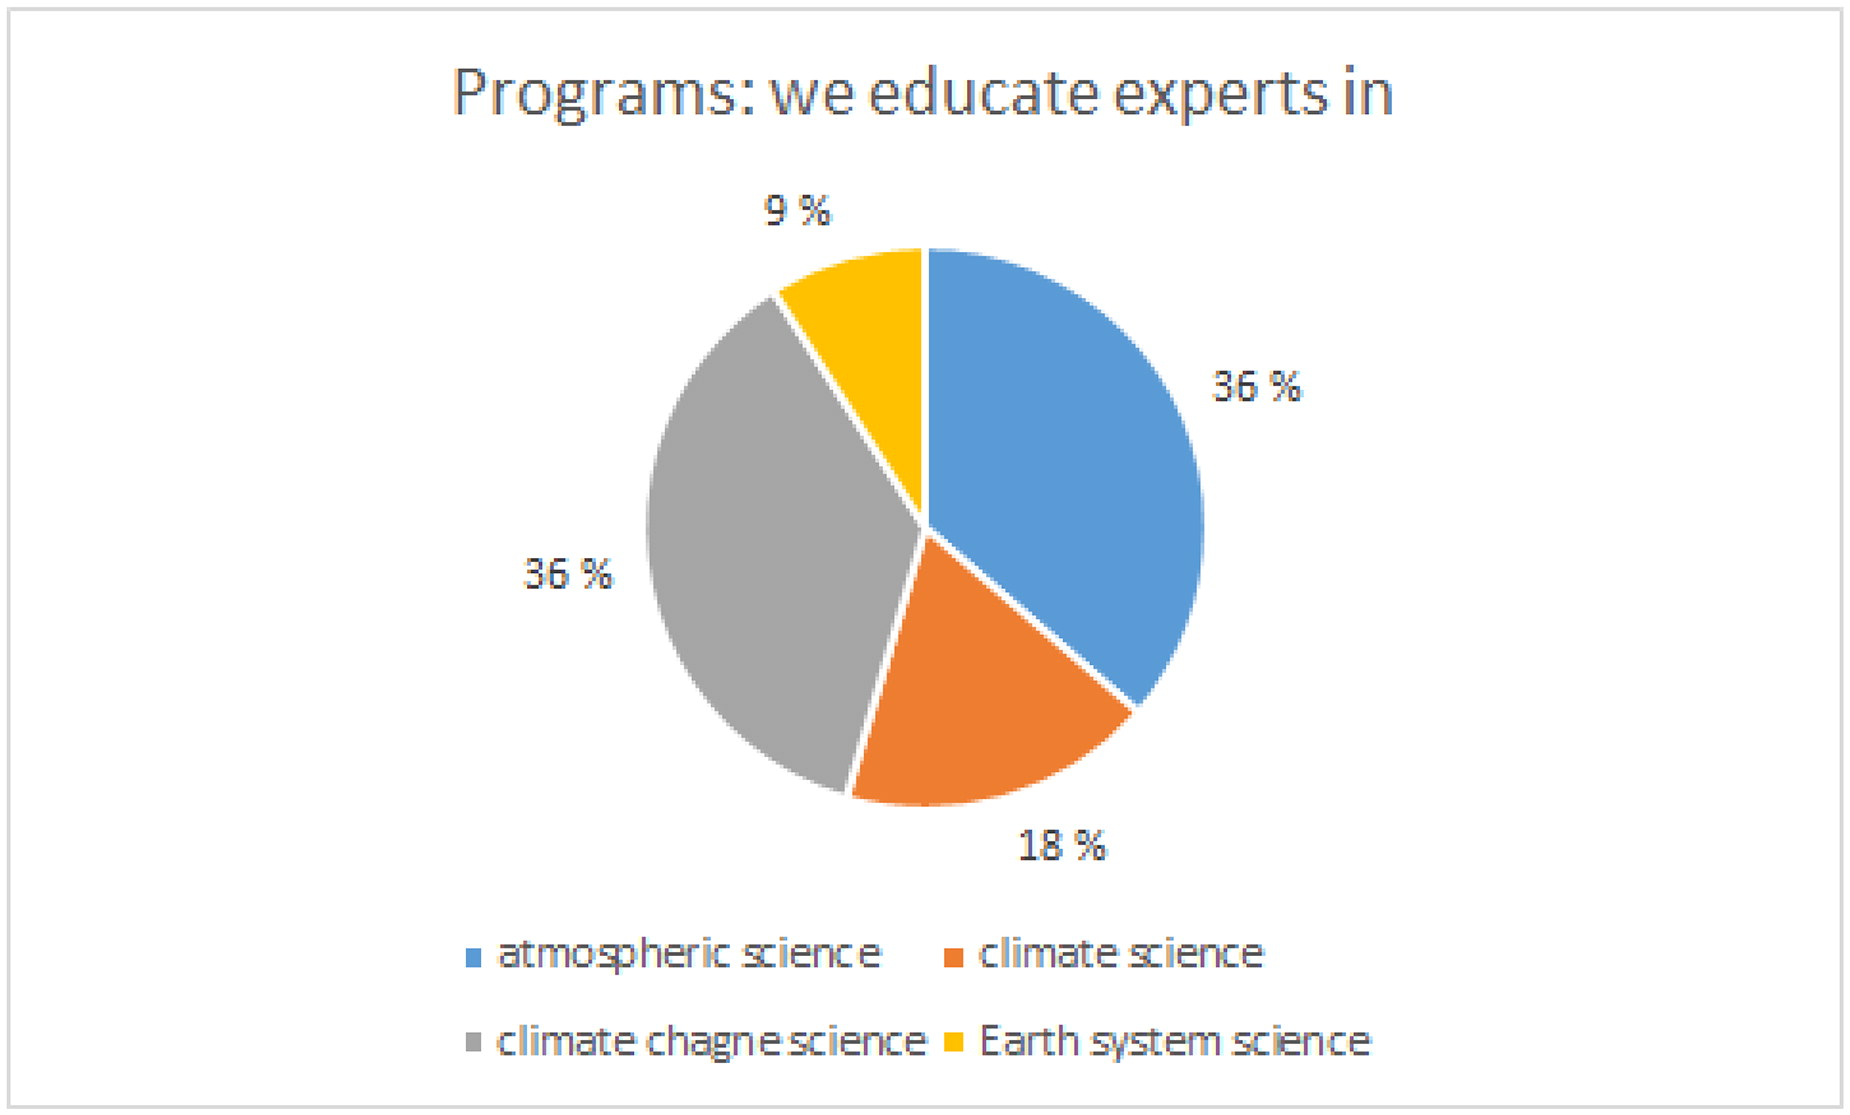
Fig. 2.
How the respondents to the programme survey see the fields they educate experts in.
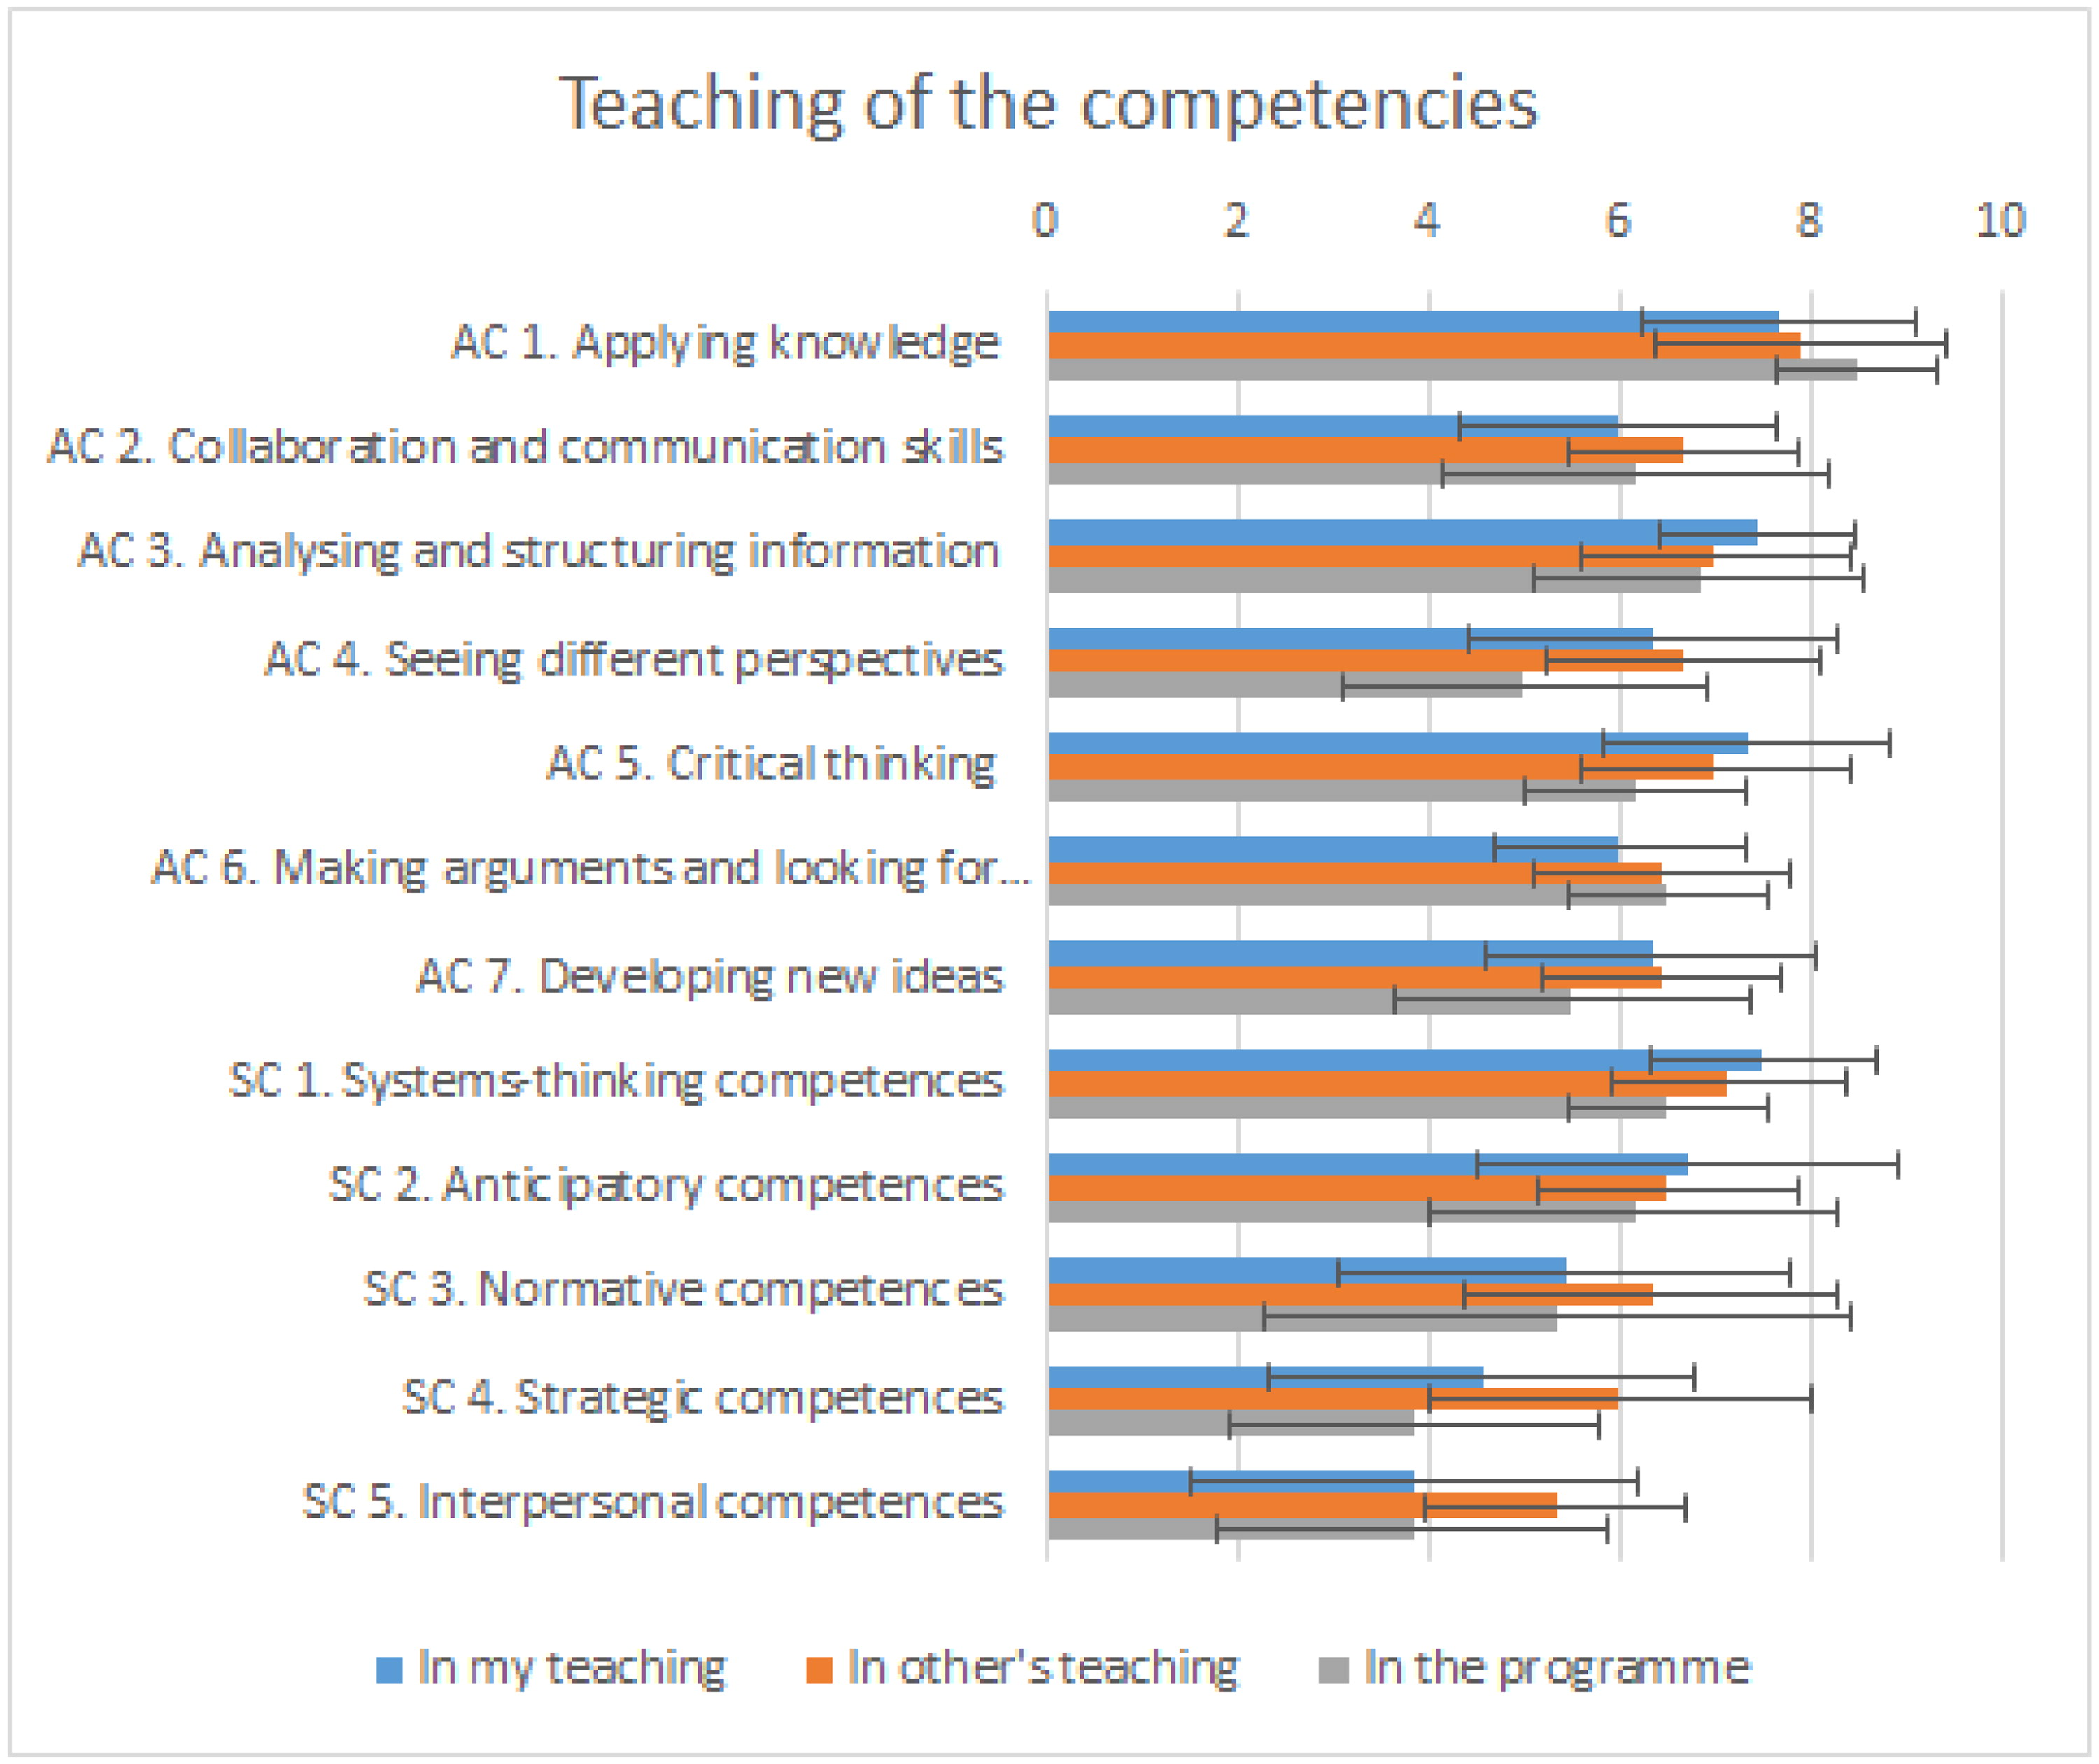
Fig. 3.
Competencies in teaching. X-axis is how much on scale 0-9 did the respondents on average see they and their colleagues as well as the studied programmes teach the mentioned competencies. Values are averages of all answers and error bars show standard deviation (+/-1 STD).
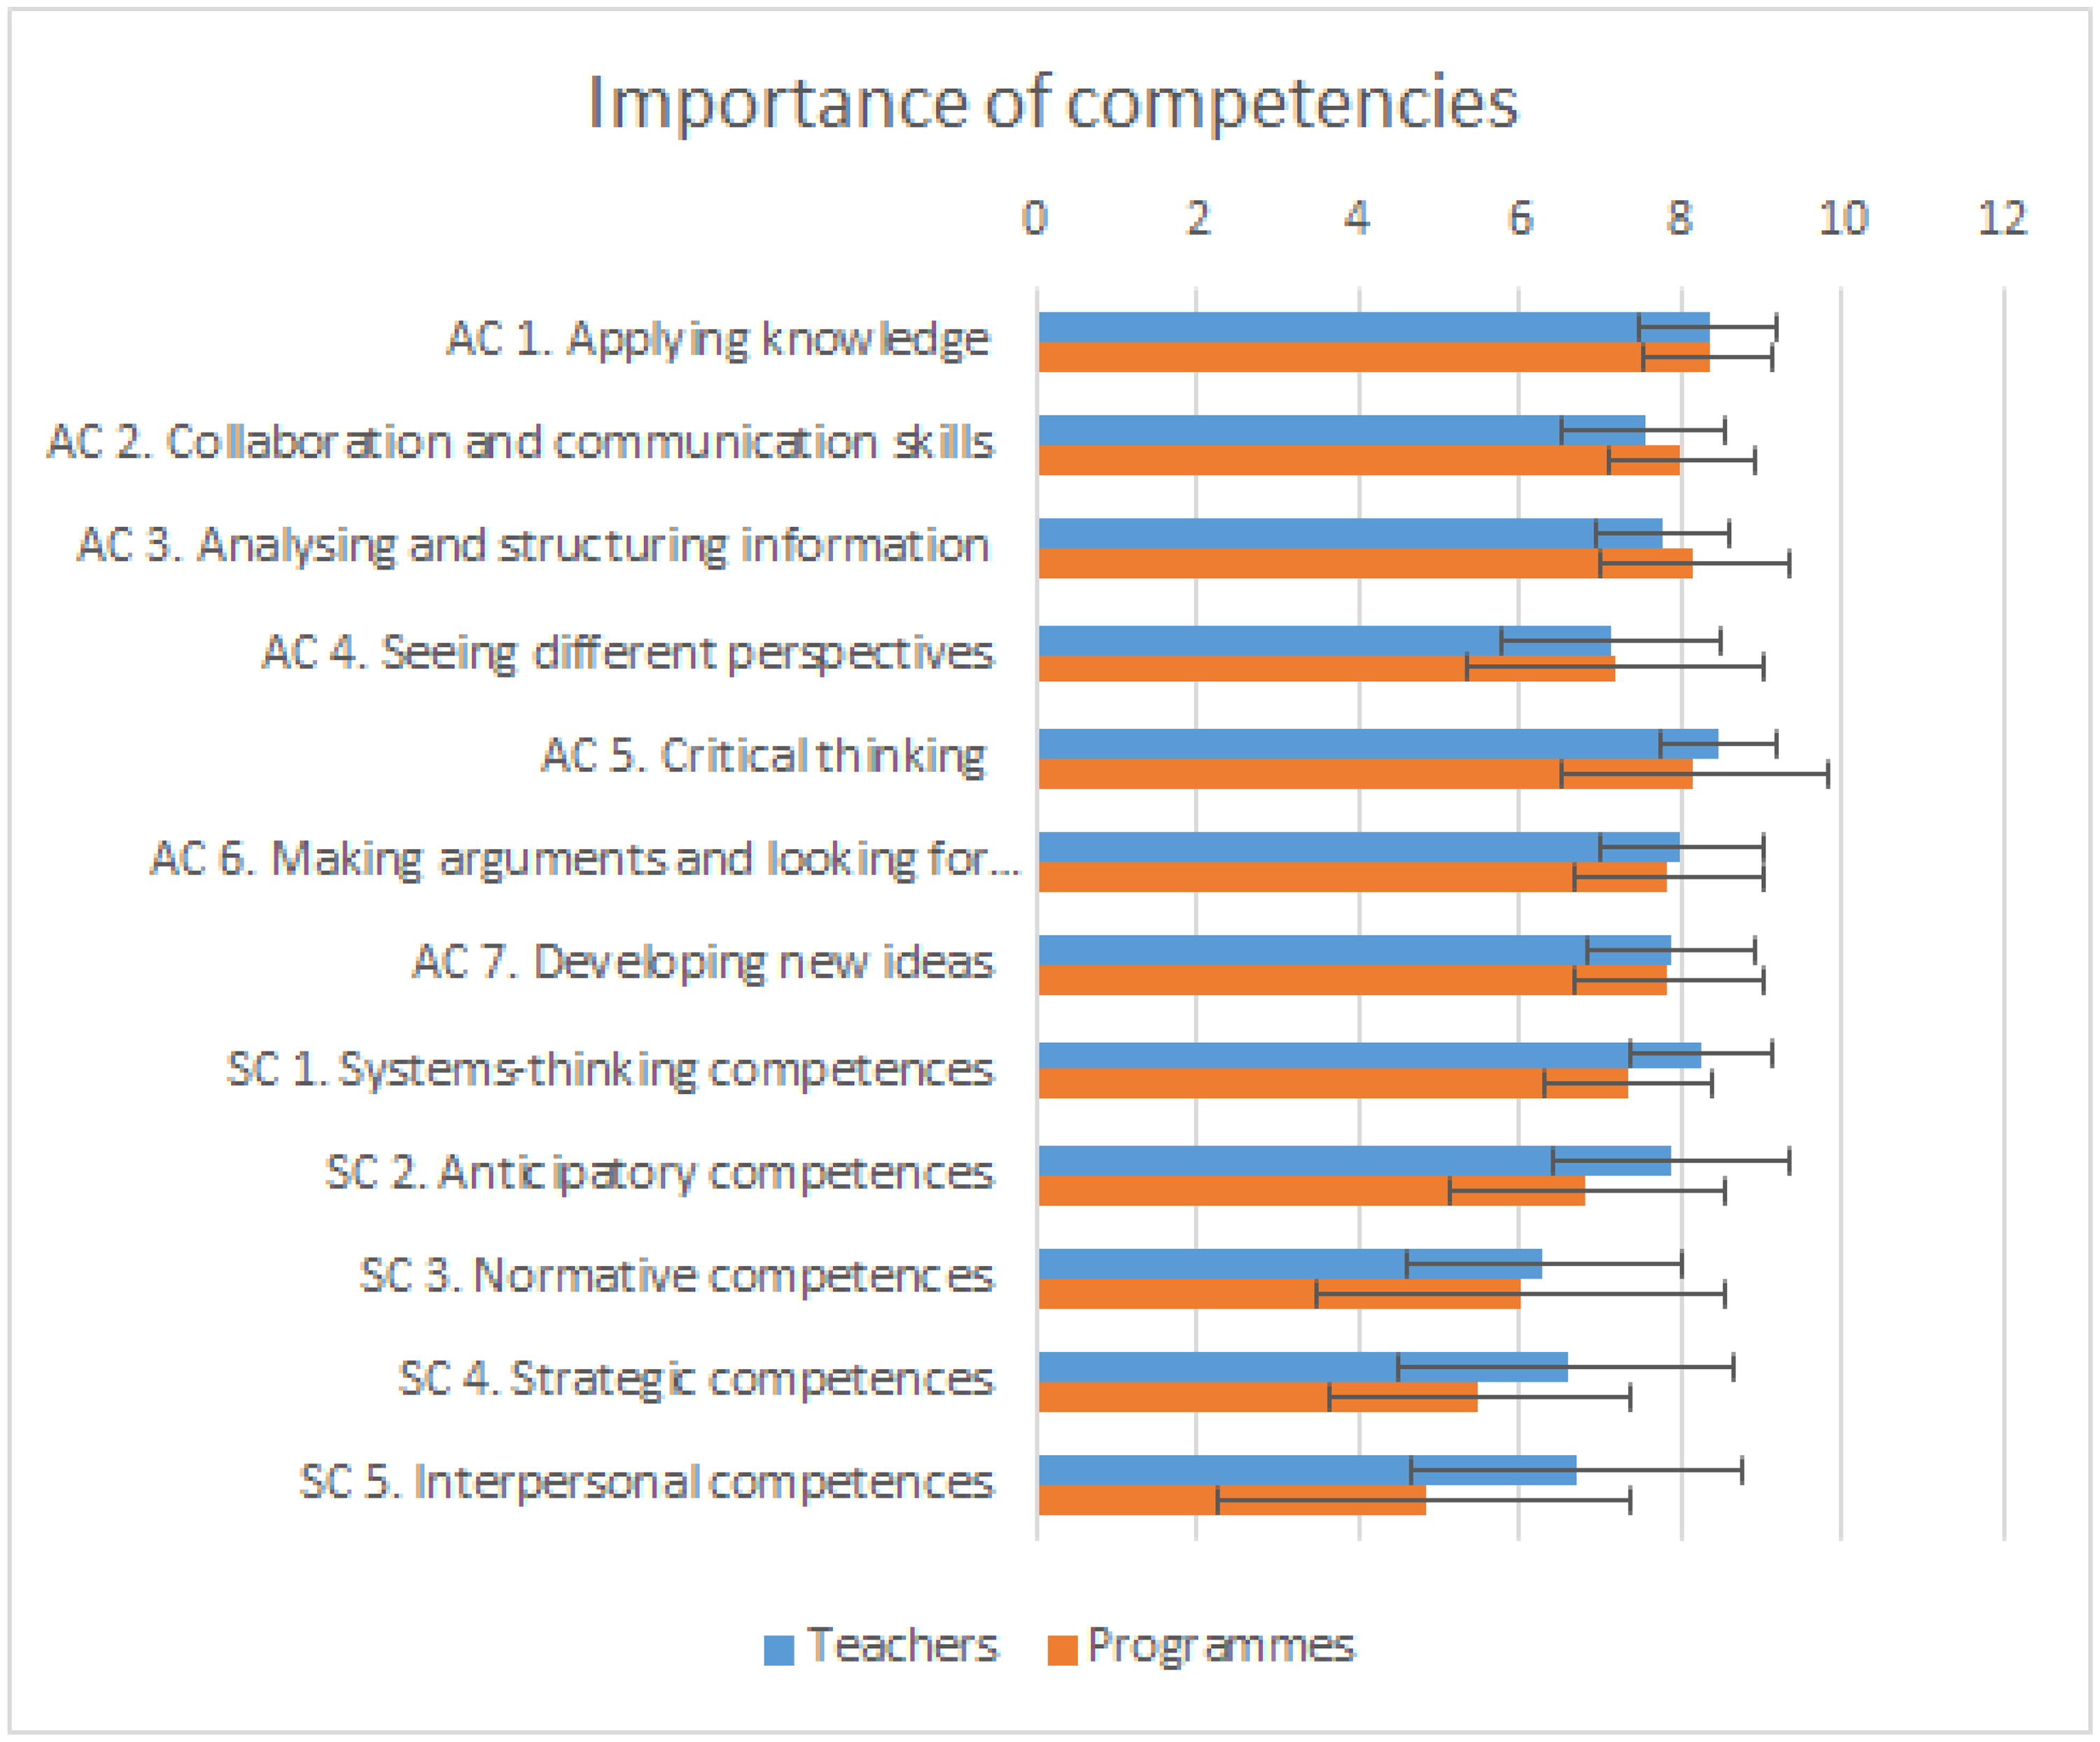
Fig. 4.
Importance of competencies. X-axis shows how important on scale 0-9 did the respondents on average rate these competencies for the students to learn. Values are averages of all answers and error bars show standard deviation (+/-1 STD).
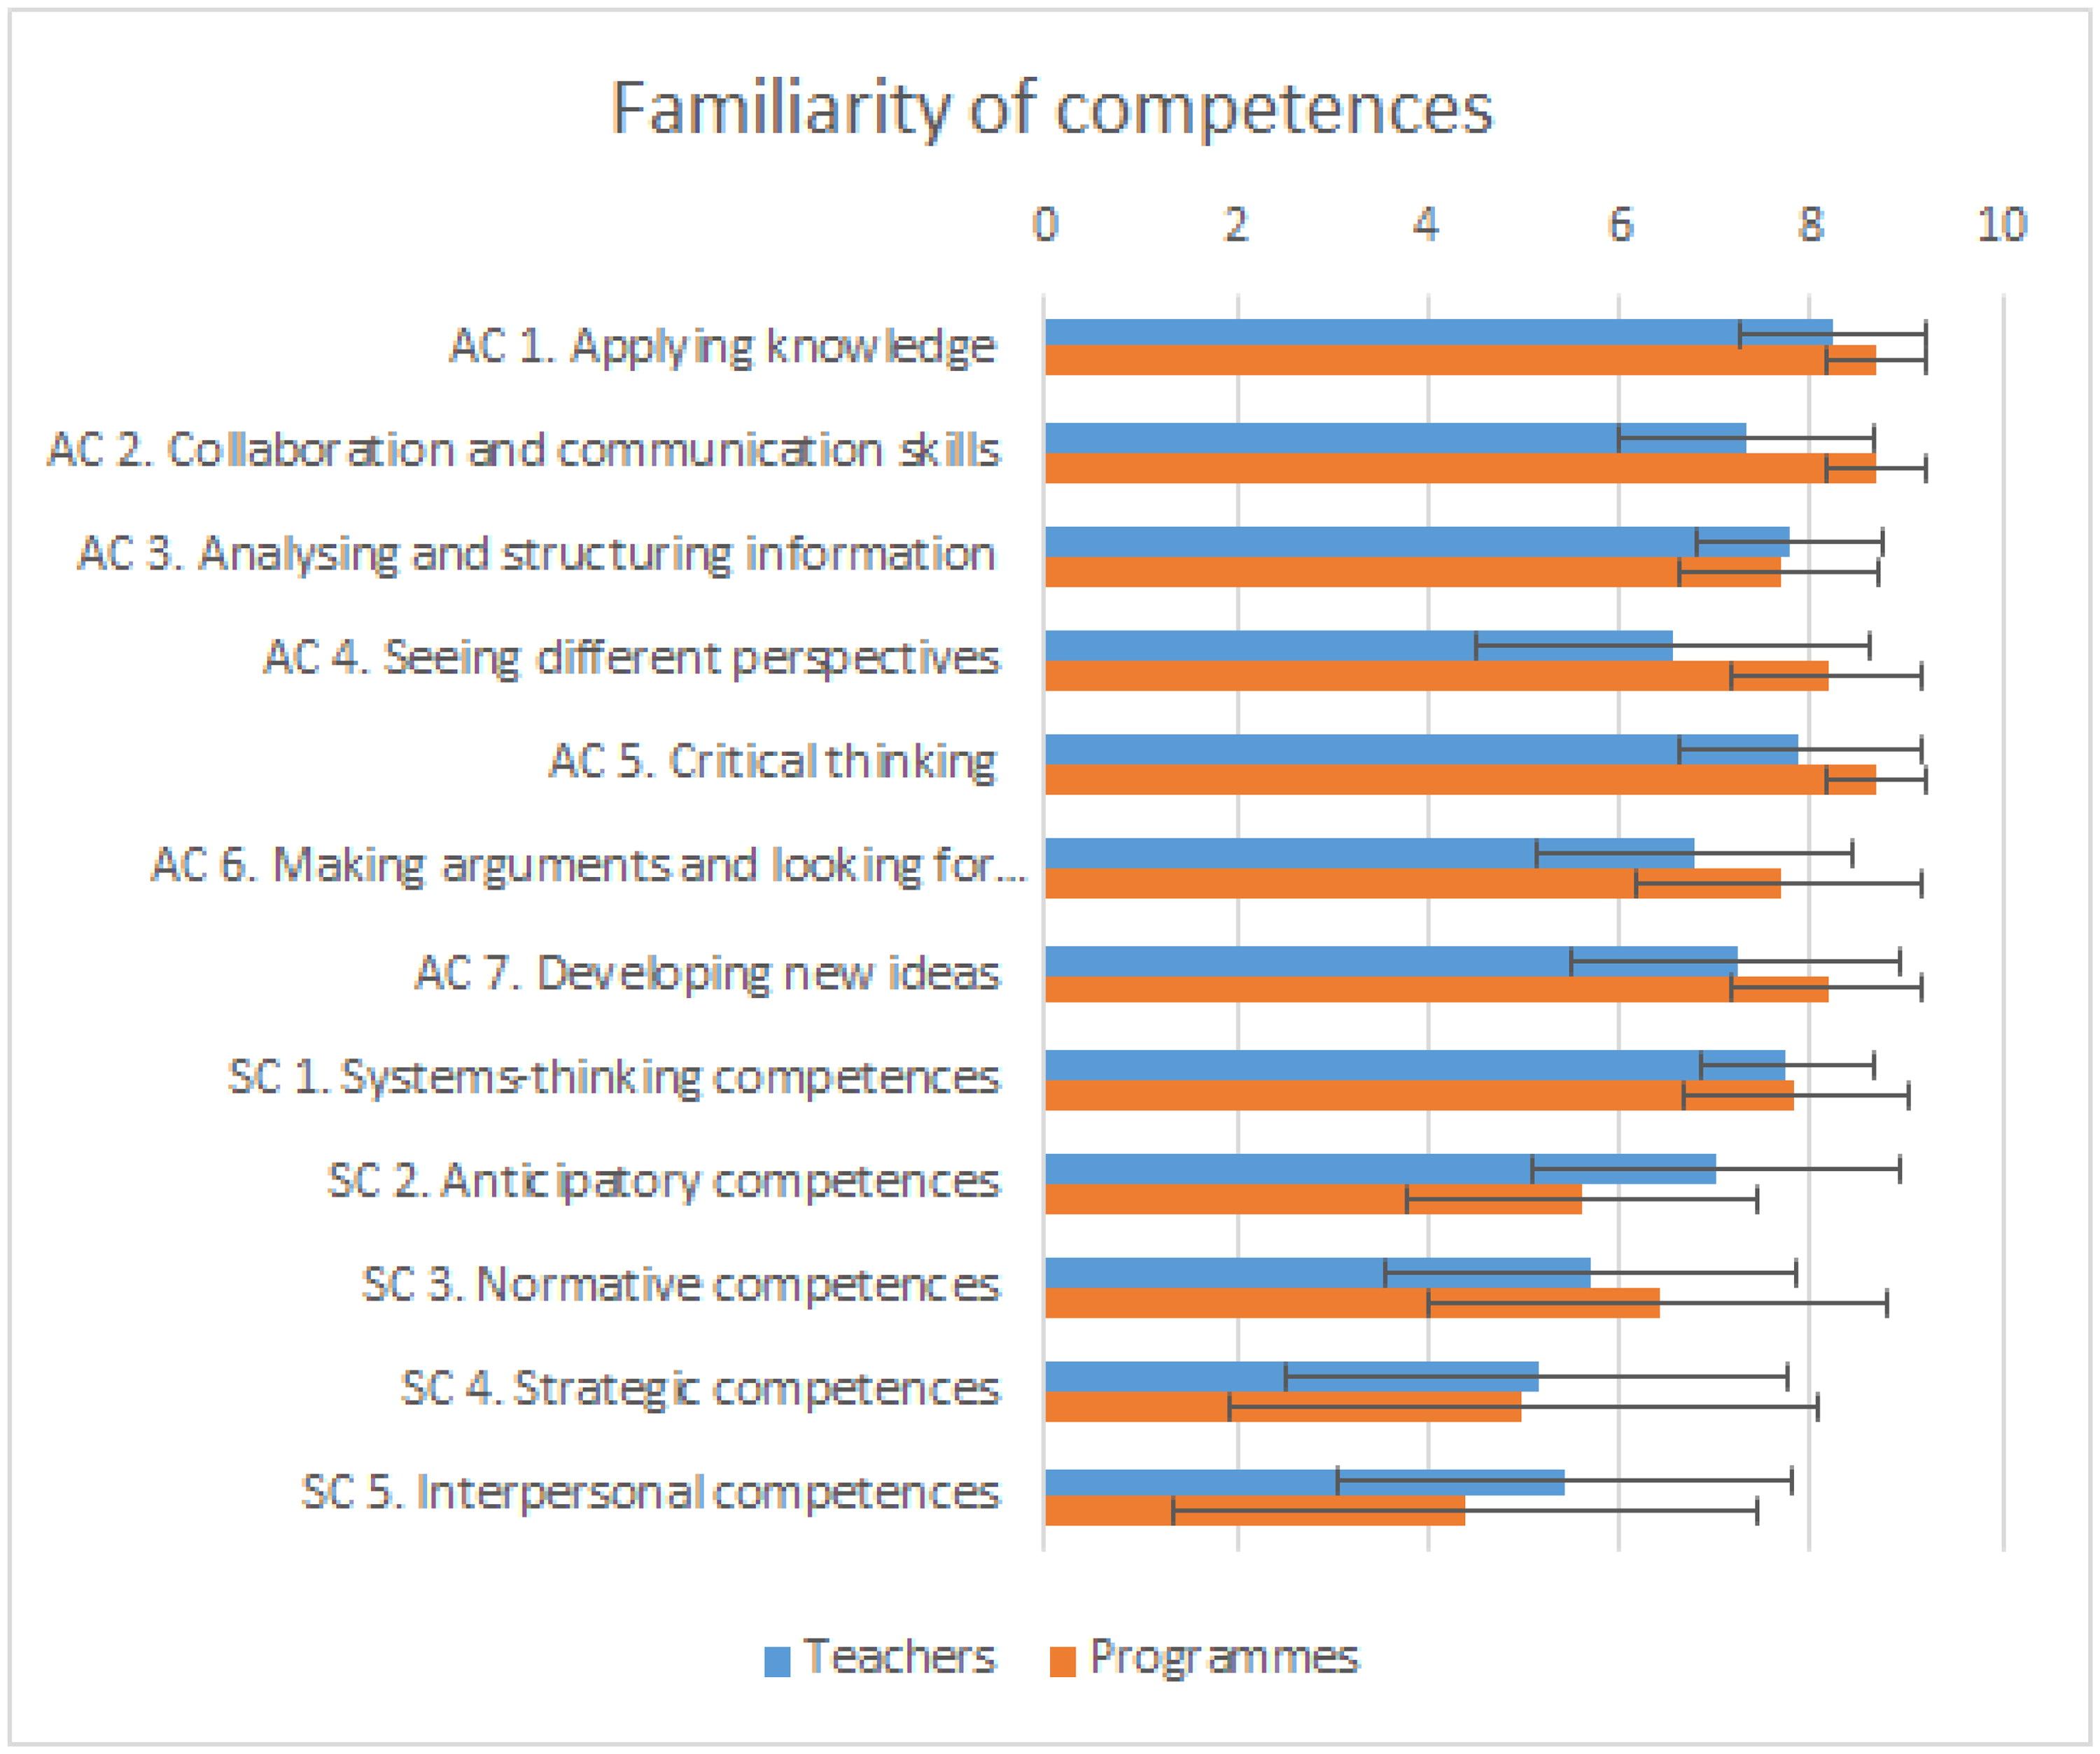
Fig. 5.
Familiarity of competencies. X-axis shows how familiar on scale 0-9 did the respondents on average rate the studied competencies. Values are averages of all answers and error bars show standard deviation (+/-1 STD).
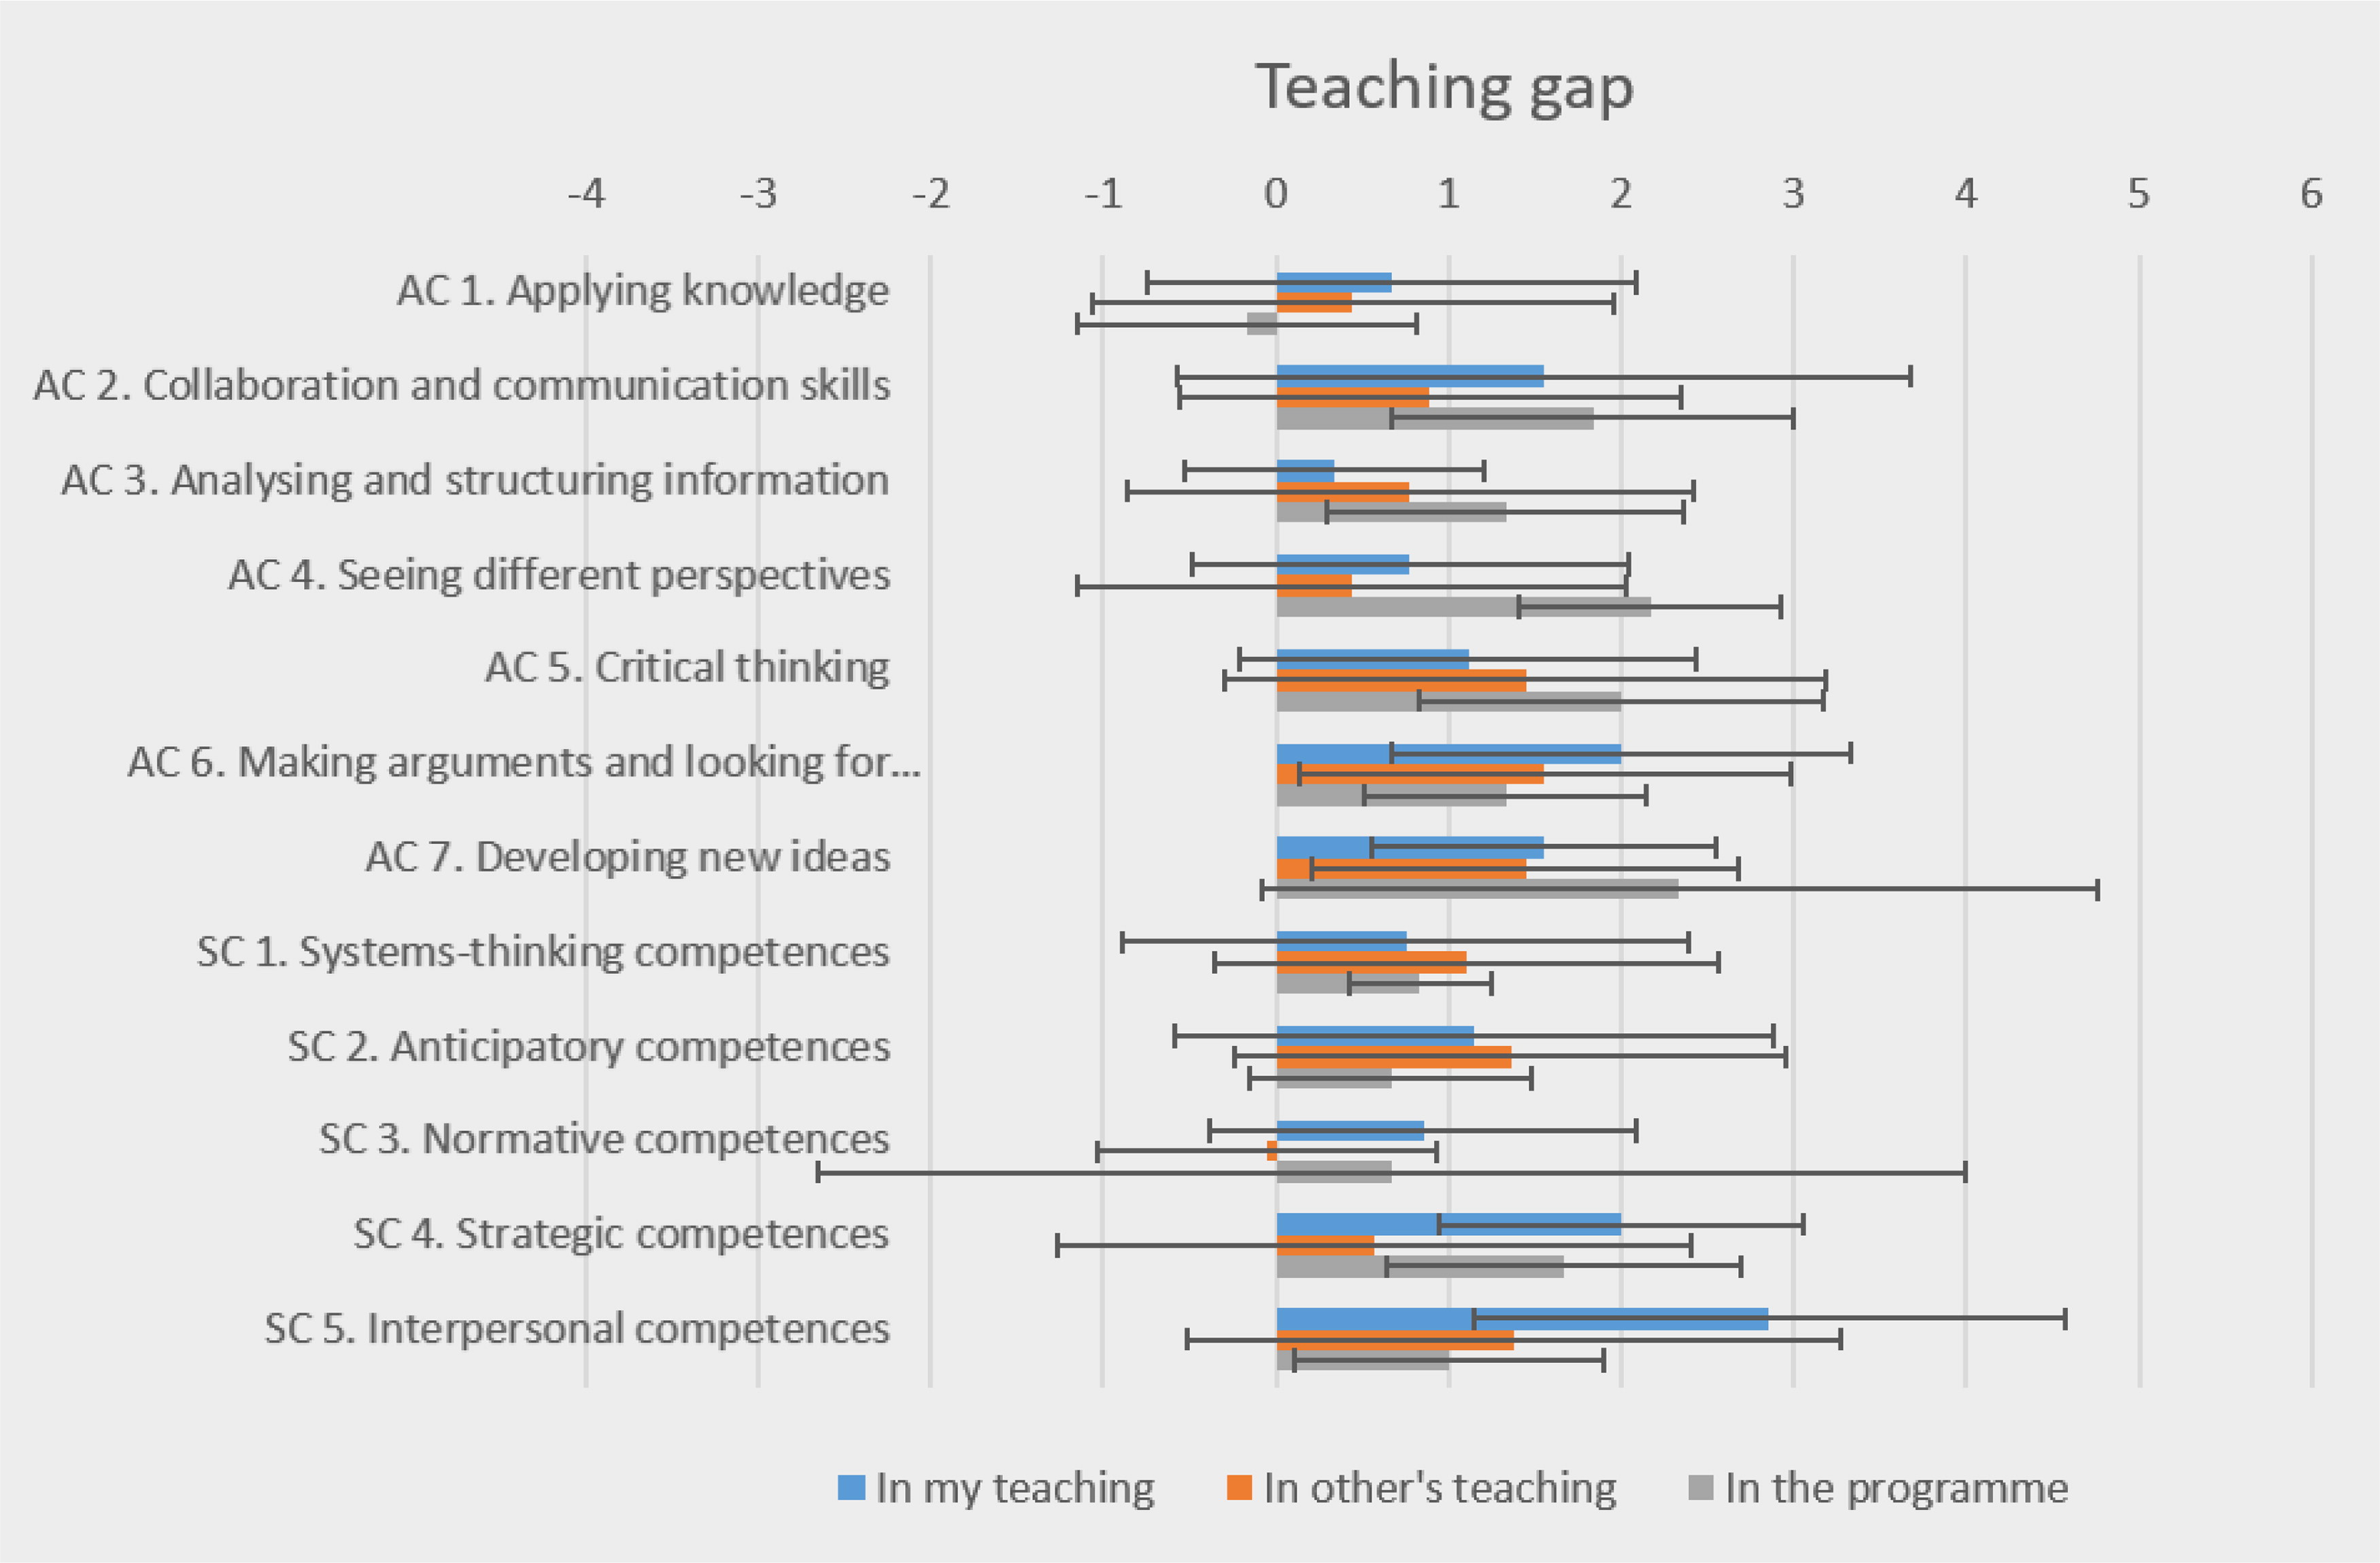
Fig. 6.
Teaching gap, defined as the importance minus teaching of the competencies (both on scale 0-9). Error bars show standard deviation. The difference was statistically significant (p < 0.05) in cases of AC5-7, SC1 and SC5 (teachers) and AC2-4, AC6-7, SC1 and SC4-5 (programmes).
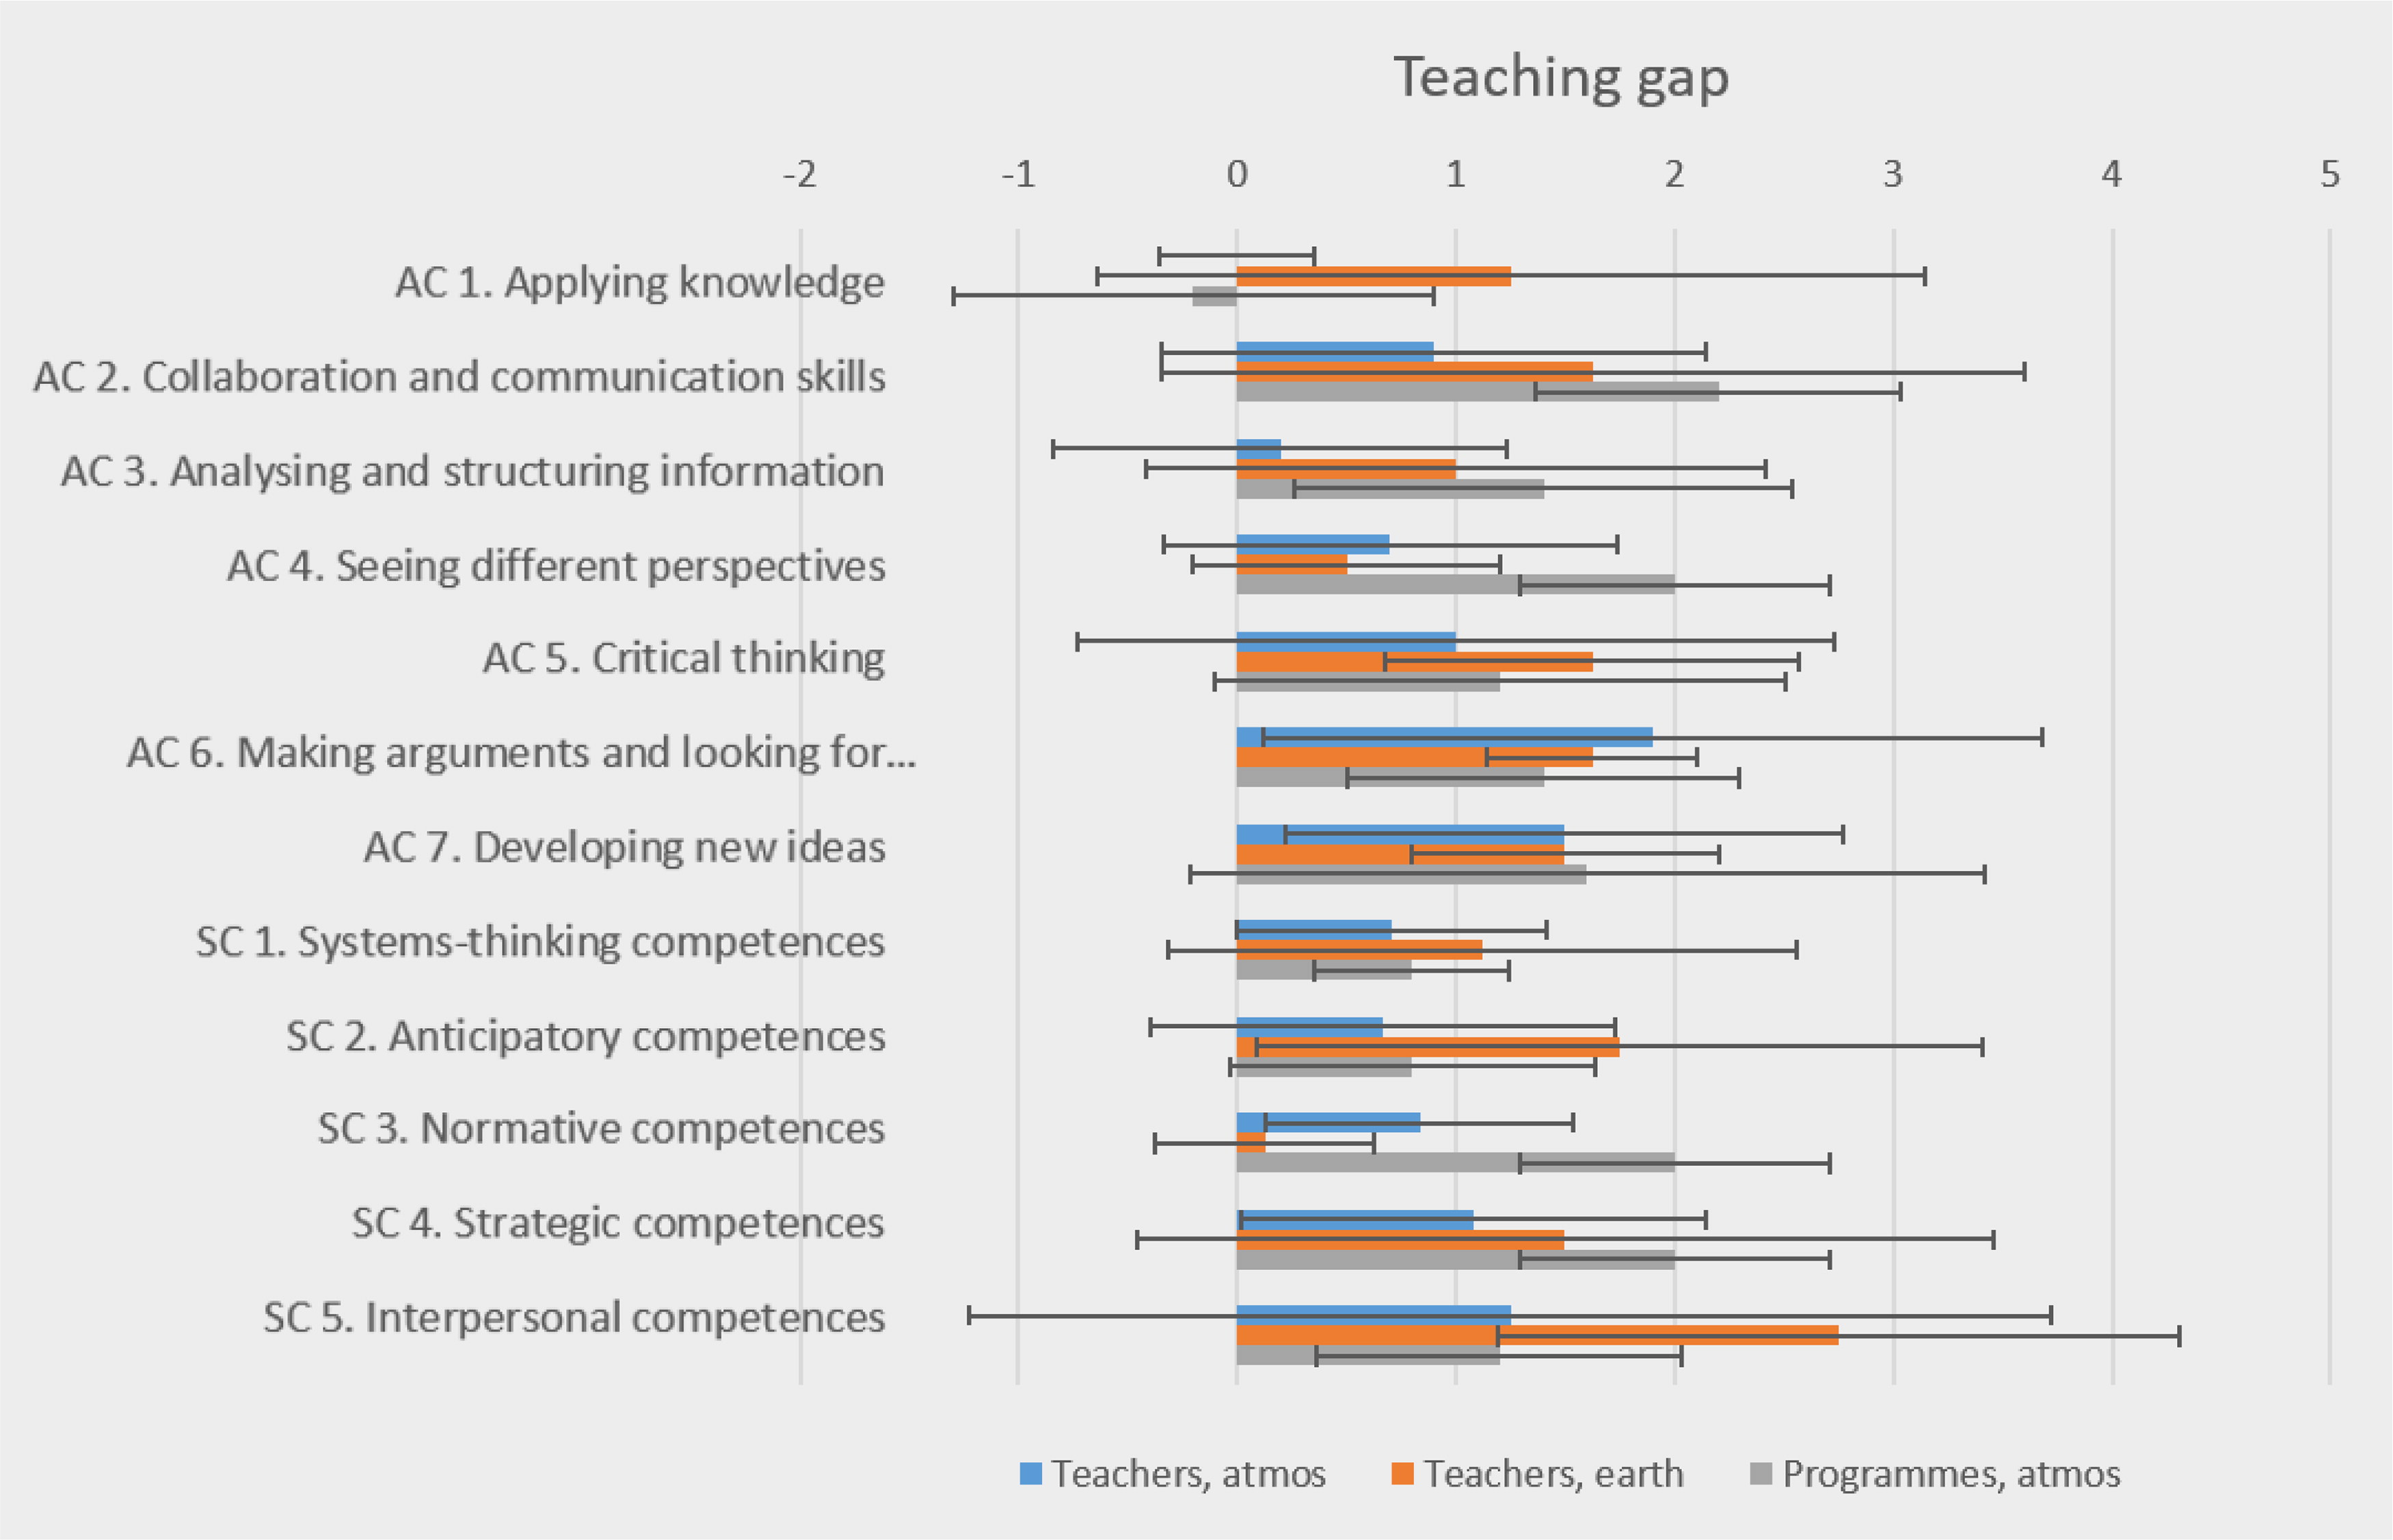
Fig. 7.
Teaching gap. Teachers who were identified as atmospheric (atmos) or Earth system (earth) scientists as well as atmospheric degree programmes are presented separately. Error bars show standard deviation. Due to small sample size, most of the differencies are not statistically significant.
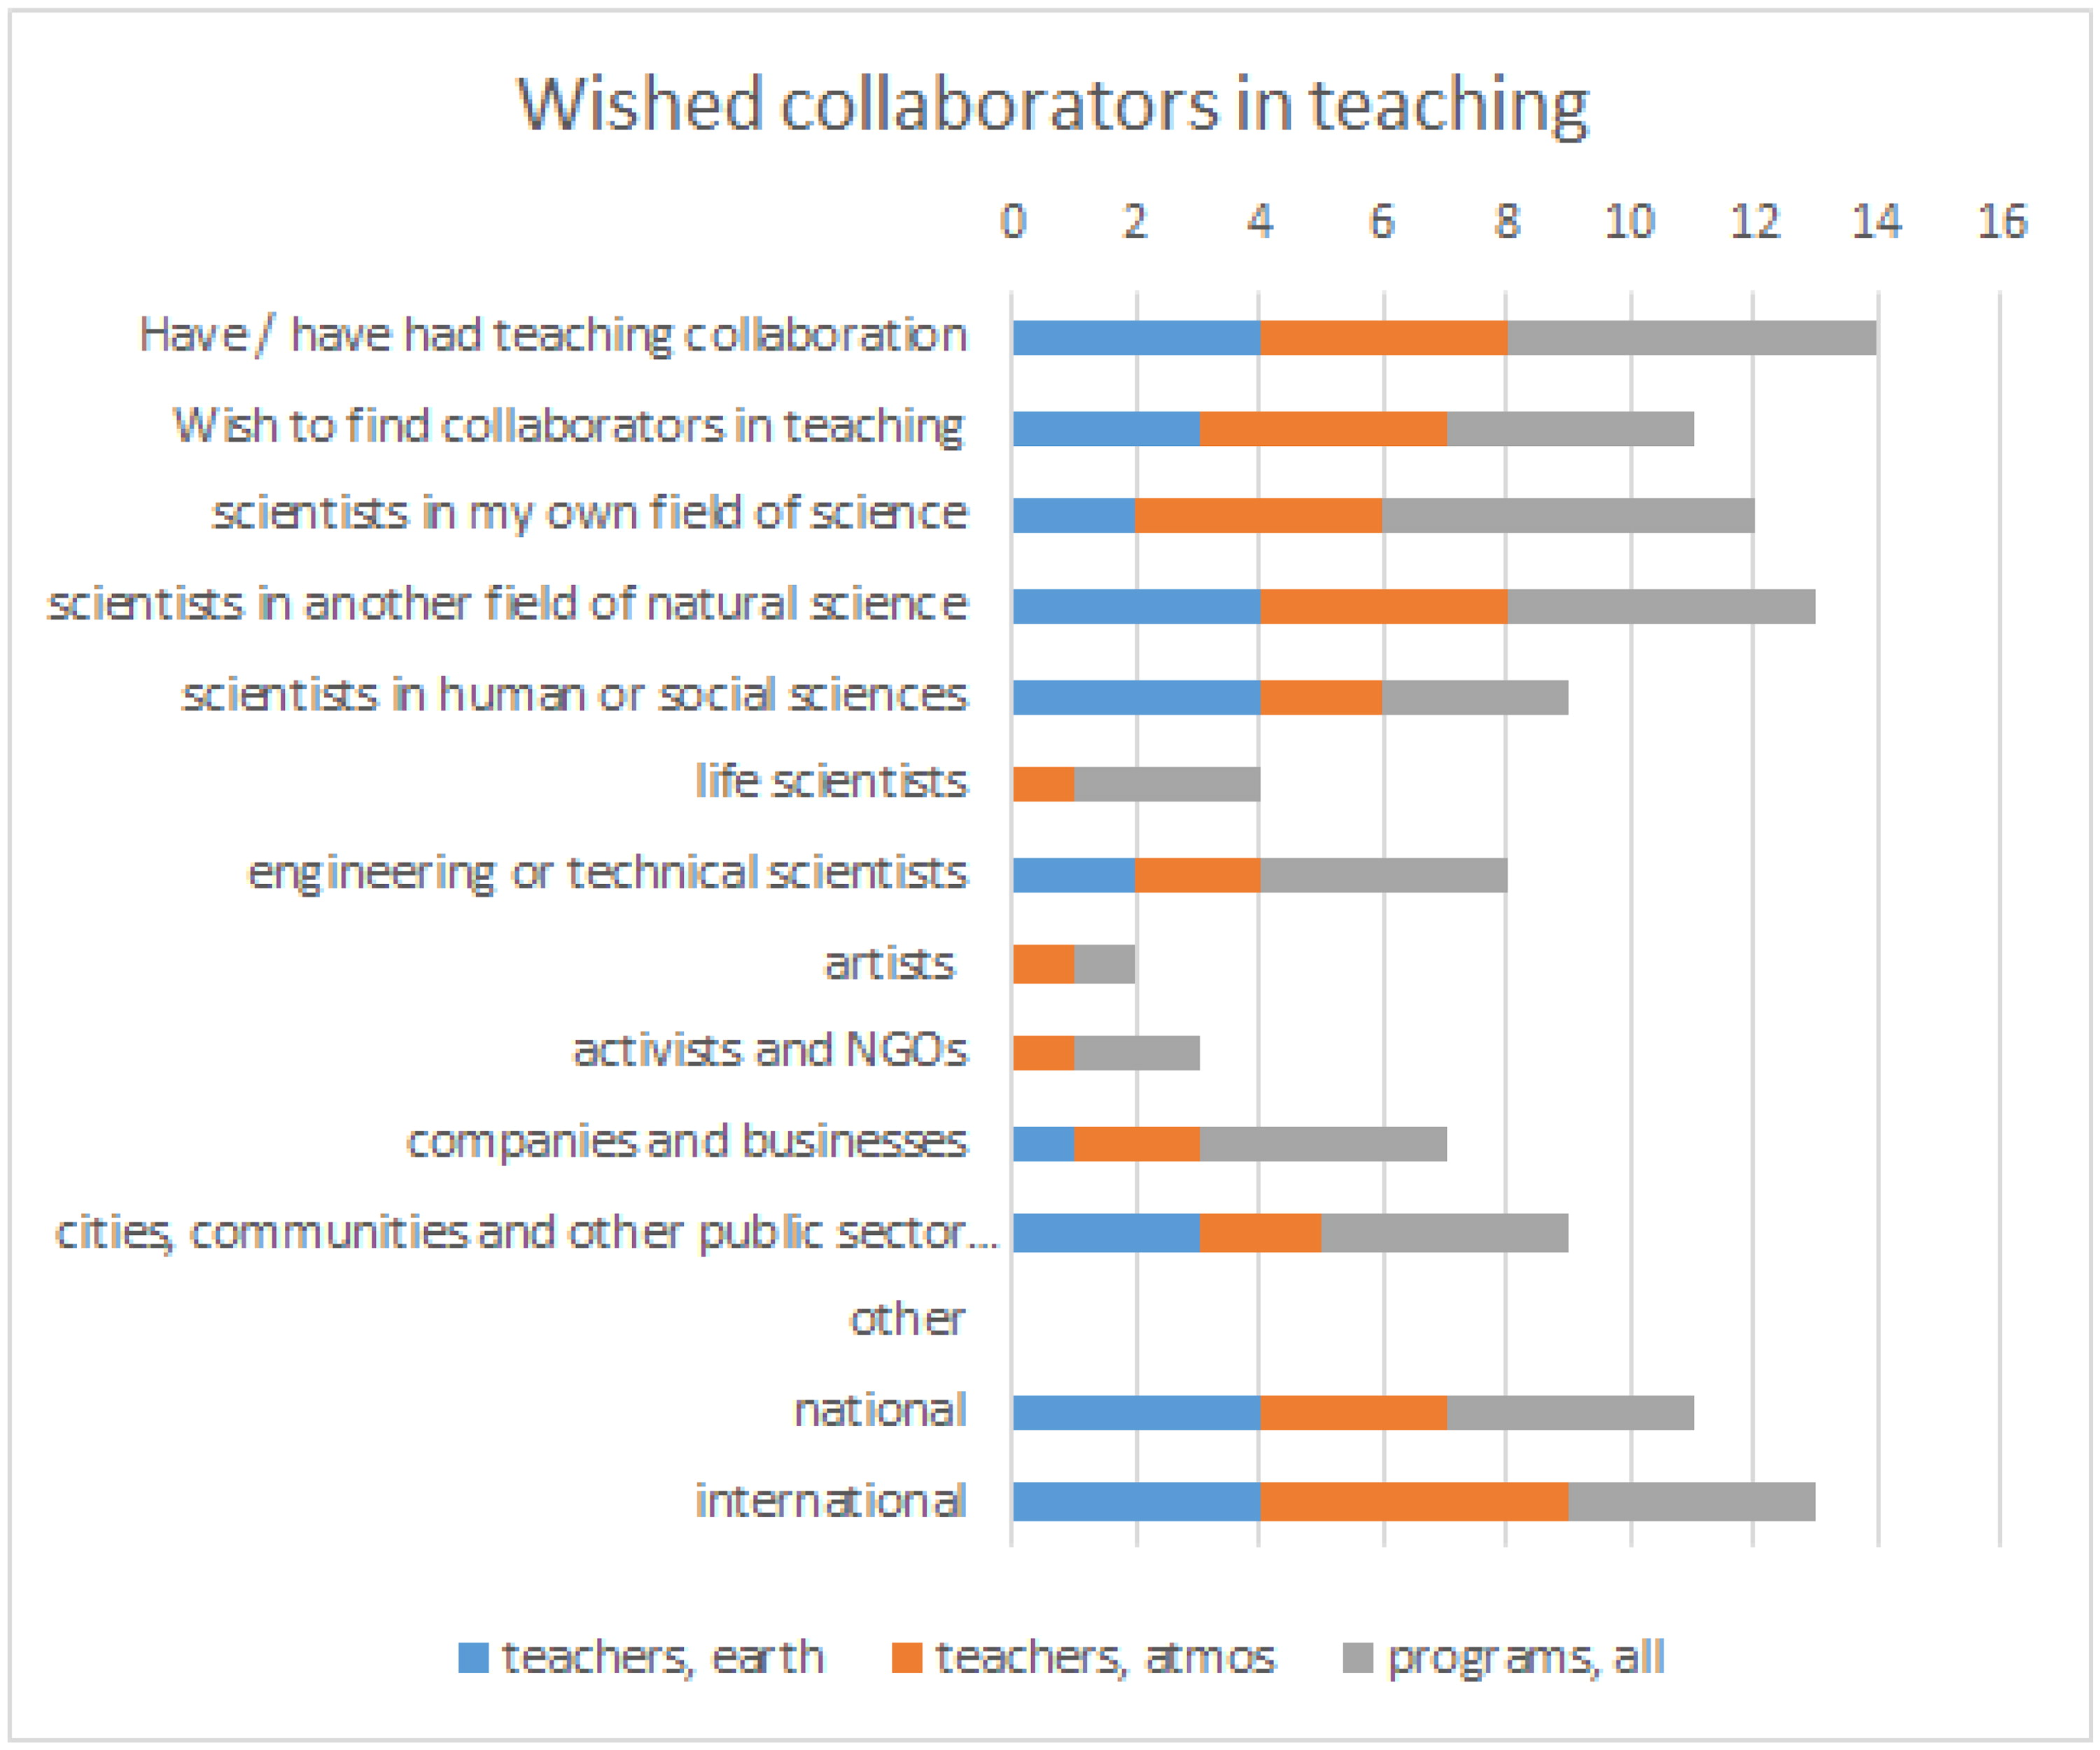
Fig. 8.
Teaching collaboration. Teachers who were identified as atmospheric (atmos) or Earth system (earth) scientists as well as degree programmes are presented separately. X-axis is the number each option was chosen, respondents could select as many options as they wanted to.