
Table 1.
Site-specific information, climate period 1981–2010, Köppen-Geiger climate class according to Kottek et al. (2006).
−72.1715° W
340 m a.s.l.Dfb
6.6 °C
1071 mmUrbanski et al. (2007)Hainich, DE-HaiDeciduous Broadleaf Forests, Beech (Fagus sylvatica L., 64%) ash (Fraxinus excelsior L., 28%), sycamore (Acer pseudoplatanus L., 7%)51.0792° N,
10.4530° E,
430 m a.s.l.Cfb
8.3 °C
720 mmHerbst et al. (2015)Waldstein-Weidenbrunnen, DE-BayEvergreen Needleleaf Forests, Norway spruce (Picea abies (L.) H.Karst)50.1342° N,
11.8669° E,
775 m a.s.l.Cfb (before 1990 Dfb)
6.0 °C
1005 mmFoken (2017)Hyytiälä, Fi-HyyEvergreen Needleleaf Forests, Scots pine (Pinus sylvestris L.)61.8474° N,
24.2948° E,
181 m a.s.l.Dfc,
3.8 °C
709 mmRannik et al. (2006)
Table 2.
Most relevant instrumentation during the period of observation.
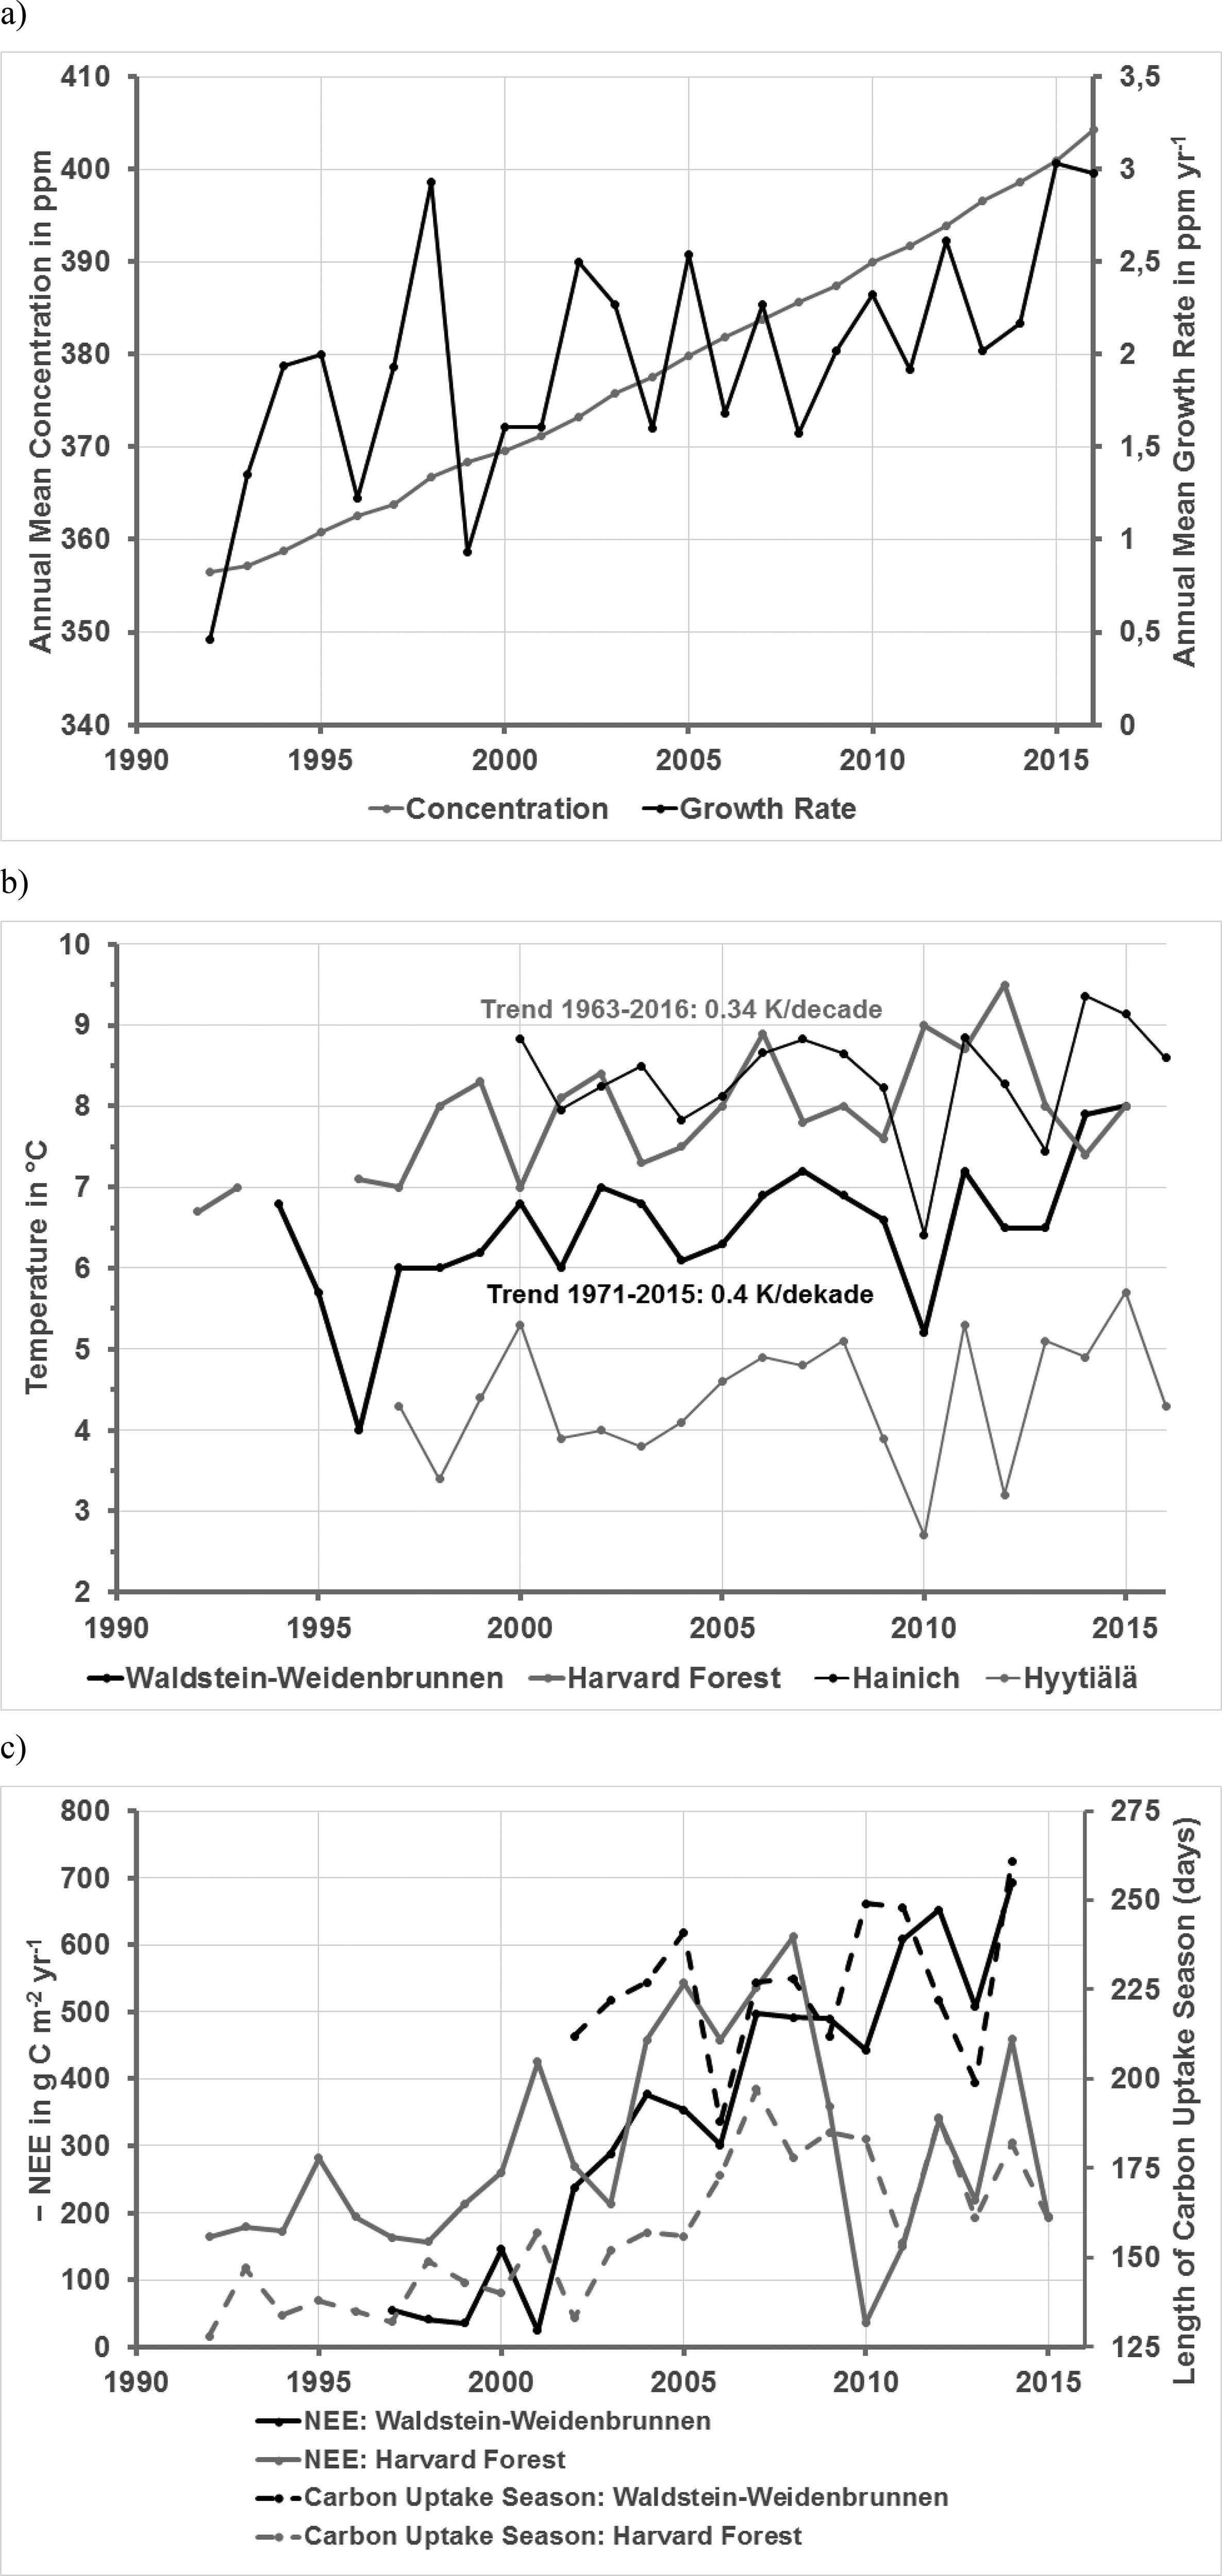
Fig. 1.
(a) Time series of the carbon dioxide concentration and the growth rate for Mauna Loa station (data source: NOAA); (b) time series of the mean annual temperature of the four selected stations; (c) time series of the length of the carbon uptake season for US-Ha1 and DE-Bay together with annual sums of the Net Ecosystem exchange (for a better illustration at the ordinate (–1)·NEE is shown).
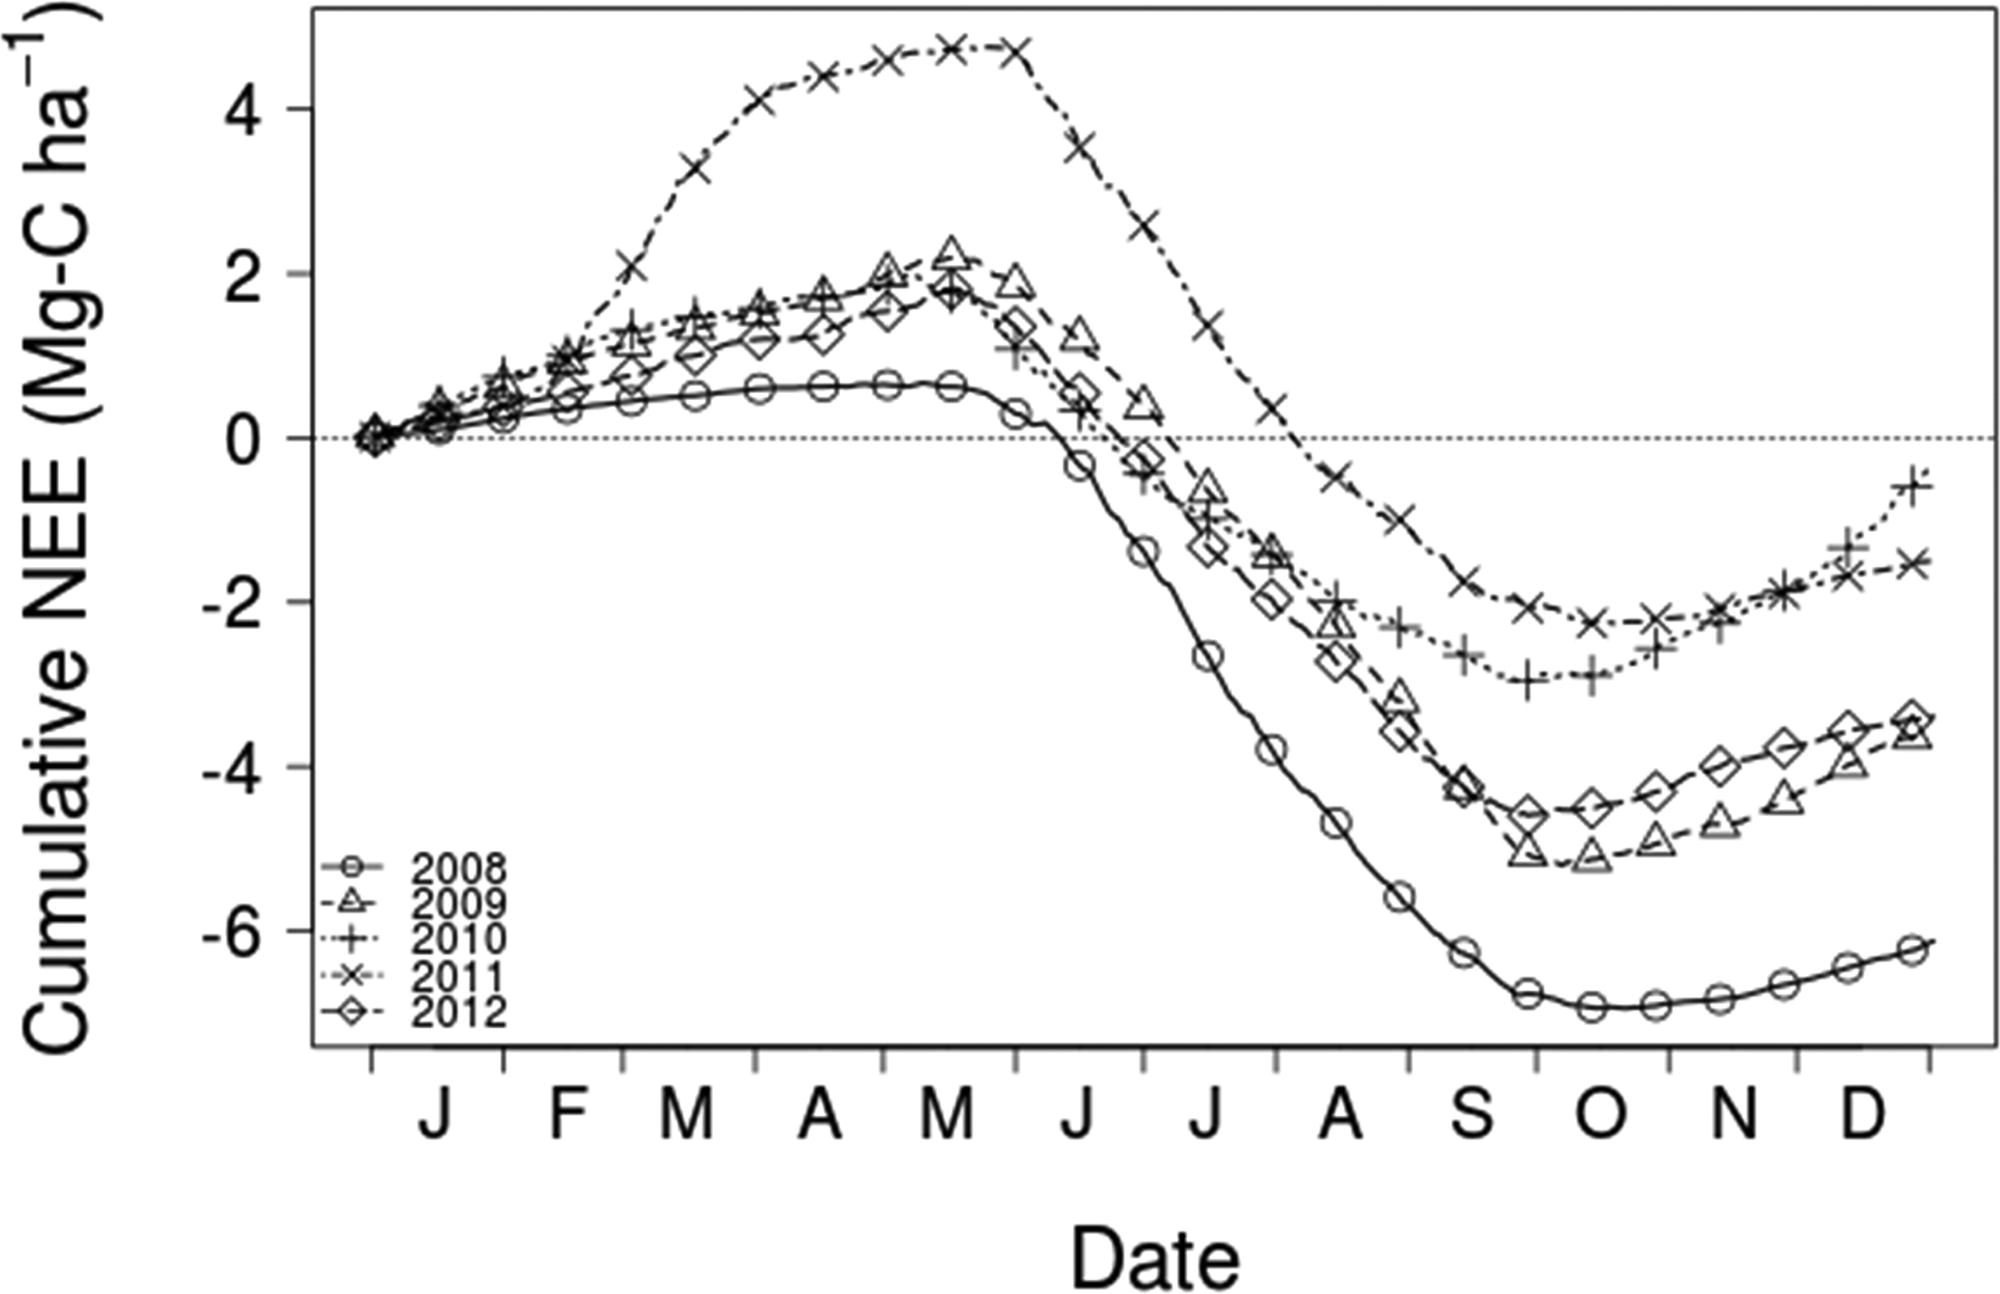
Fig. 3.
Cumulative Net Ecosystem Exchange of the Harvard Forest site US-Ha1 from 2008 to 2012.
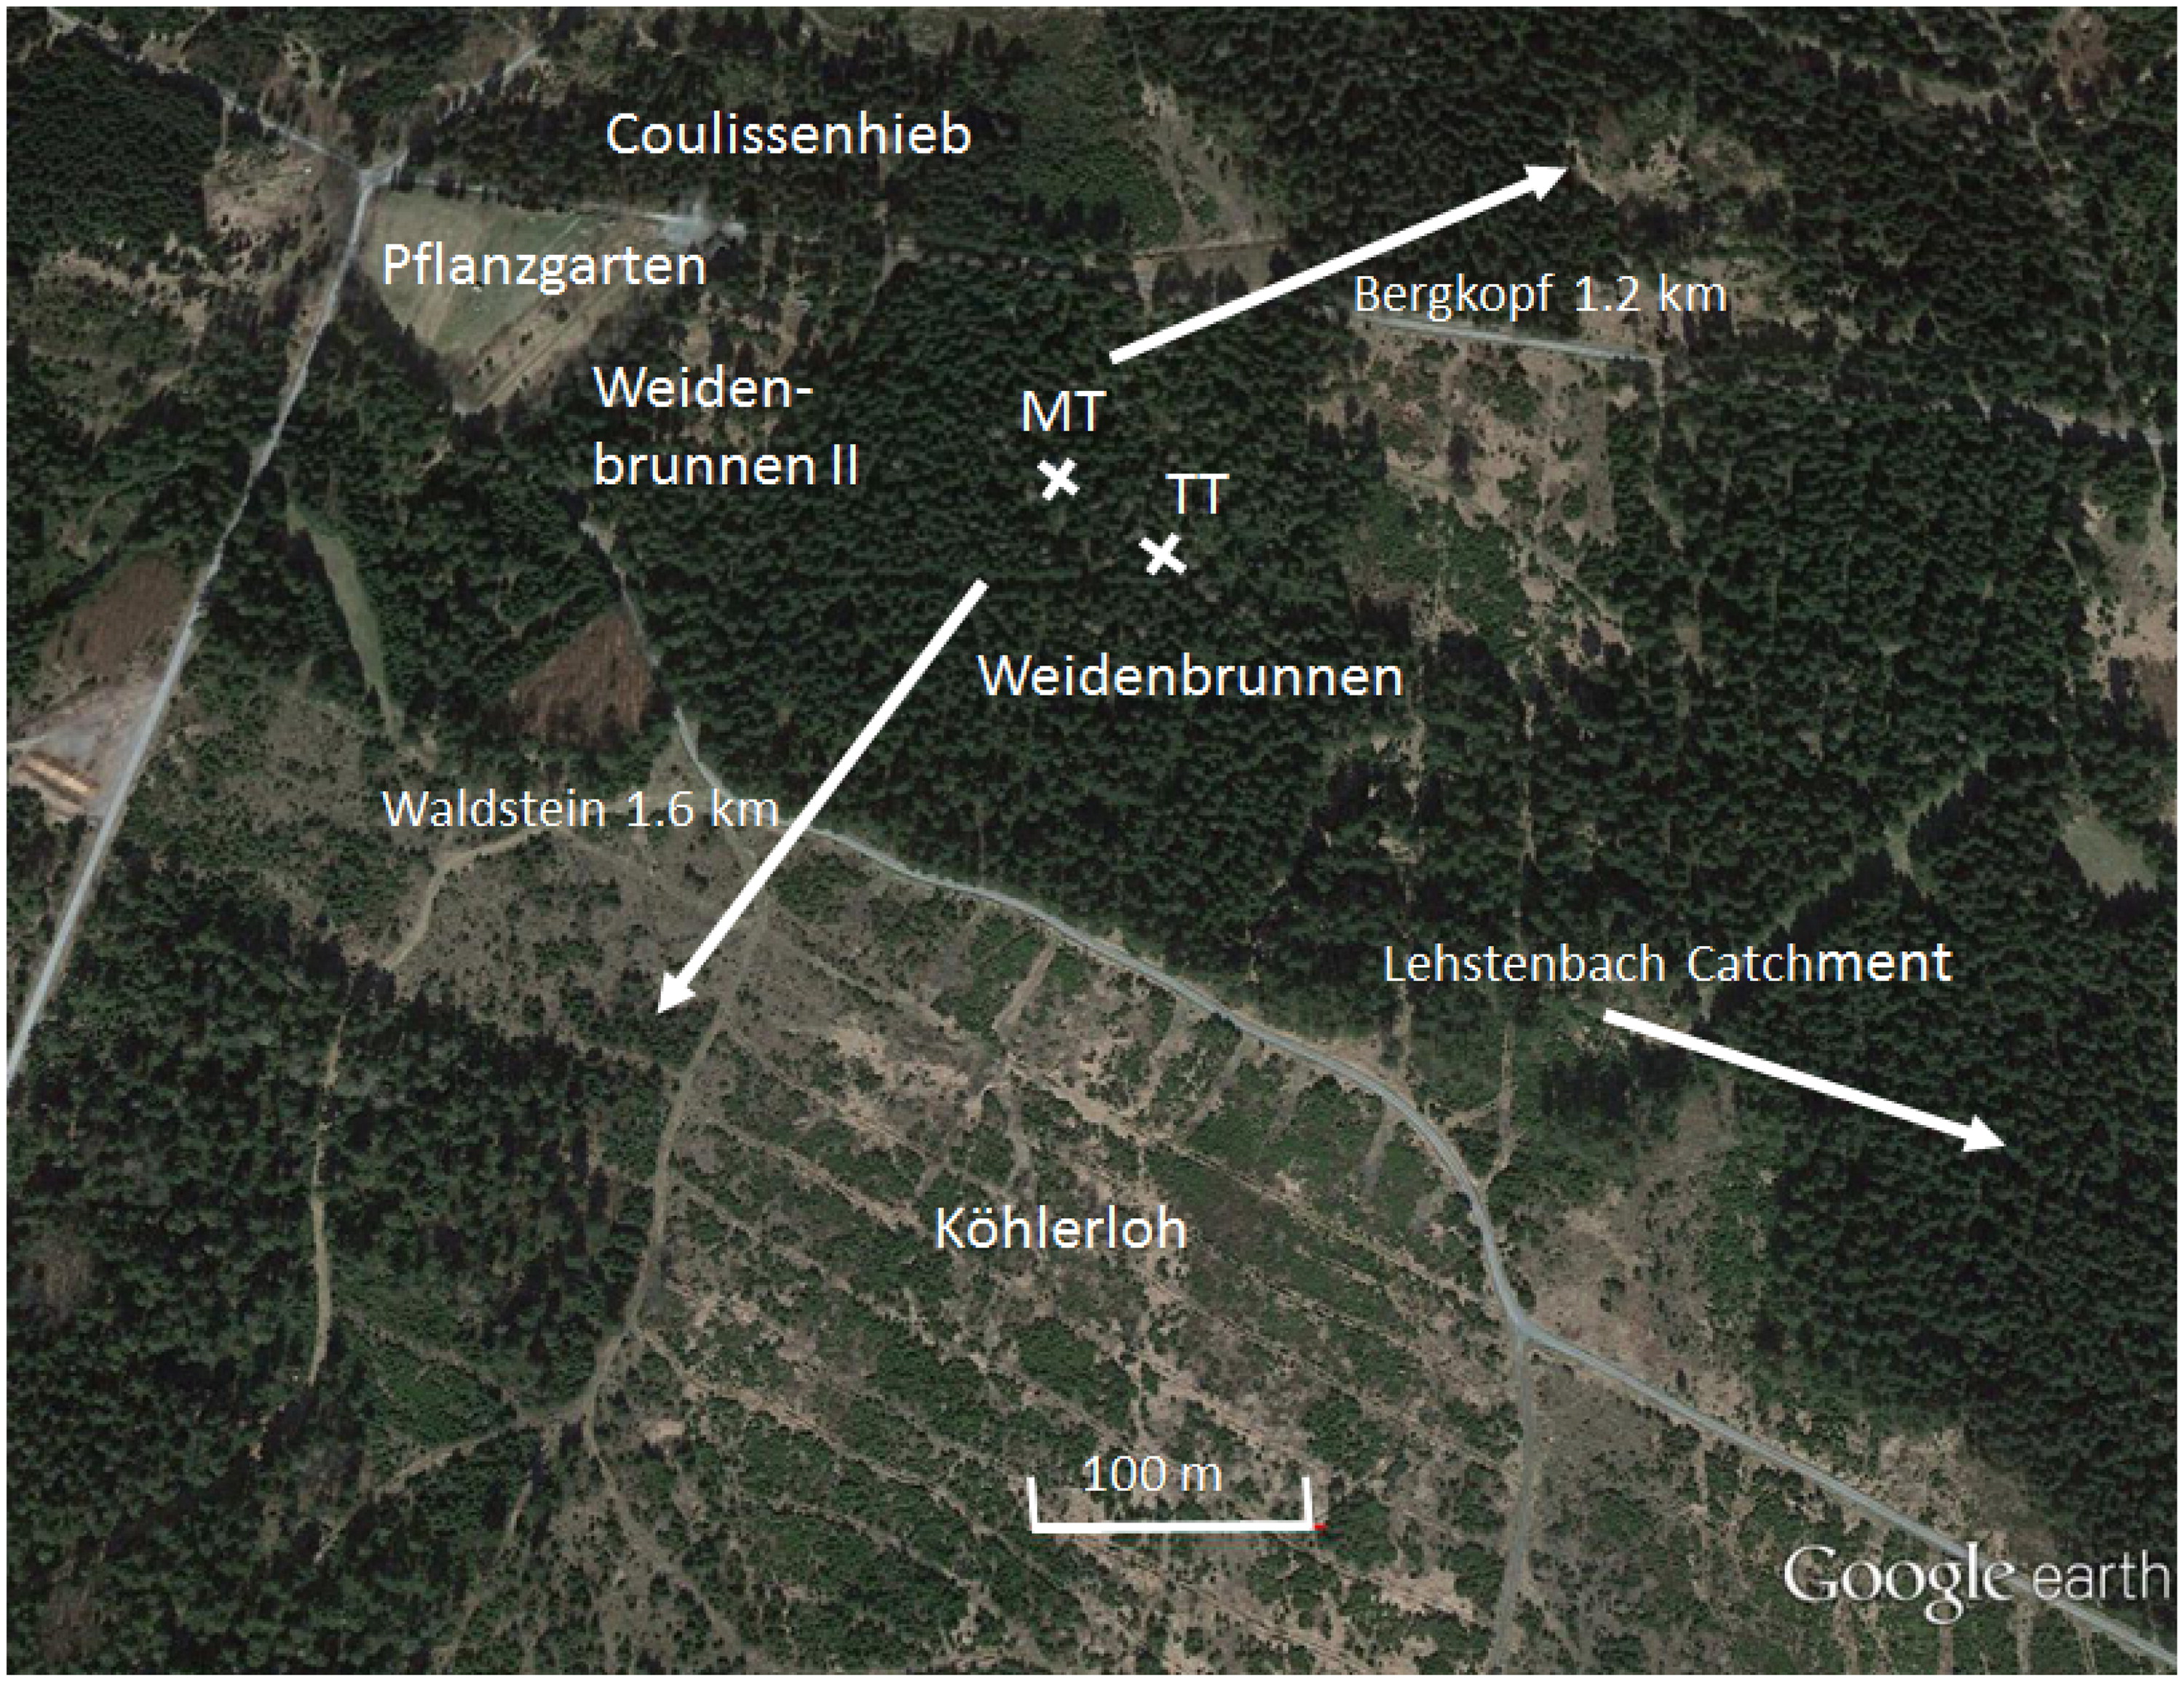
Fig. 4.
Areal view of the DE_Bay site (photograph from April 19, 2015, showing nearly no changes since 2007) with the different measuring sites and the Main Tower (MT, used up to 2007) and the turbulence tower (TT, used since 2007) and the distances to relevant hills Waldstein and Bergkopf in the surrounding landscape. The main wind direction is SW. (Foken et al., 2017, published with kind permission of © Google earth and Springer).
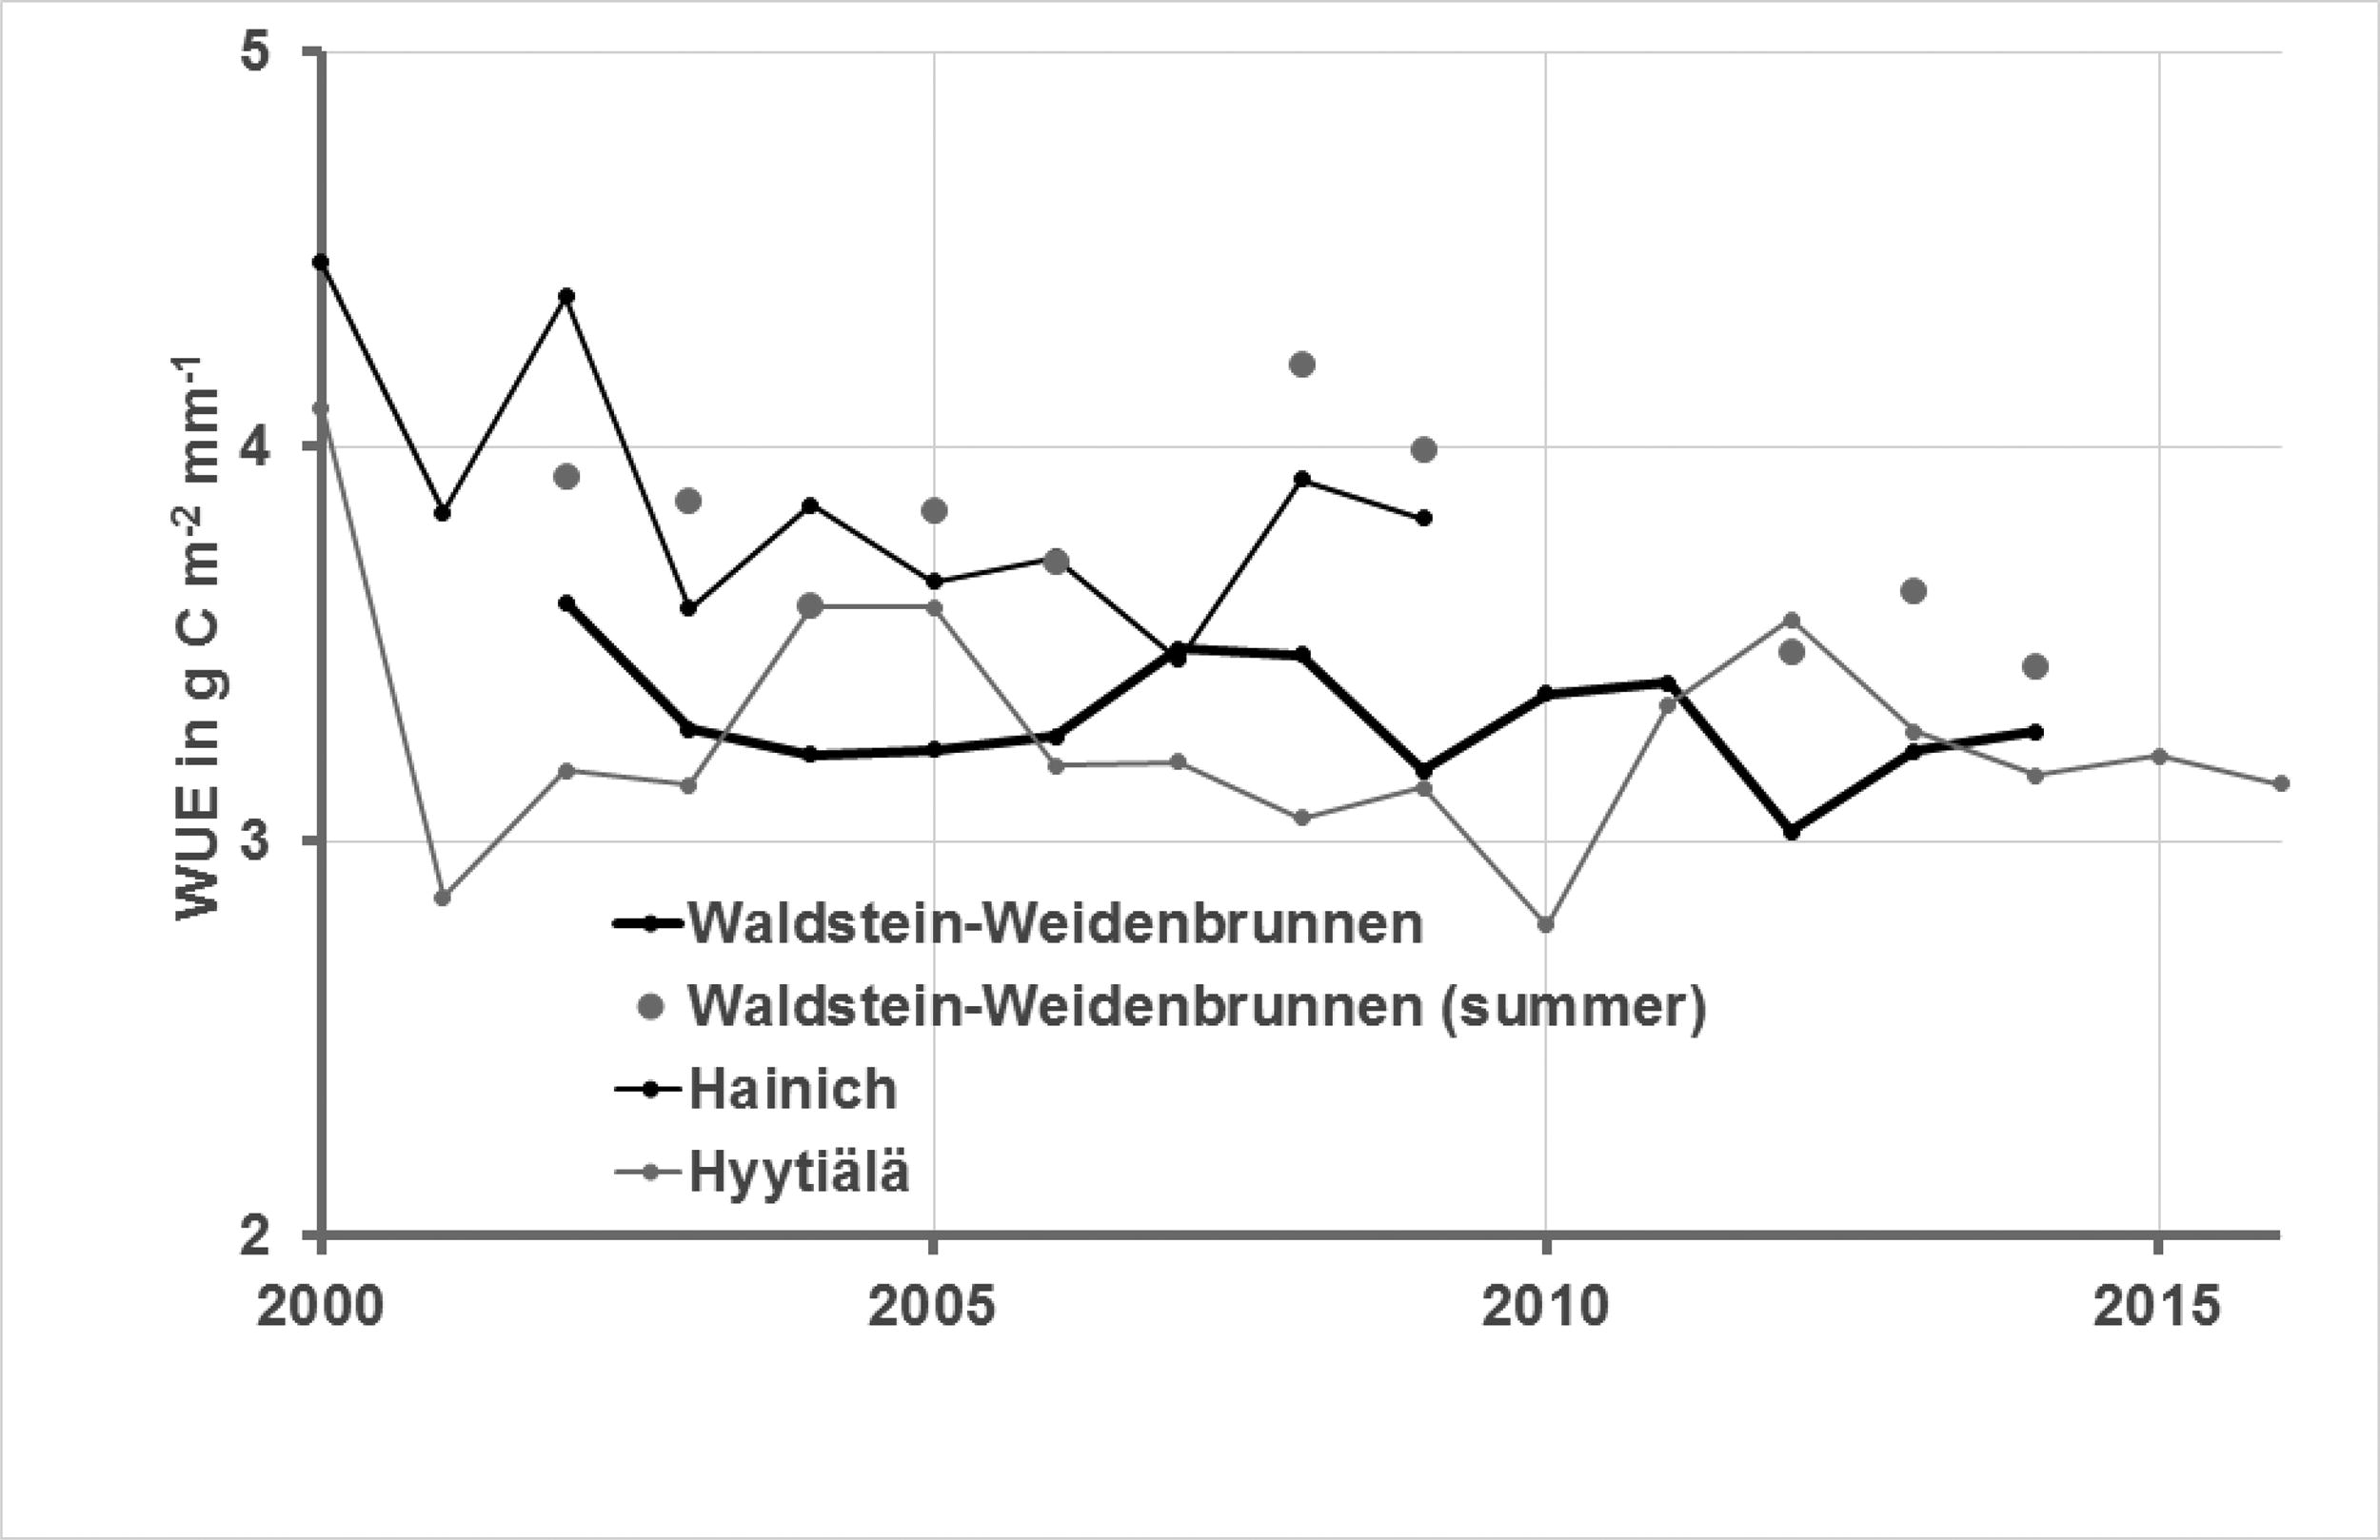
Fig. 5.
Water use efficiency of three sites calculated as the ratio of annual sums of GPP and ET. Because of this simplification, for Waldstein-Weidenbrunnen site measurements in summer were calculated from the available single measured data (not gap-filled).