Have a personal or library account? Click to login
Absorbing aerosols over Asia – an inter-model and model-observation comparison study using CAM5.3-Oslo Cover

Absorbing aerosols over Asia – an inter-model and model-observation comparison study using CAM5.3-Oslo

Open Access
|Jan 2021

Figures & Tables

Table 1.

Summary and short description of the used AERONET data.

Station nameLocationVariableSite classificationMeas. typeMeas. periodKanpurNorthern IndiaAODUrbanRemote sensing2001–2018(26.45 N, 80.33E)AAODPolluted(AERONET)BeijingEastern ChinaAODUrbanRemote sensing2001–2018(39.98 N, 16.38E)AAODPolluted(AERONET)KarachiPakistanAODUrbanRemote sensing2006–2014(24.95 N, 67.14E)AAODCoast(AERONET)Solar VillageSaudi ArabiaAODContinentalRemote sensing1999–2013(24.9 N, 46.39E)AAODDesert(AERONET)PokharaNepalAODContinentalRemote sensing2010–2018(28.19 N, 83.98E)AAODMountain(AERONET)Chiang MaiThailandAODUrbanRemote sensing2007–2017(18.77 N, 98.97E)AAODElevated(AERONET)
Table 2.

Summary and short description of MERRA-2 and AeroCom phase III models.

Model/ReanalysisMERRA-2CAM5.3-OsloGEOS5-assimilateGEOS5-freegcmHadGEM3-GA7.1Short nameMERRA-2CAM5.3-OsloGEOS-AGEOS-FHadGEMSpatial resolution0.5 × 0.5°, L721 × 1°, L300.5 × 0.5°, L720.5 × 0.5°, L72N216 (60 km), L85BC refractive index1.75 − 0.44ia1.95 − 0.79i1.75 − 0.44ia1.75 − 0.44ia1.85 − 0.71ibOA refractve index1.53 − 0.009ia1.53 − 0.006i1.53 − 0.009ia1.53 − 0.009ia1.5–0ibDust refractive index1.53 − 0.0026ia1.53 − 0.0055i1.53 − 0.0026ia1.53 − 0.0026ia1.52 − 0.0015ibReferencesMolod et al. (2015)Kirkevåg et al.Molod et al. (2015)Molod et al. (2015)Williams et al. (2018)Randles et al. (2017)(2018)

The refractive index is given for 550 nm.

a Veselovskii et al. (2018).

b Mollard (2018).

Table 3.

Summary and short description of the control and sensitivity experiments.
Experiment nameExperiment descriptionControlControlControl nudged simulation from 2006 to 2012EmissionsCMIP6_PDCMIP6 aerosol emissions from 2000CMIP6_transientCMIP6 aerosol emissions are synchronous with the simulated yearOM-OC_1.7Factor for conversion of OC emissions to organic matter set to 1.7 for all emission sourcesDUemissions_tunedTuning of dust emissions, halved emission fluxesMeteorologyERA5Nudged with ERA5 instead of ERA-interimAMIPAMIP-type simulationDepositionBCscav_lowerBelow-cloud scavenging coefficient of BC decreased by a factor of 2DUscav_higherBelow-cloud scavenging coefficient of dust increased by a factor of 2DUdrydep_increasedfall velocity for dust increased by 10%OpticsBCrefrac_1.0Imaginary part of the BC refractive index at 550 nm increased from 0.79 to 1.0OArefrac_MERRAOA refractive index at 550 nm same as in MERRA-2DUrefrac_MERRADust refractive index at 550 nm same as in MERRA-2

[i] The sensitivity experiments are performed only for the year 2010 and compared to the year 2010 of the control simulation.

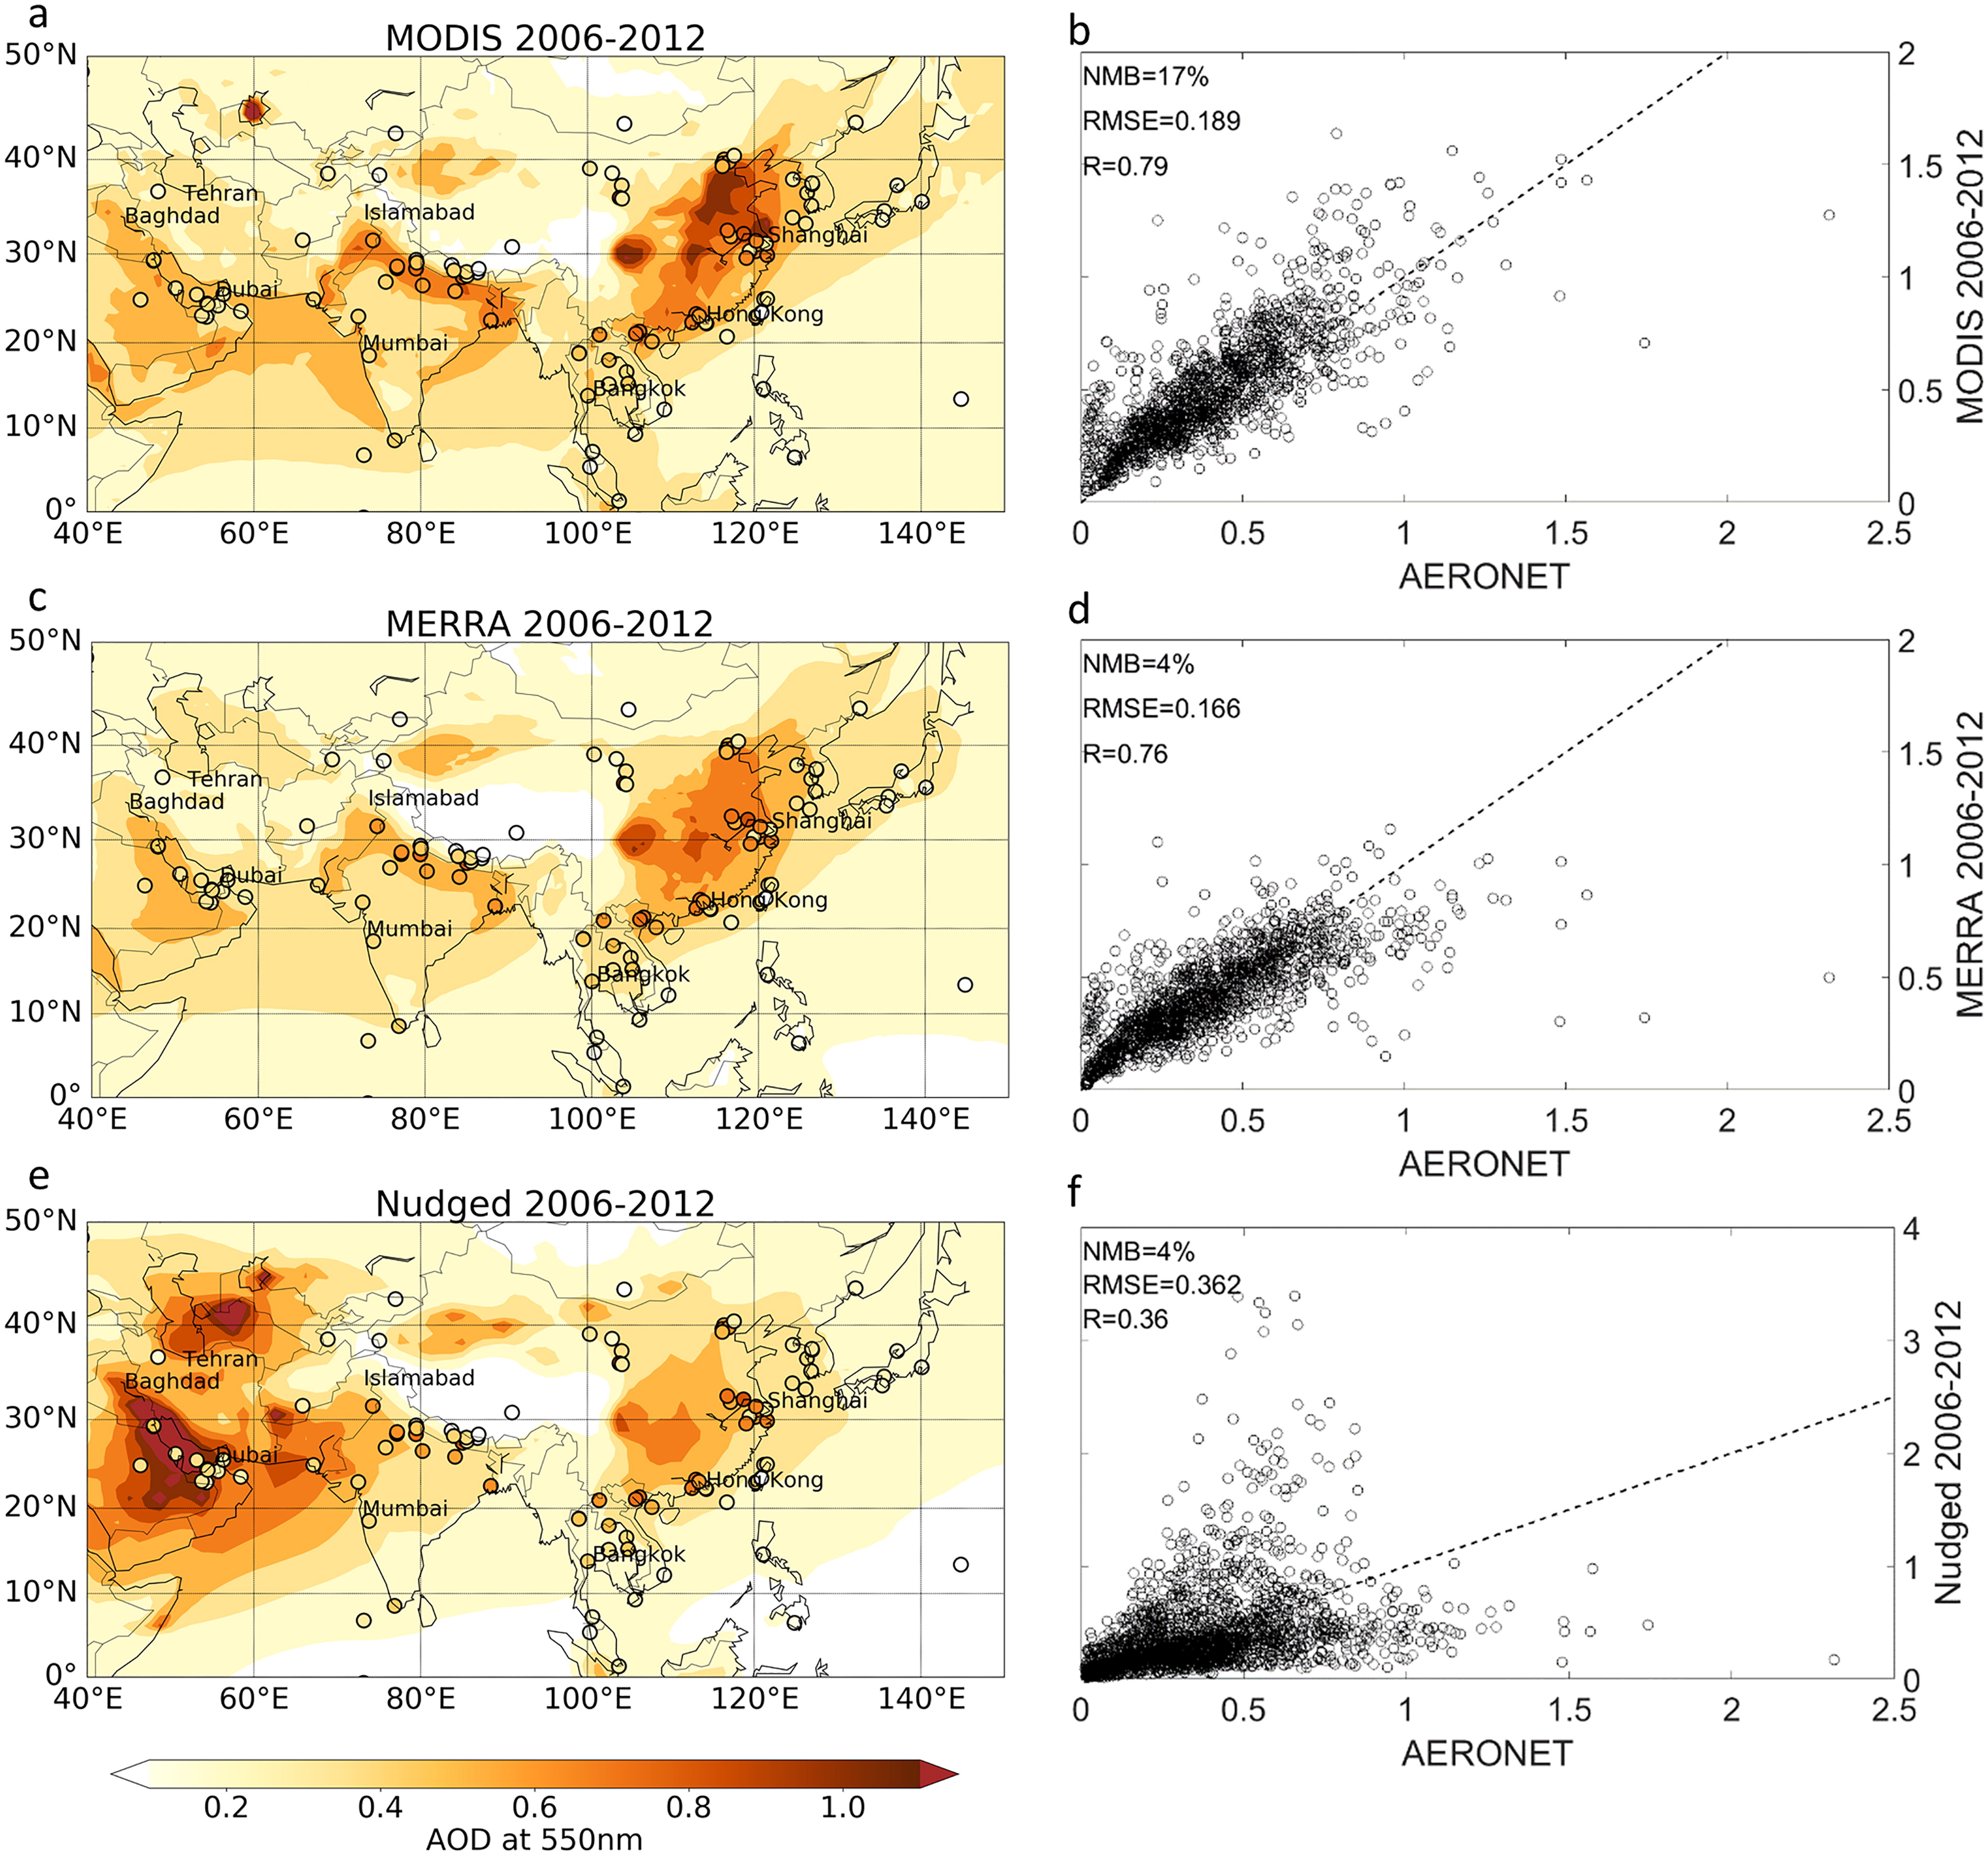
Fig. 1.

Left: Temporal mean of the years 2006 to 2012 of aerosol optical depth (AOD) for MODIS (a), MERRA-2 reanalysis (c) and the model control simulation (e) in the focus region. AERONET observations are illustrated as coloured circles. Right: Scatter plots of MODIS (b), MERRA-2 (d) and modelled AOD (f) against AERONET retrievals (monthly average). Note, the AOD of MODIS, MERRA-2 and AERONET is clear-sky while the modelled AOD is for all-sky.
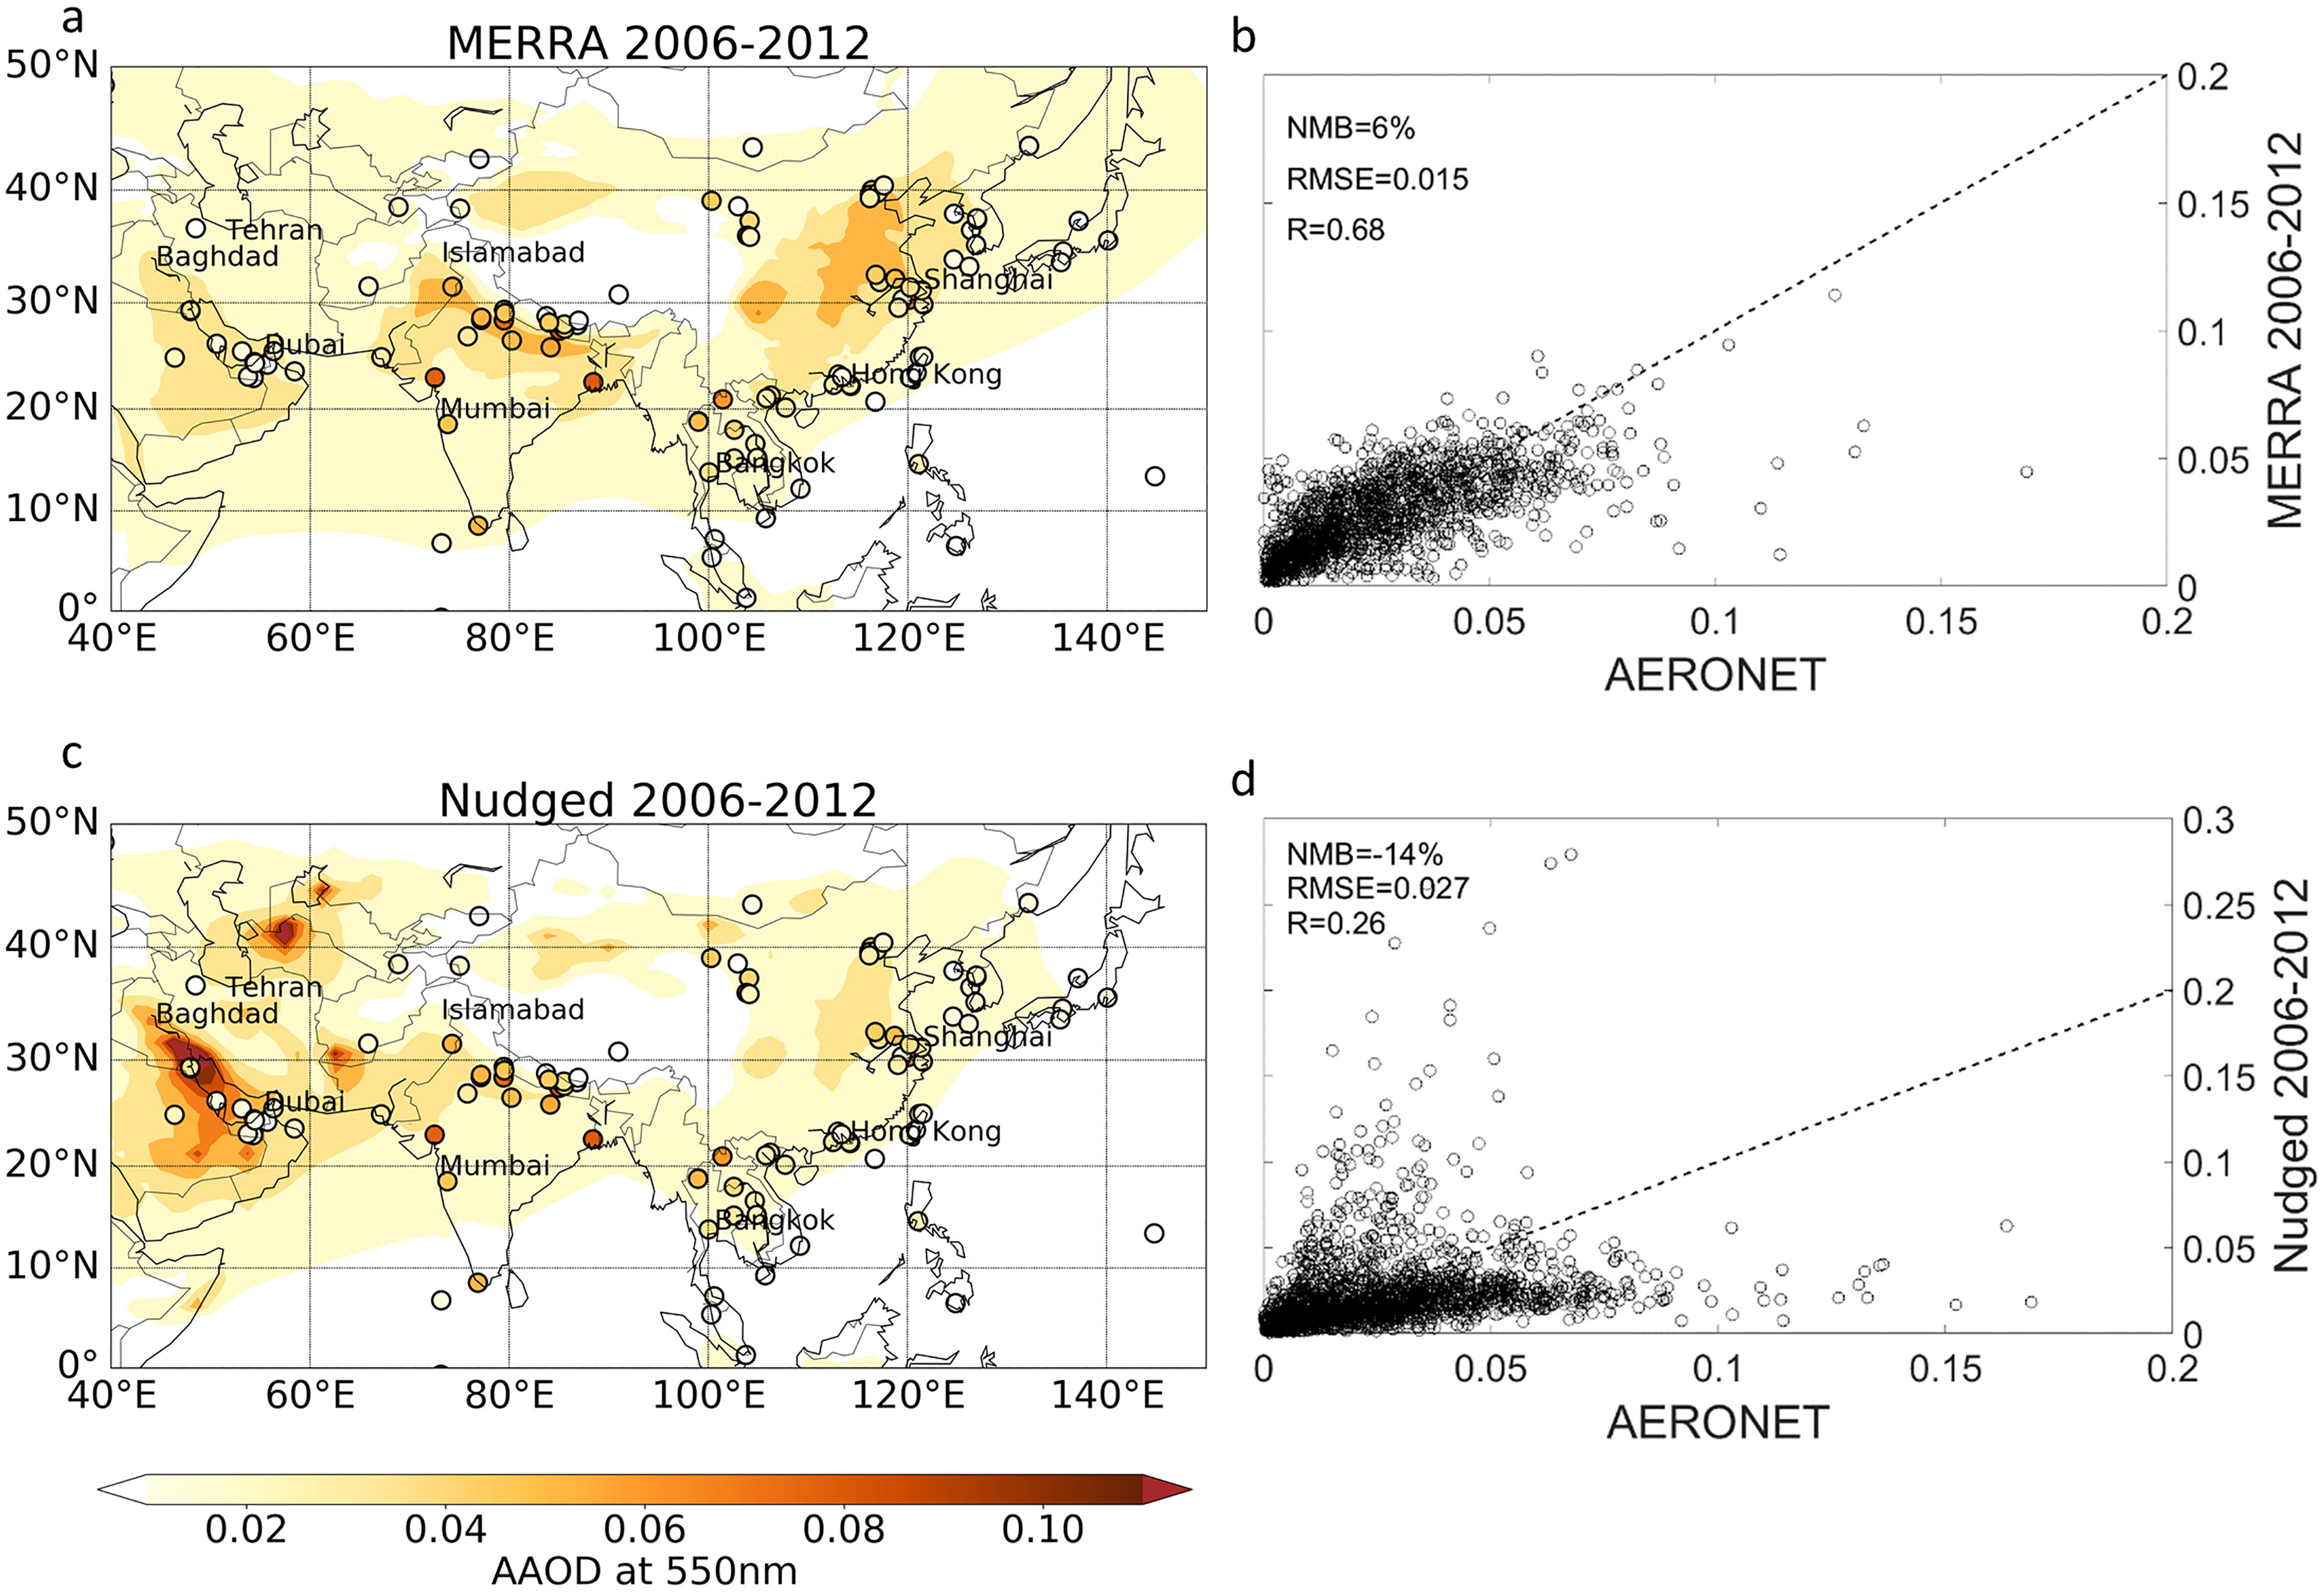
Fig. 2.

Left: Temporal mean of the years 2006 to 2012 of absorption aerosol optical depth (AAOD) for MERRA-2 reanalysis (a) and the model control simulation (c) in the focus region. AERONET observations are illustrated as coloured circles. Right: Scatter plots of MERRA-2 (b) and modelled AAOD (d) against AERONET retrievals (monthly average). Note, the AAOD of MERRA-2 and AERONET is clear-sky while the modelled AAOD is for all-sky.
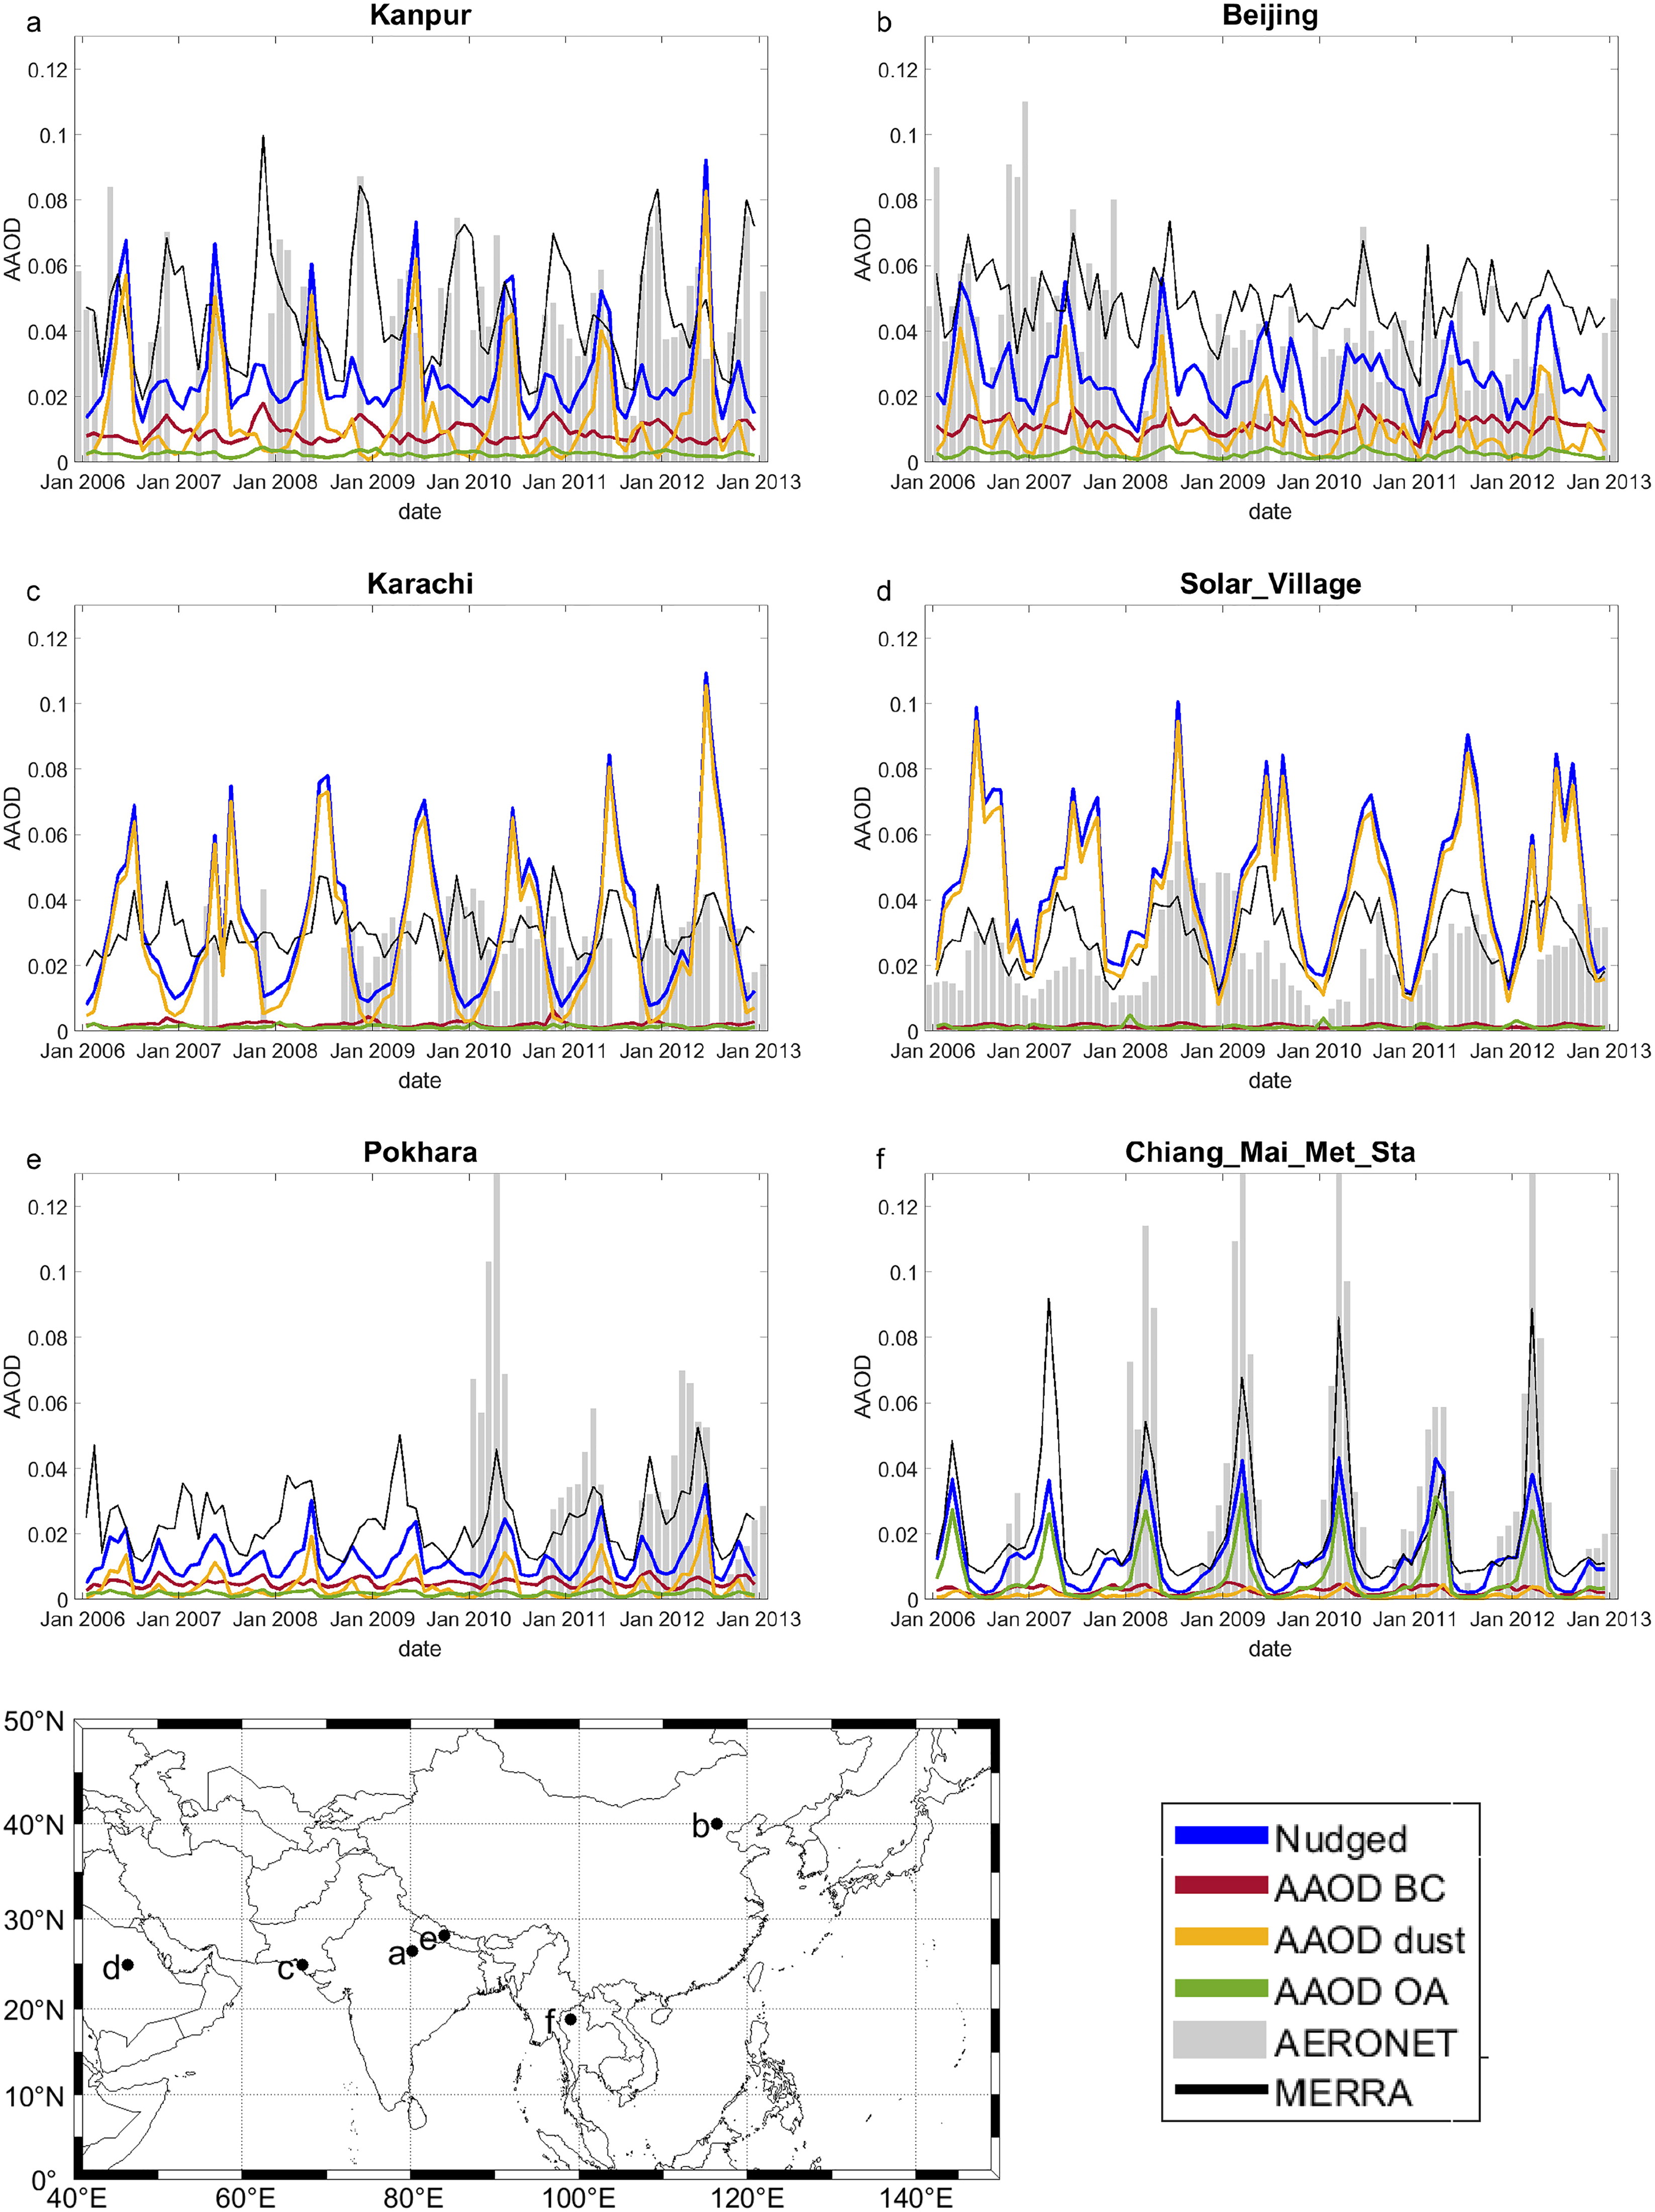
Fig. 3.

AAOD timeseries from the nudged control (blue) and AMIP (black, dashed) simulations compared to AERONET (grey bars) and MERRA-2 (grey line) AAOD monthly means (Level 1.5) of selected AERONET stations. The AAOD contribution of BC (red), dust (yellow) and OA (green) to the nudged control simulation is shown as well. Note, the AAOD of BC, OA and dust does not add up to their sum due to the technical realisation of internal mixing in the model. The map in the bottom left corner shows the respective locations of the AERONET stations.
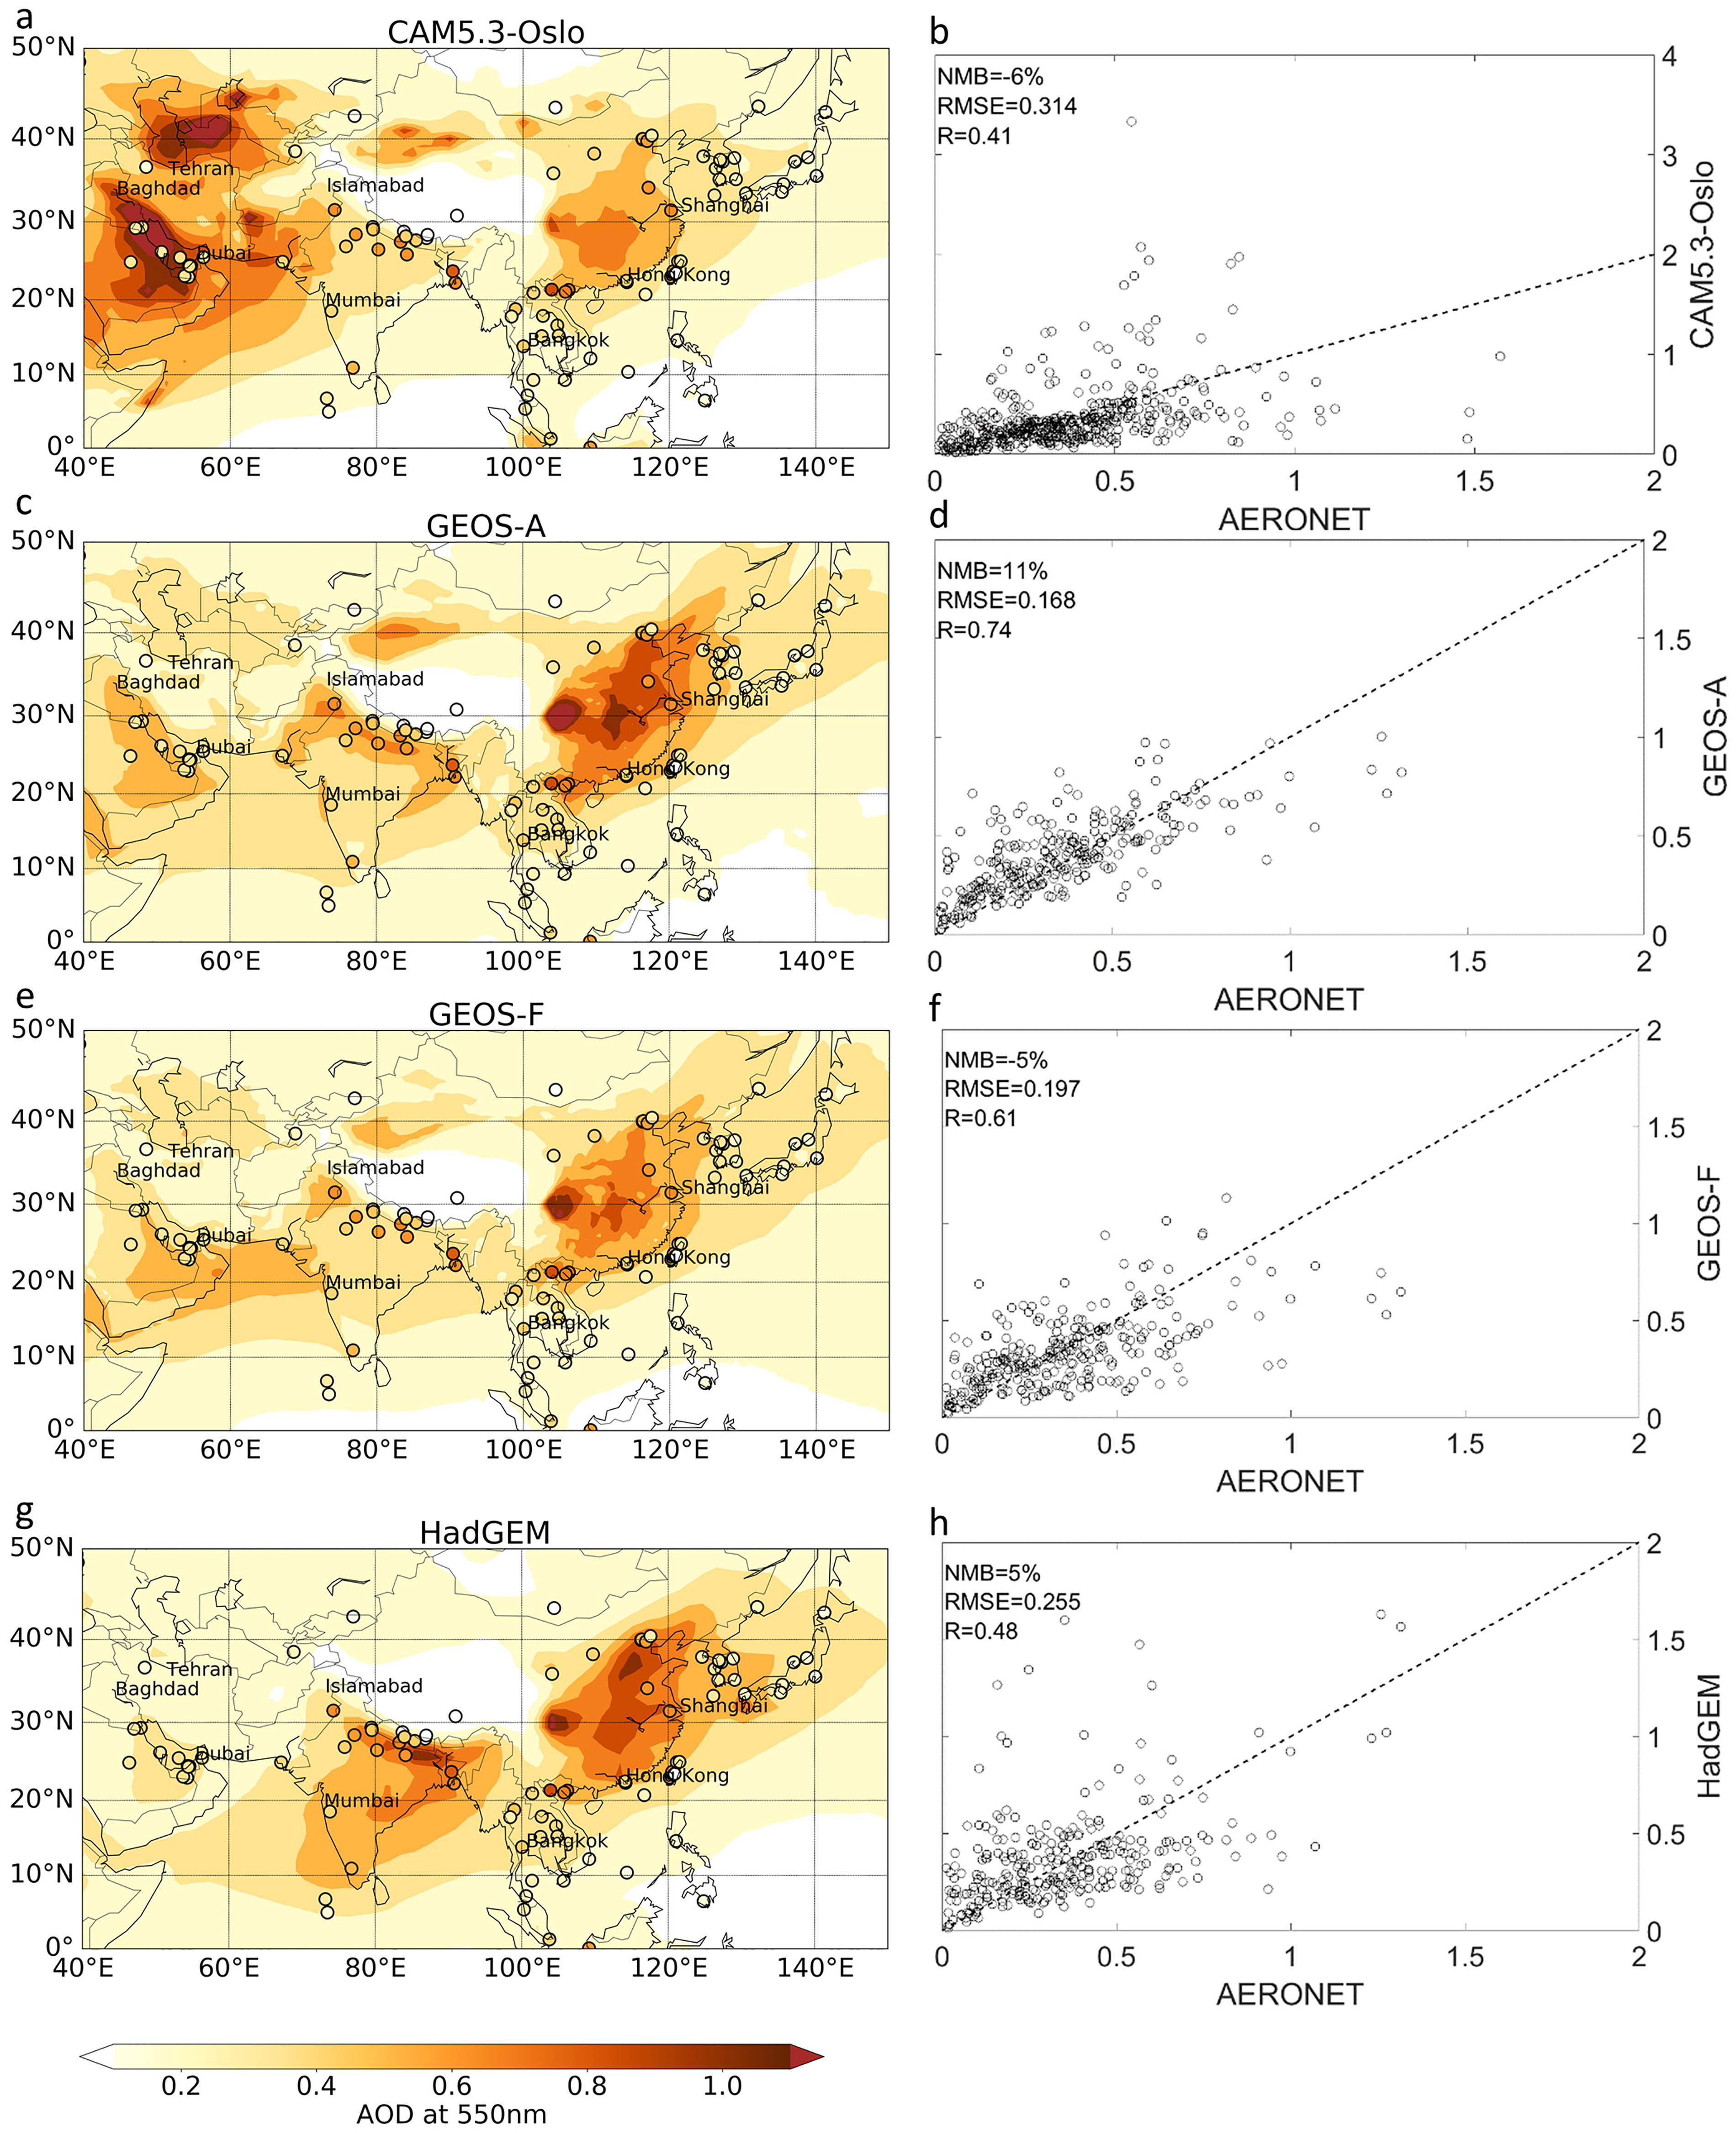
Fig. 4.

Left: Annual mean of the year 2010 of aerosol optical depth (AOD) for four AeroCom phase III models in the focus region (a, c, e, g). Note, HadGEM uses a clear-sky AOD while GEOS and CAM5.3-Oslo use all-sky. AERONET clear-sky AOD observations as annual mean of the year 2010 are illustrated as coloured circles. Right: Scatter plots of modelled AOD against AERONET (monthly average) observations (b, d, f, h).
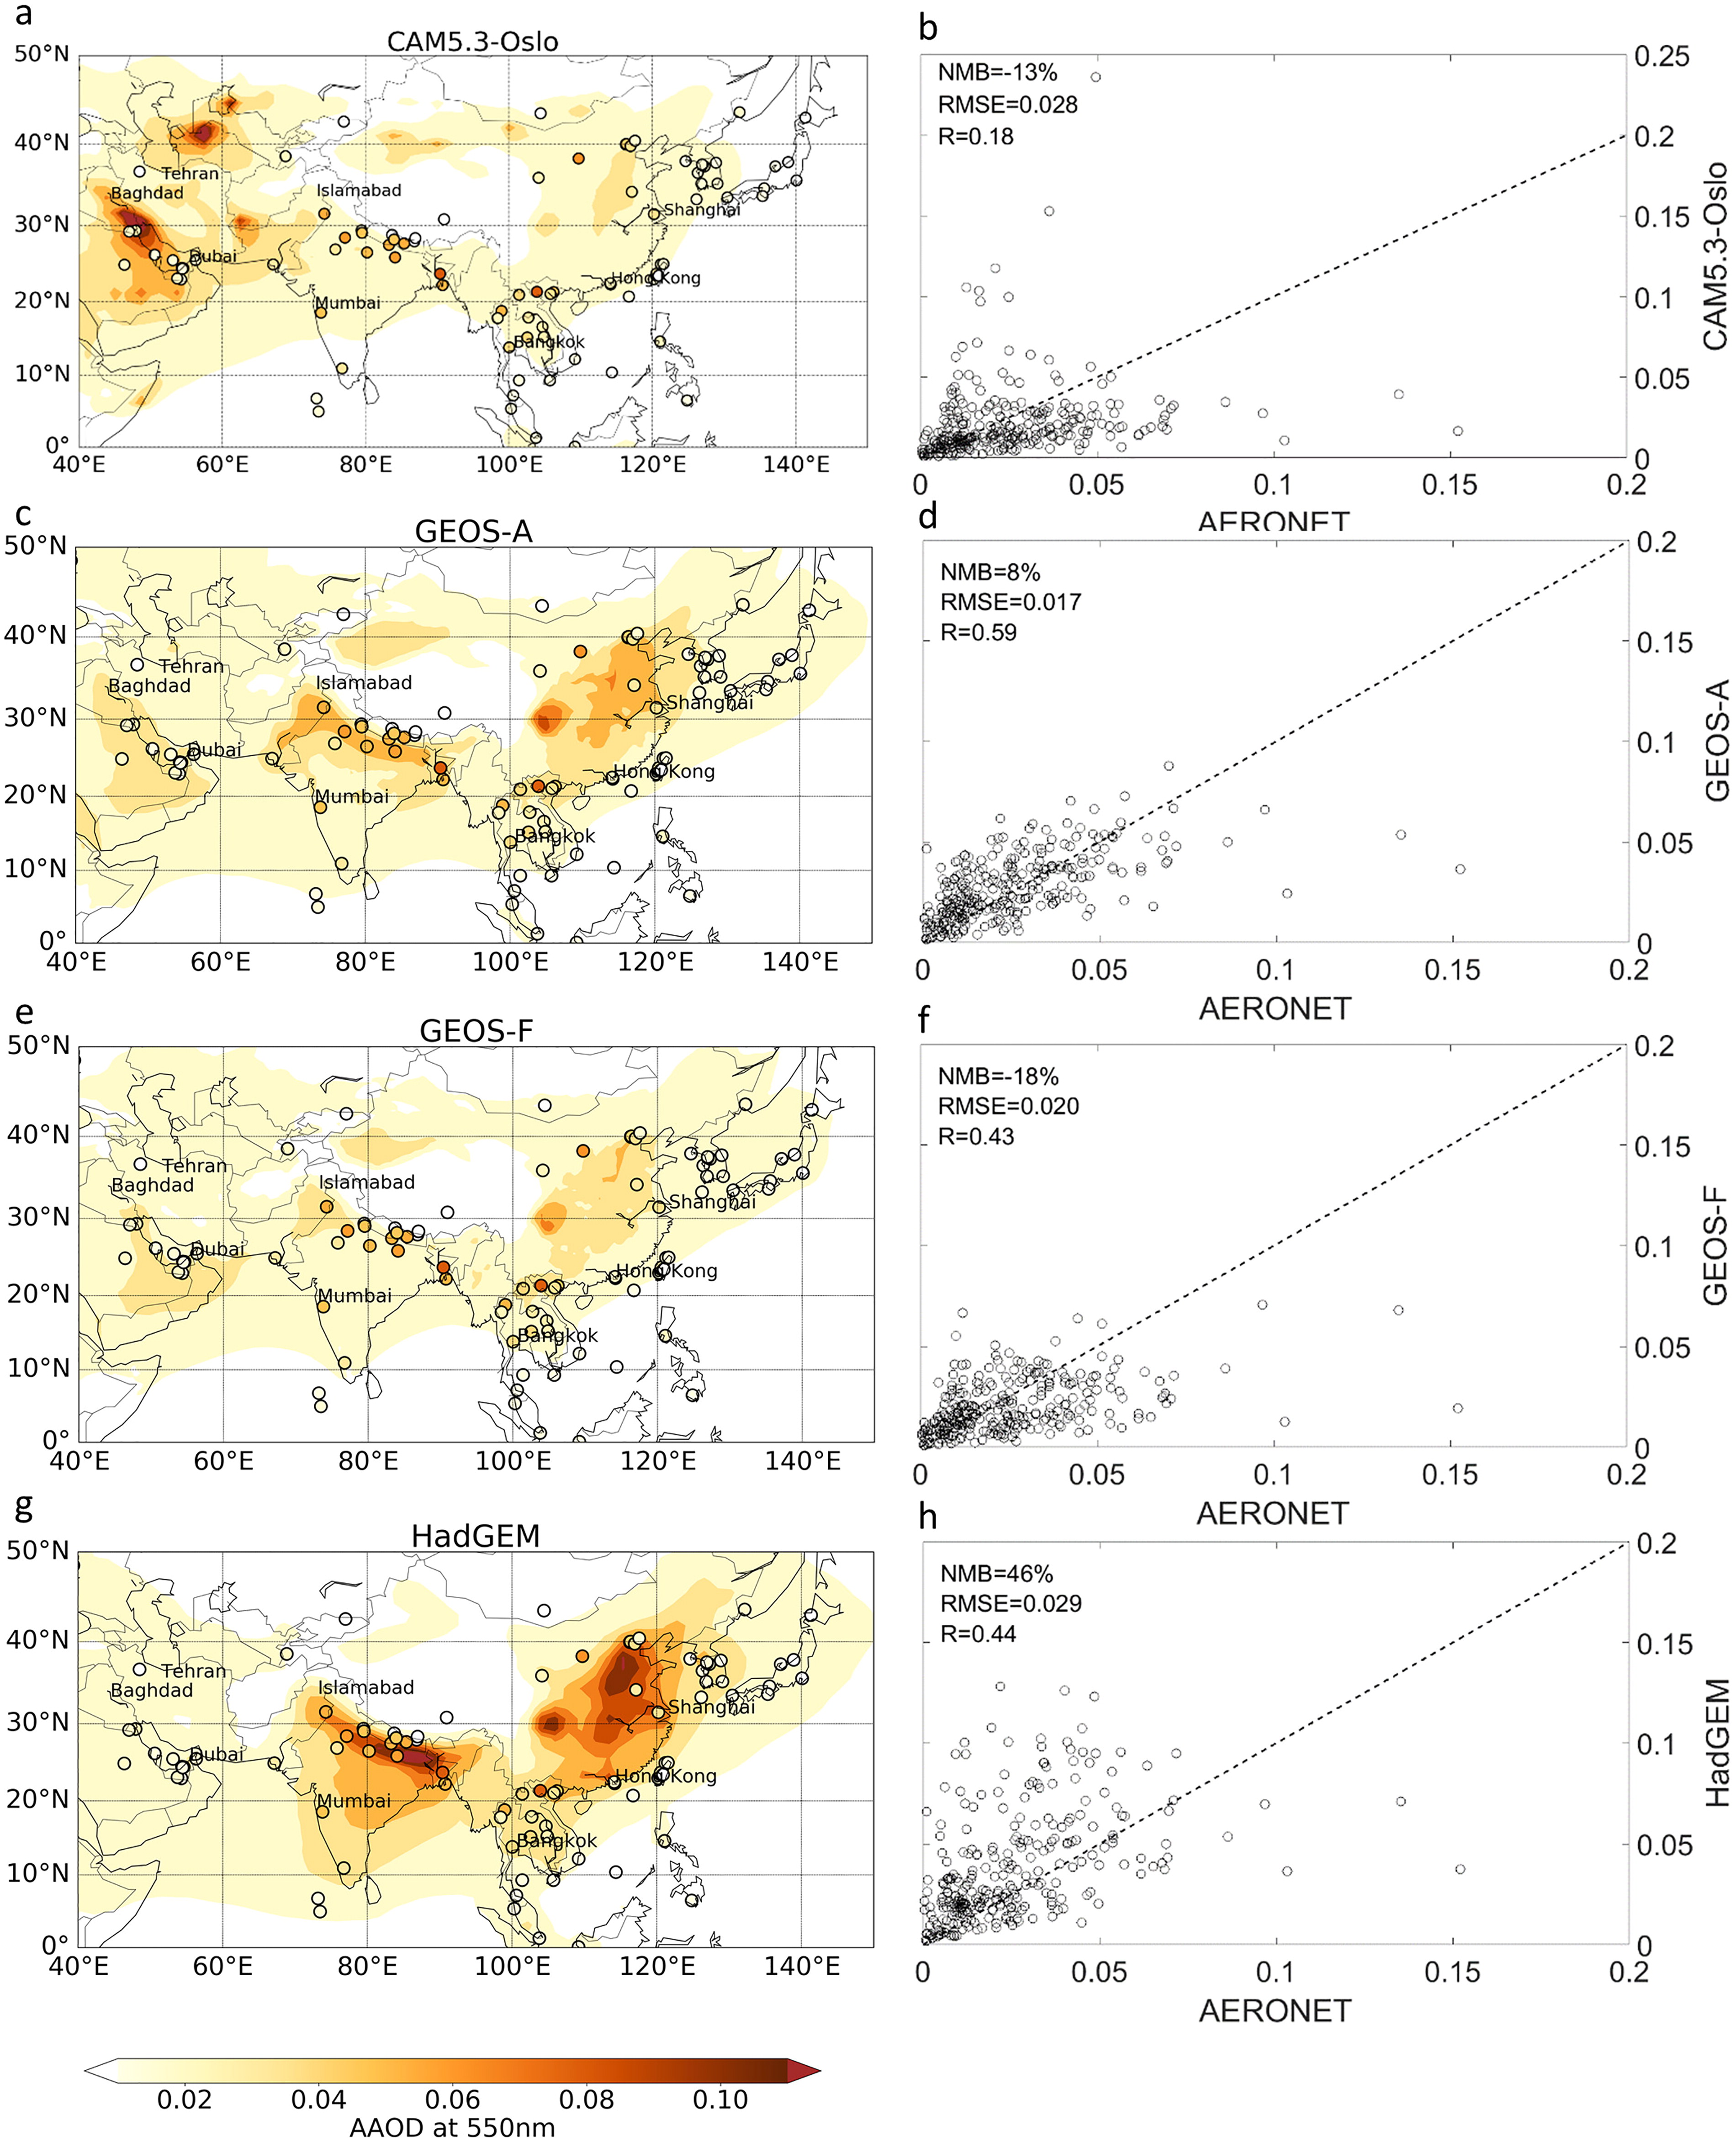
Fig. 5.

Left: Annual mean of the year 2010 of absorption aerosol optical depth (AAOD) for four AeroCom phase III models in the focus region (a, c, e, g). Note, HadGEM uses a clear-sky AOD while GEOS and CAM5.3-Oslo use all-sky. AERONET clear-sky AAOD observations as annual mean of the year 2010 are illustrated as coloured circles. Right (b, d, f, h): Scatter plots of modelled AAOD against AERONET observations (monthly average).

Table 4.

Mean AAOD, normalised mean bias (NMB) and correlation (R) compared to AERONET, aerosol emissions, column burden and residence times for absorbing aerosols for MERRA-2 and AeroCom phase III models on the regional scale for the year 2010.
VariableMERRA-2CAM5.3-OsloGEOS-AGEOS-FHadGEMAAOD0.0140.0120.0150.0120.018NMB (%)6–98–1846R0.680.180.590.430.44BC emissions (kg m–2 s–1)2.2·10121.7·10122.2·10122.2·10122.7·1012OA emissions (kg m–2 s–1)1.2·10119.8·10121.2·10111.2·10111.3·1011Dust emissions (kg m–2 s–1)3.0·10106.8·10102.4·10103.1·10102.8·1010BC burden (kg m–2)1.1·1065.3·1071.1·1067.8·1078.7·107OA burden (kg m–2)5.5·1065.9·1066.1·1064.4·1064.8·106Dust burden (kg m–2)1.1·1049.7·1051.3·1041.2·1042.9·105BC residence time (days)8.15.07.57.95.7OA residence time (days)6.35.08.17.66.2Dust residence time (days)13.11.917.818.31.3
Fig. 6.

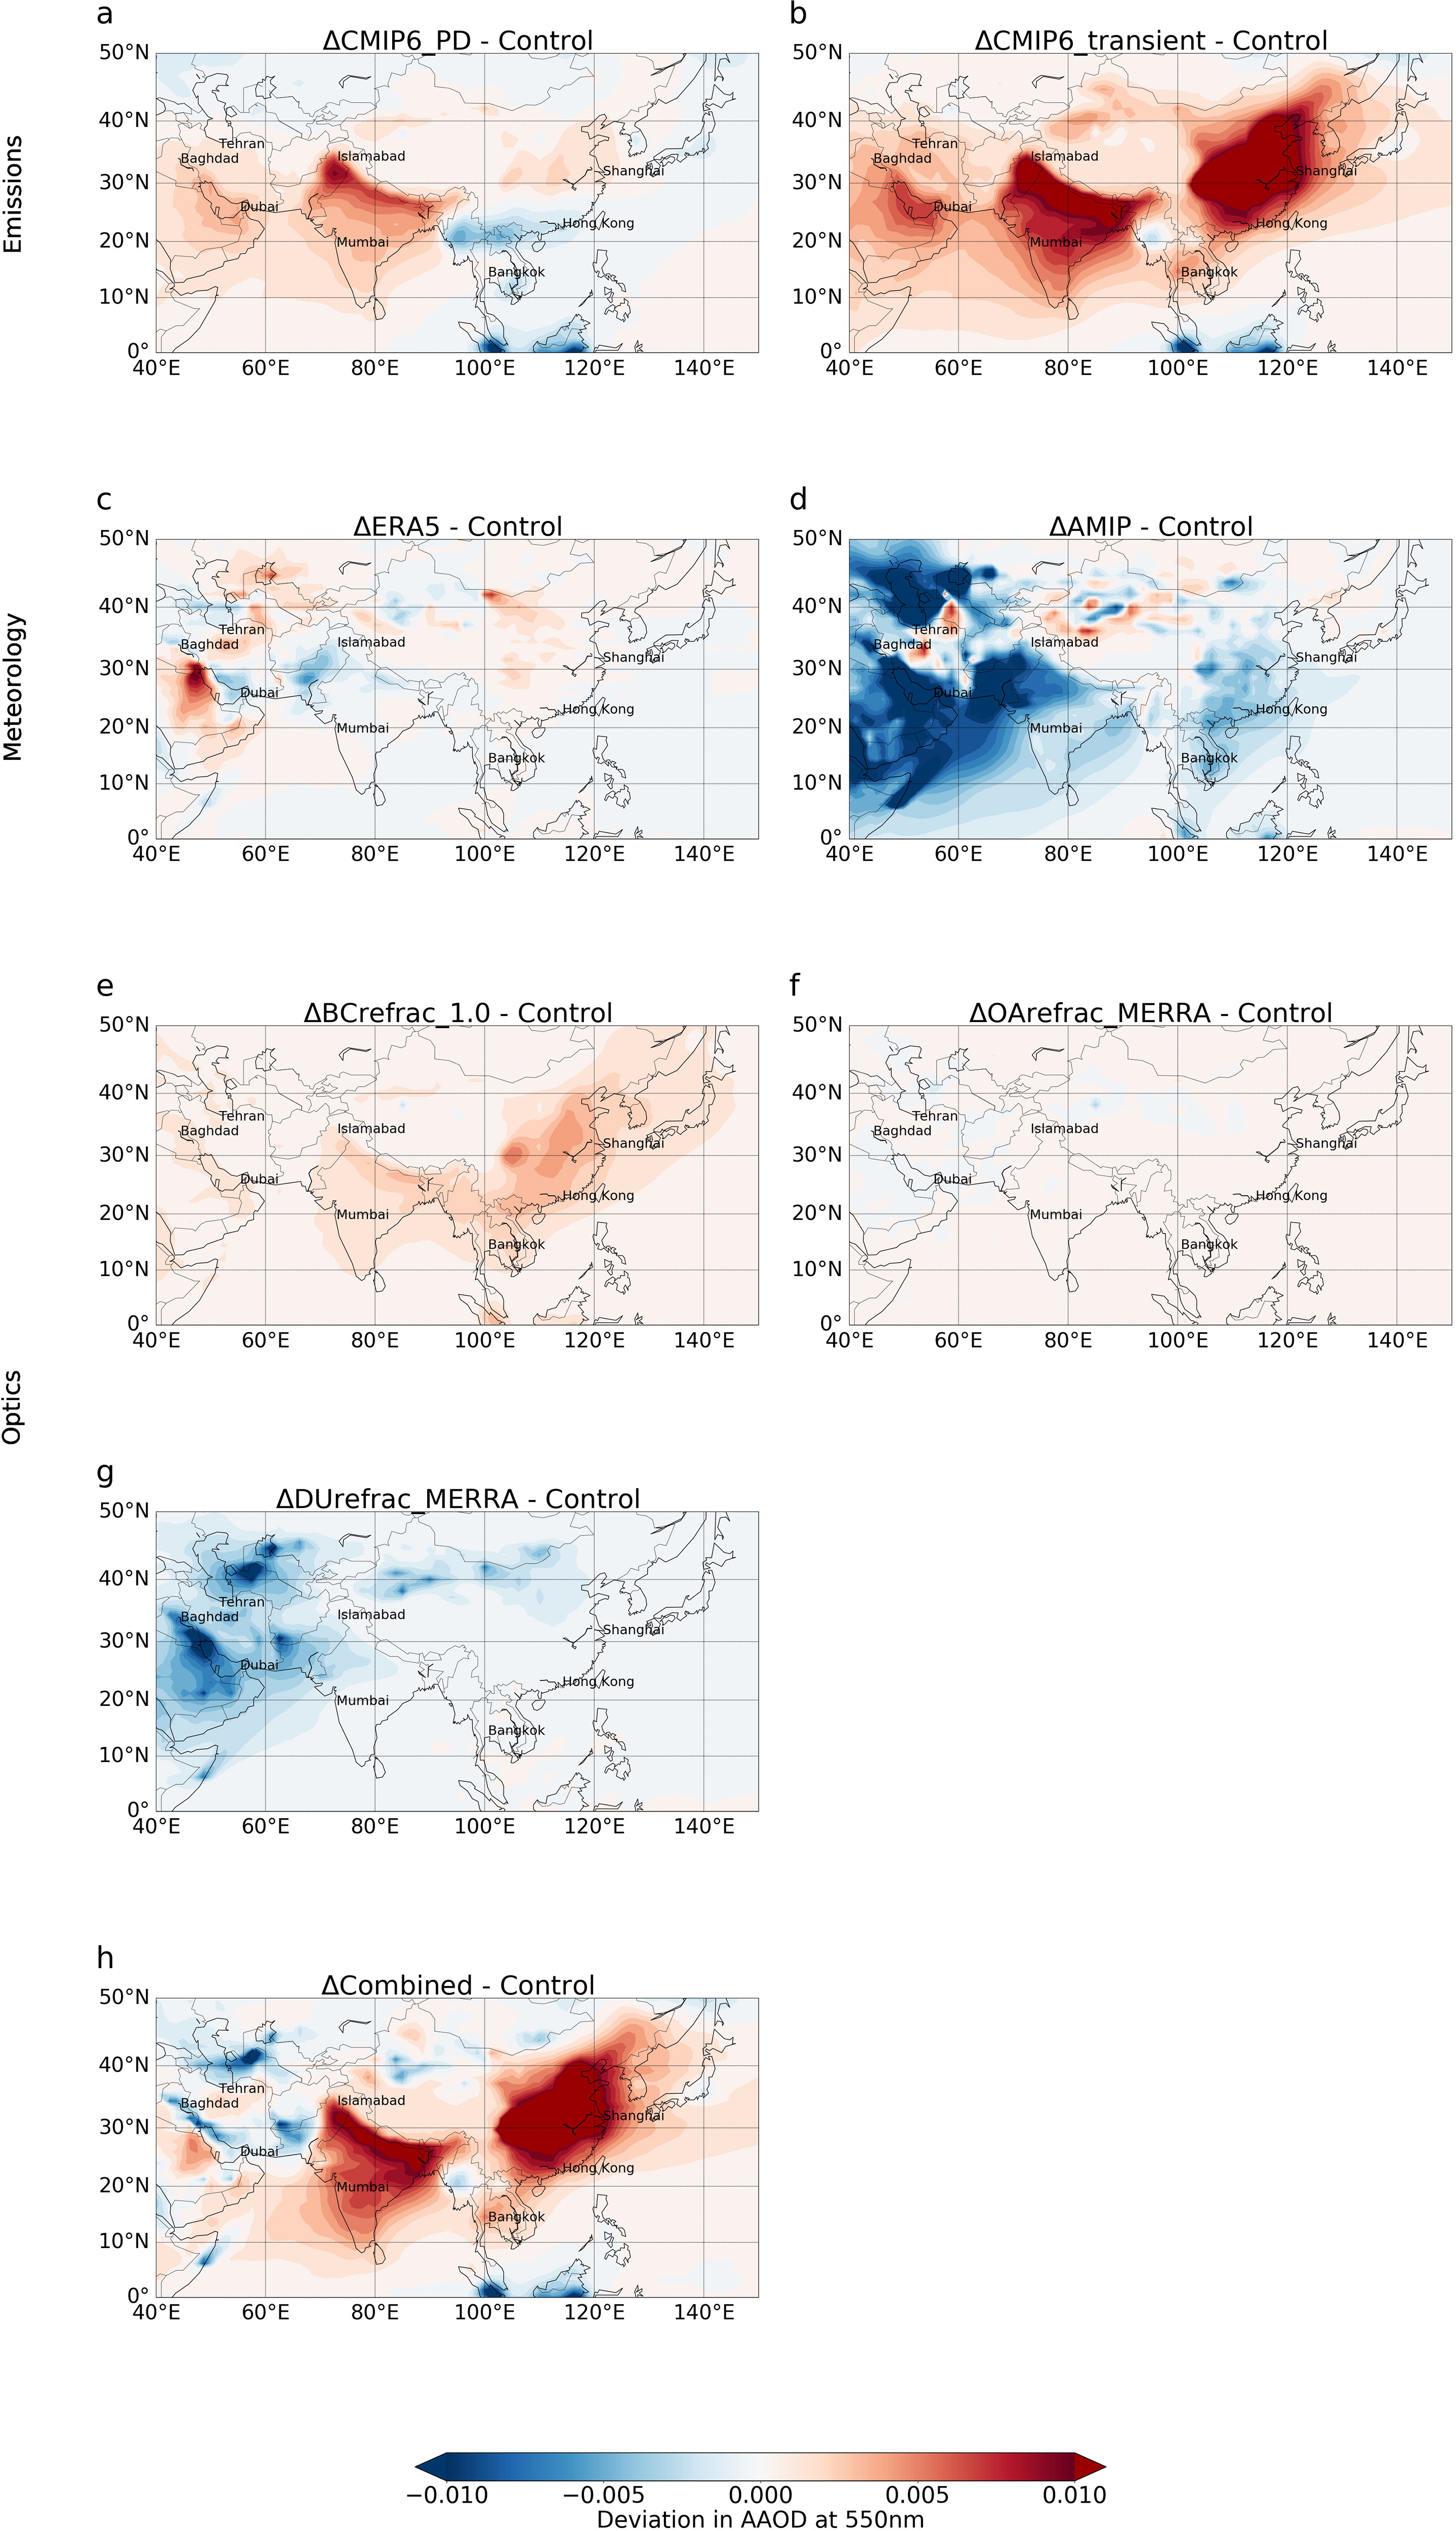
Absolute differences in AAOD between the nudged model control simulation and the model sensitivity experiments in the categories ’Emissions’ (a, b), ’Meteorology’ (c, d), ’Optics’ (e, f, g) as well as one combined sensitivity experiment (h) for the year 2010 in the focus region.
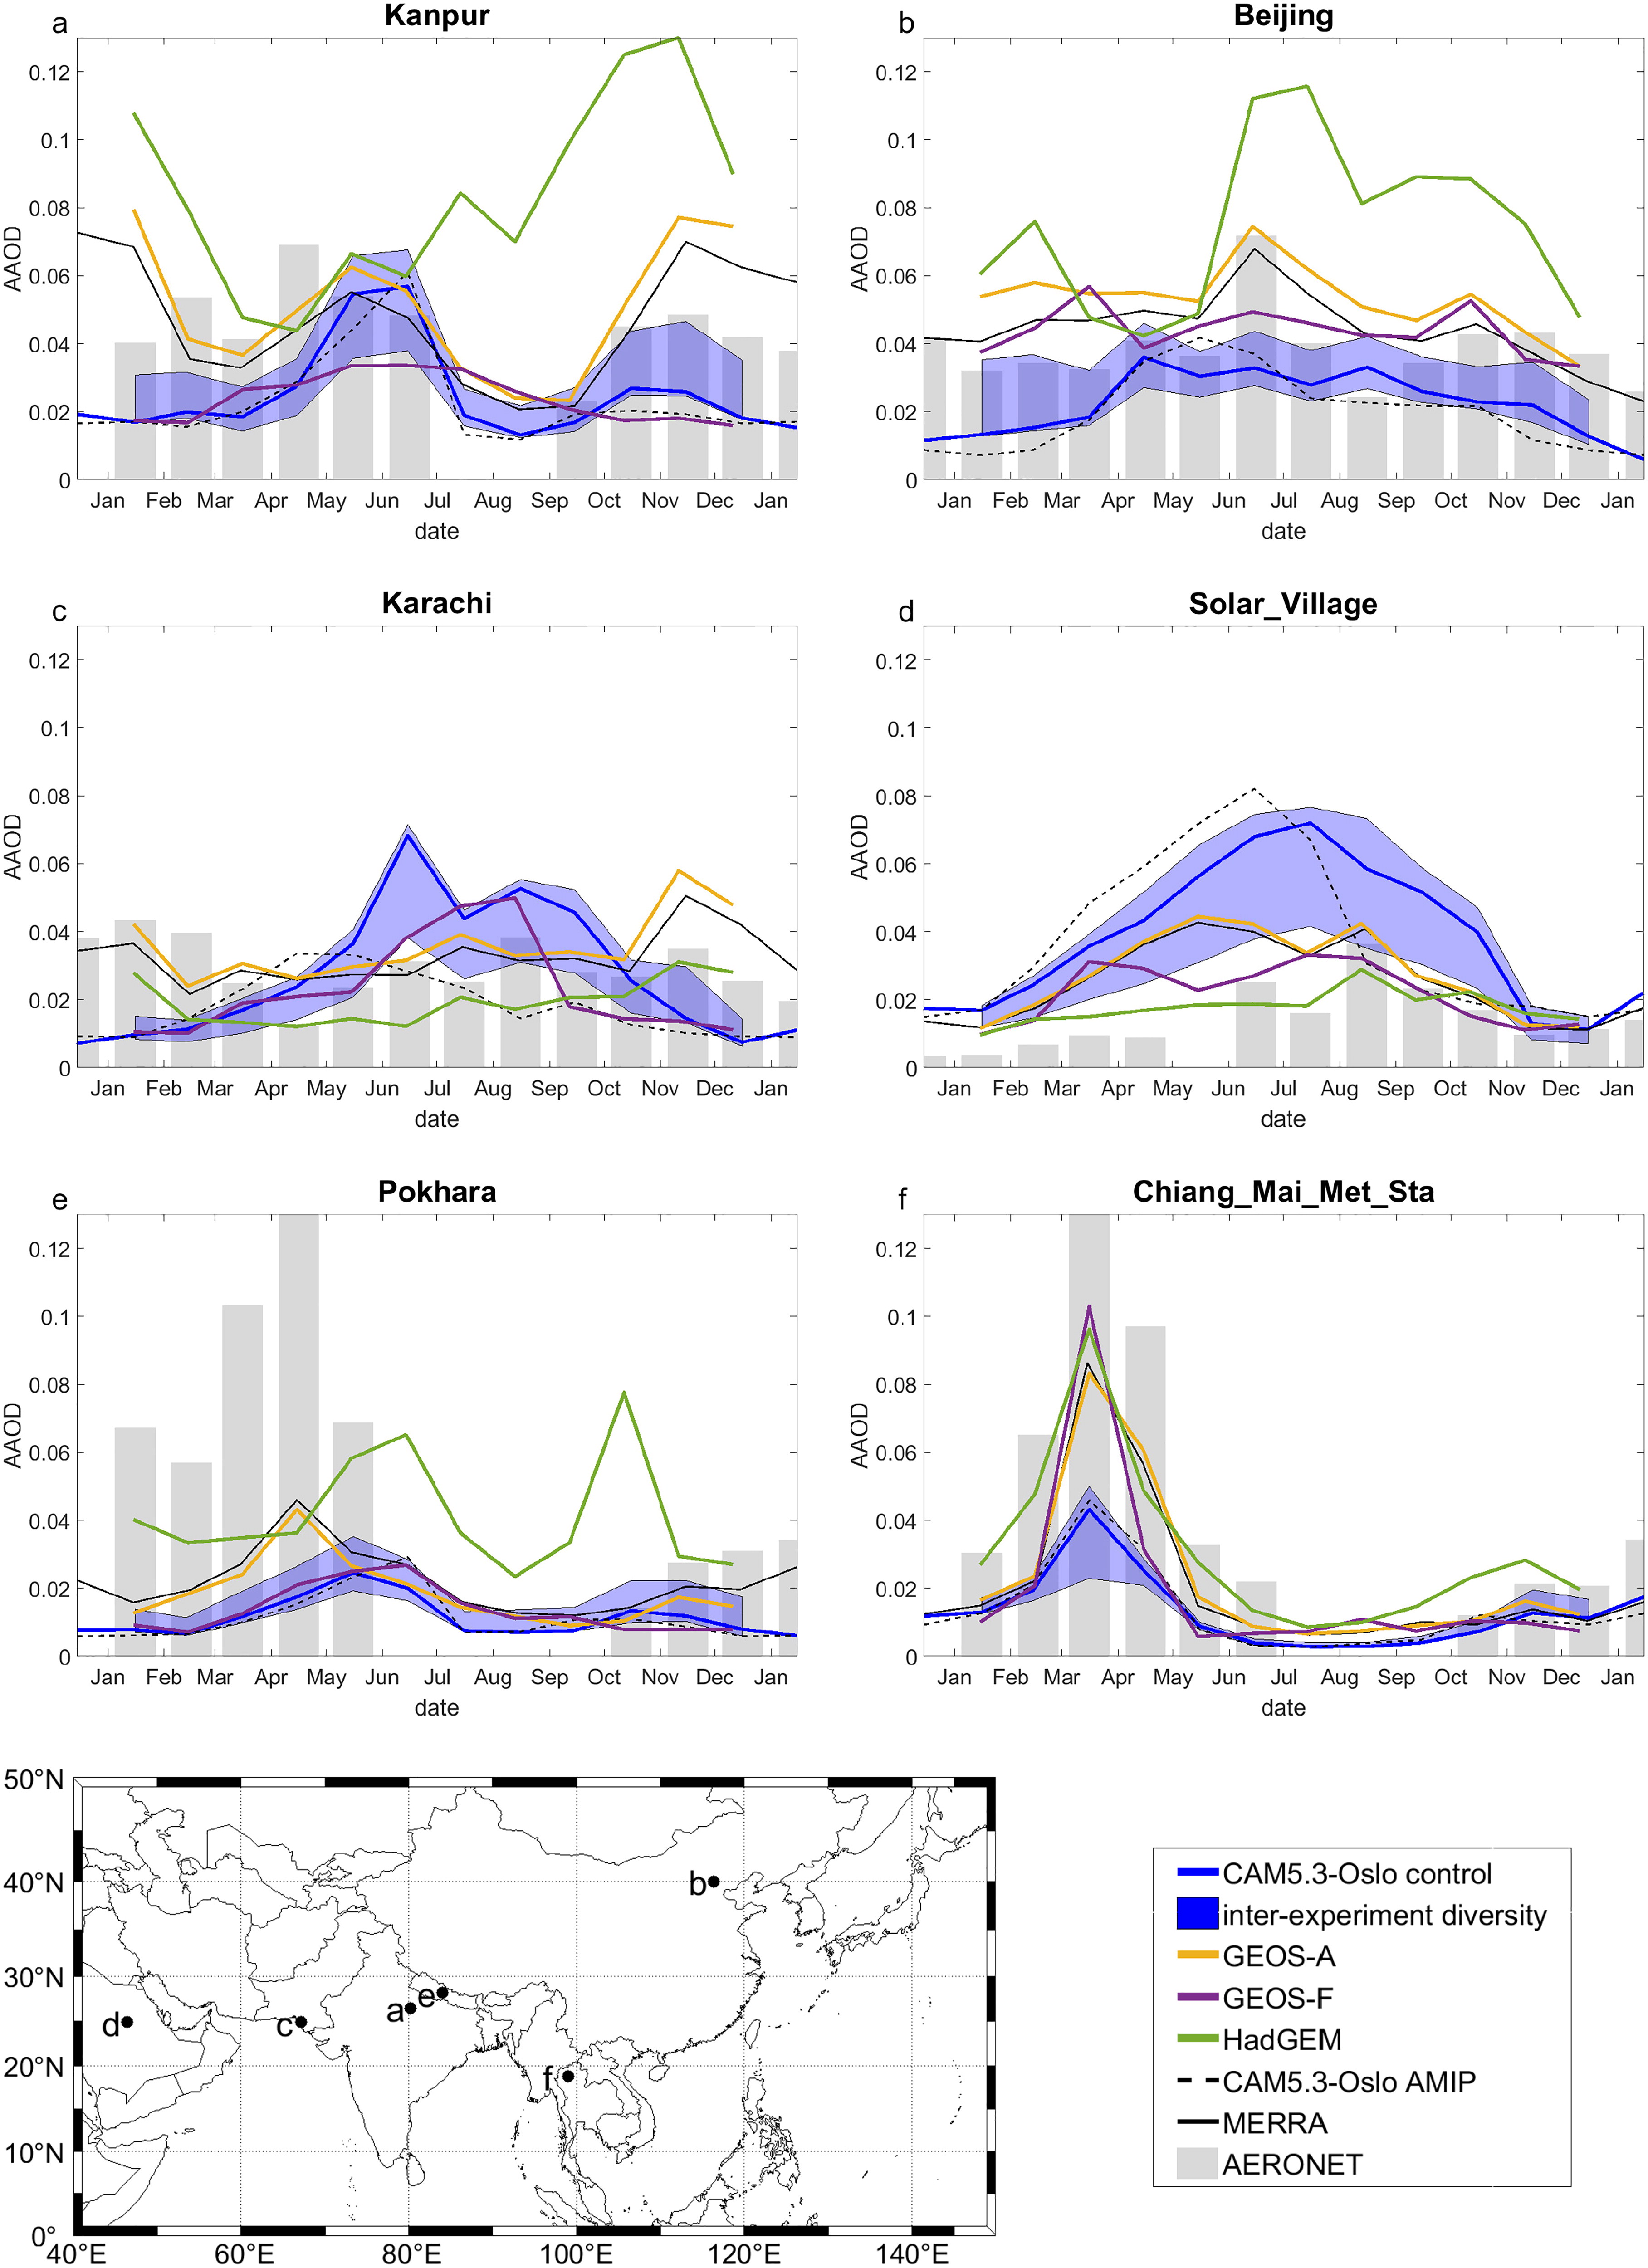
Fig. 7.

AAOD seasonal variability for the year 2010 from the AMIP and nudged control simulations compared to AeroCom phase III models and AERONET AAOD monthly means (Level 1.5). The blue shaded area indicates the range of AAOD changes for all sensitivity experiments. The map in the bottom left corner shows the respective locations of the AERONET stations.
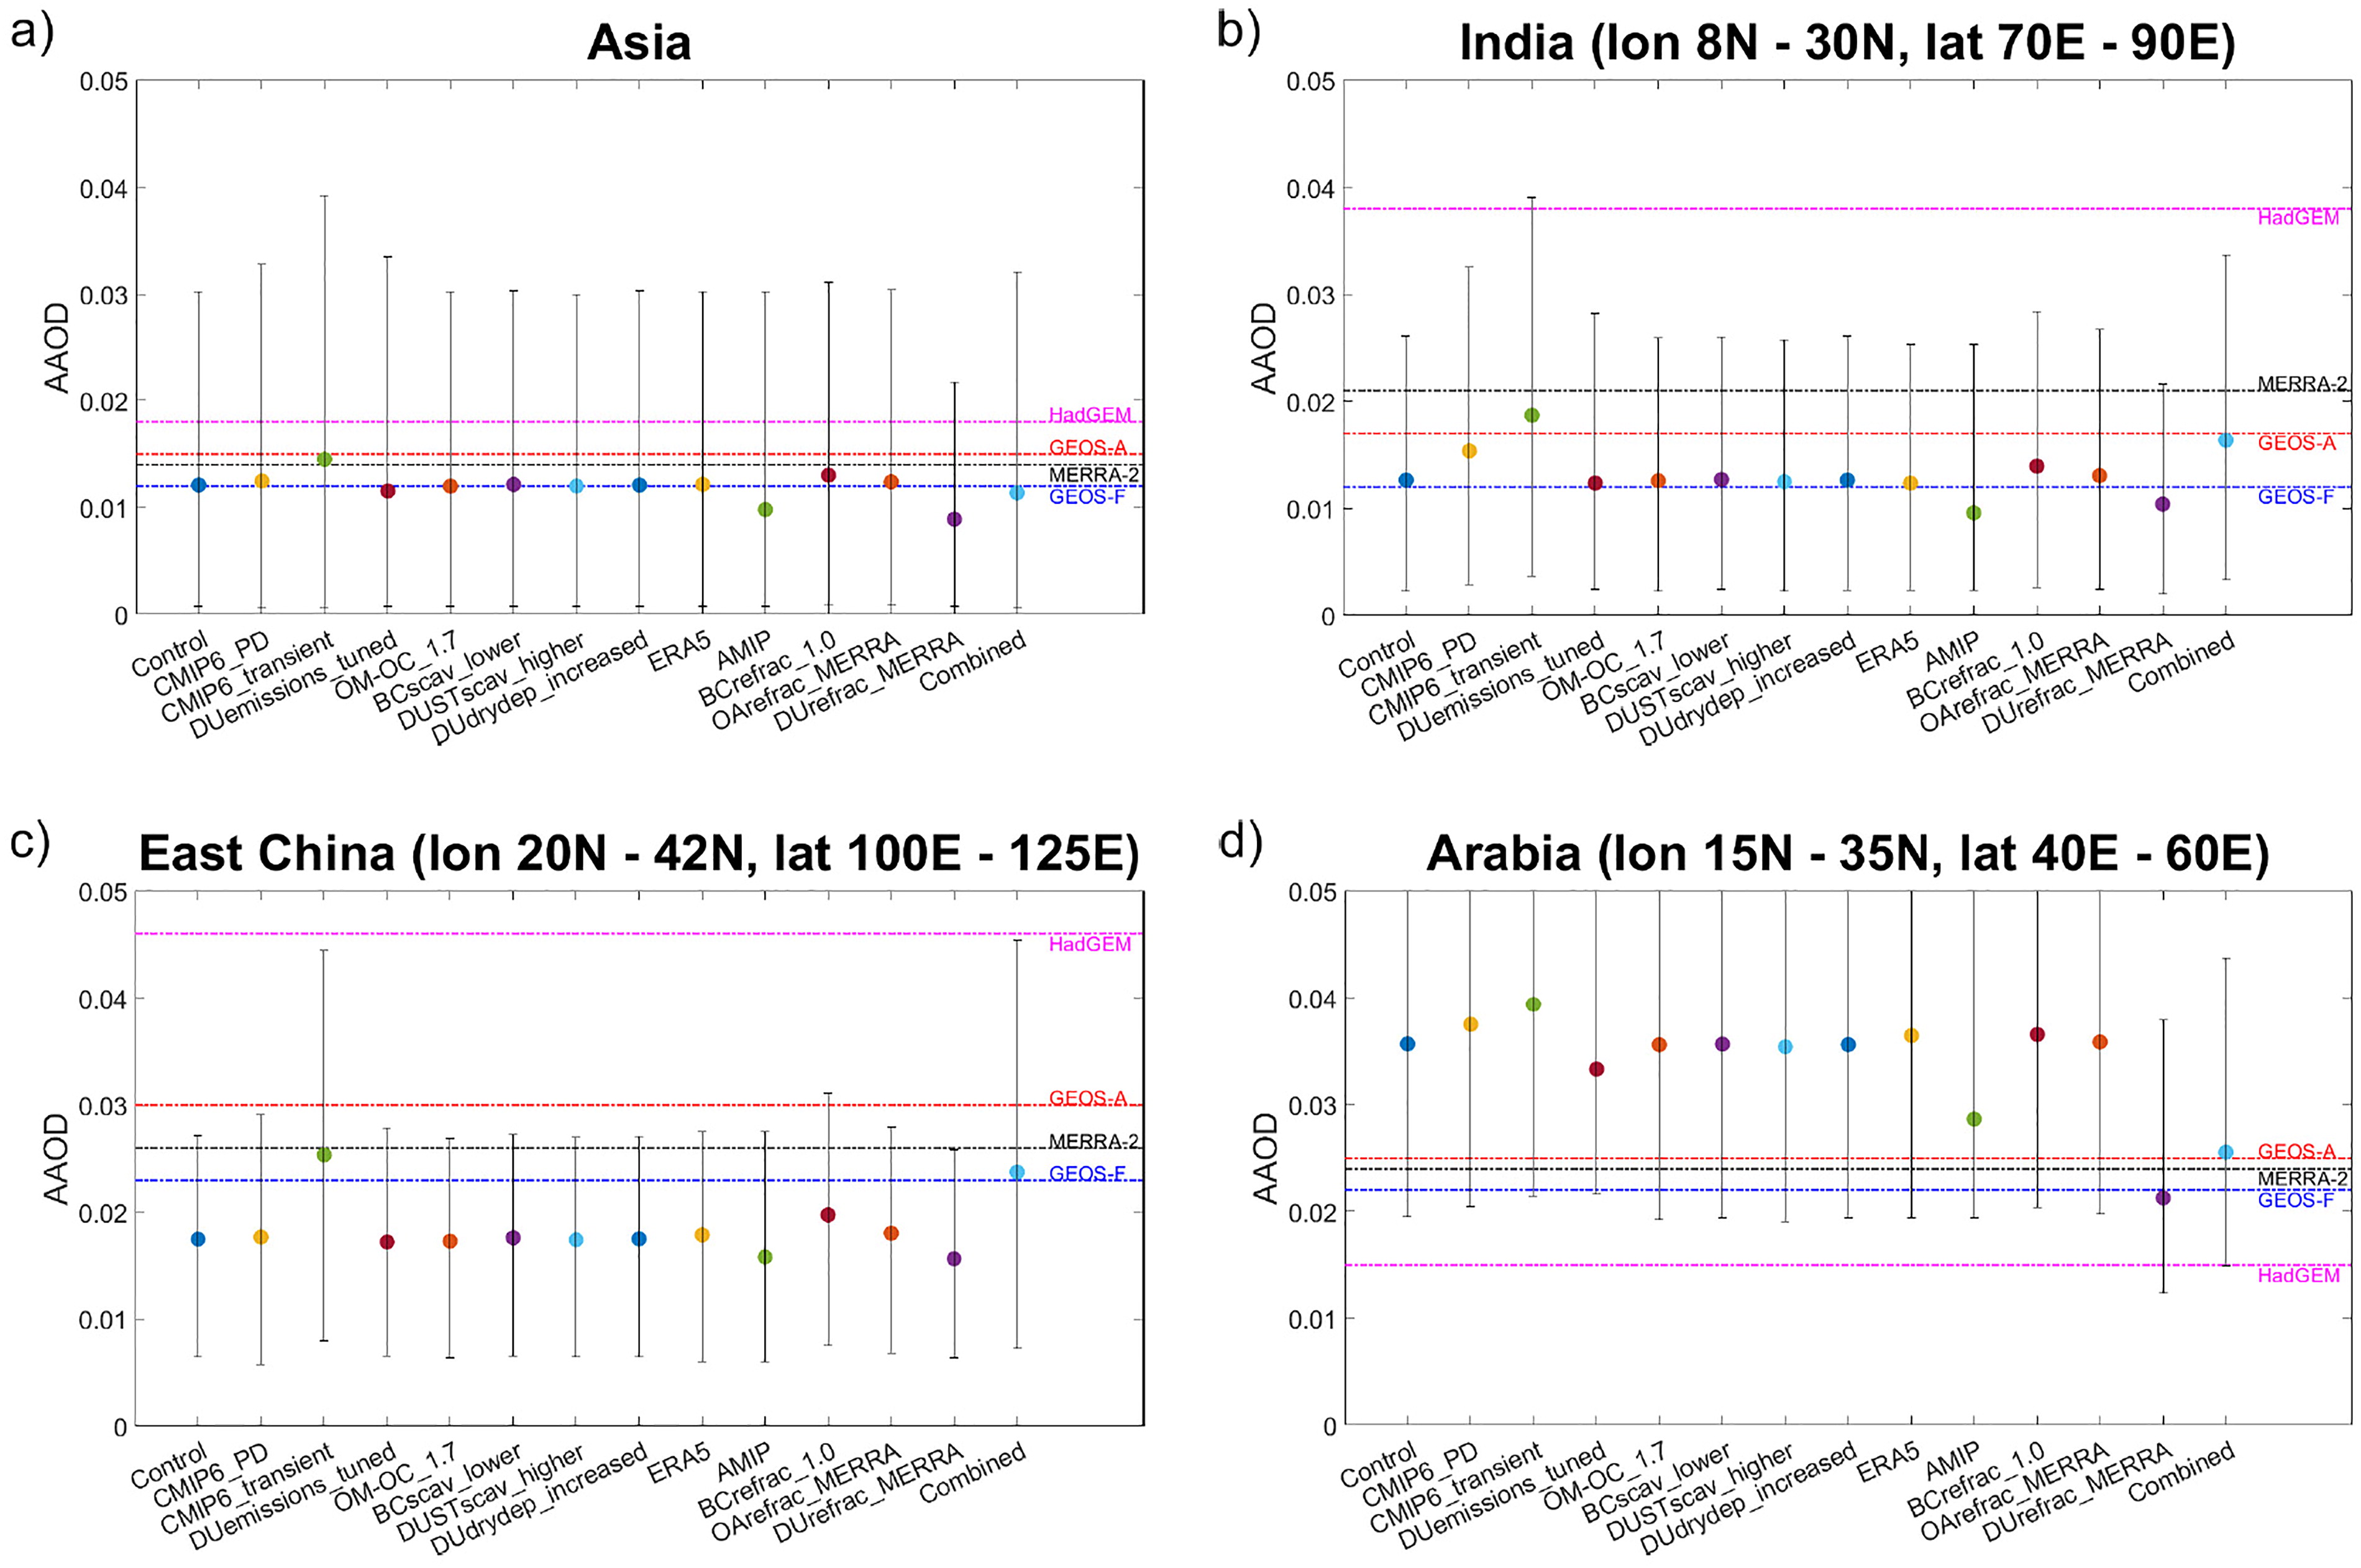
Fig. 8.

Regionally averaged AAOD for the control simulation, sensitivity experiments as well as MERRA-2 and the AeroCom phase III models. The error bars show the inter-quartile range. The regions are (a) the focus region Asia, (b) India, (c) East China and (d) Arabia.

Table 5.

Absolute regional mean in AAOD for the year 2010, the normalised mean bias (NMB, in %) and correlation (R) compared to AERONET data.

SimulationAAODNMBRBCOADustBCOADustBCOADustRadiativeemissionsemissionsemissionsburdenburdenburdenresidenceresidenceresidenceeffecttimetimetimeControl0.0121–130.181.66·10121.02·10116.57·10105.78·1075.97·1069.41·1055.55.081.88Δ AAODΔ emissionsΔ burden(%)(%)(%)(%)(%)(%)(%)CMIP6_PD1.3–90.197–23–0.512–11–0.45.705.141.88–0.003CMIP6_transient20.880.2651–4–0.658–3–0.75.905.201.87–0.002DU_emissions_tuned–2.8–130.1800–60–0.3–65.495.071.87–0.06OM-OC_1.7–1.6–140.180–16–0.3–0.2–11.6–0.15.465.021.88+0.104BCscav_lower0.8–130.180001.2005.605.091.88+0.002DUscav_higher–0.9–140.1800–0.1–0.1–0.3–1.25.485.061.86+0.02DUdrydep_increased0–130.1800–0.10005.495.081.88+0.003ERA5–1–130.18001.3–0.6–11.55.404.971.91+0.017AMIP–18.5–230.150–0.2–17.7–6.3–8.3–23.95.414.821.85+ 1.525BCrefrac_1.011.2–70.2100–0.50.10.1–0.45.525.101.88+0.05OArefrac_MERRA4.6–120.1900–0.300–0.25.505.091.88+0.01DUrefrac_MERRA–16.7–320.30000.30005.505.091.88–0.021Combined3–120.3851–41.457–31.65.815.101.9–0.01

[i] The aerosol emissions (in kg m–2 s–1) and column burden (in kg m–2) for the control simulation and the relative regional mean changes between the control and sensitivity experiments for each property, as well as the global residence time in days and radiative effect (in W m–2) for each simulation.

Language: English
Page range: 1909815 - 1909815
Published on: Jan 1, 2021
Published by: Stockholm University Press
In partnership with: Paradigm Publishing Services

© 2021 L. Frey, F. Höpner, Alf Kirkevåg, F. A.-M. Bender, published by Stockholm University Press
This work is licensed under the Creative Commons Attribution 4.0 License.